
辽中南地区城市增长与收缩时空演化及其影响因素——基于城市实体地域视角
|
梁源钊,男,广东东莞人,硕士研究生,研究方向为人口地理学。E-mail: liangyz309@nenu.edu.cn |
收稿日期: 2023-11-30
修回日期: 2024-04-03
网络出版日期: 2024-07-22
基金资助
国家自然科学基金面上项目(41971202)
Spatiotemporal evolution and influencing factors of urban growth and shrinkage in Central and Southern Liaoning: Based on the perspective of physical urban area
Received date: 2023-11-30
Revised date: 2024-04-03
Online published: 2024-07-22
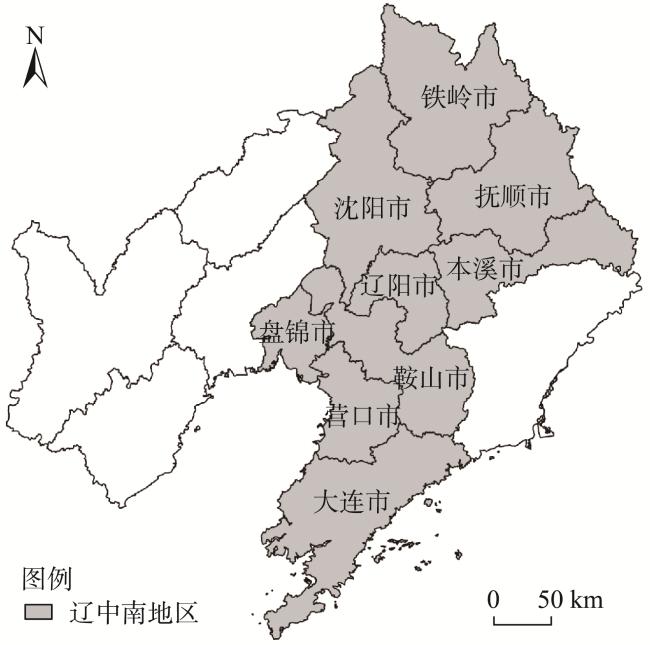
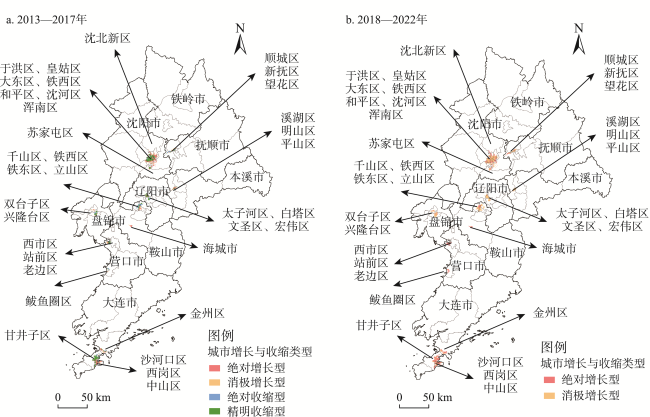
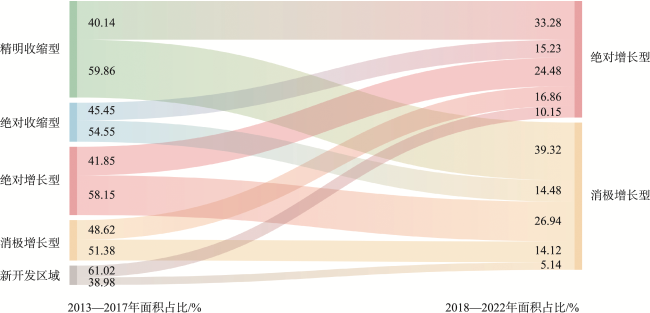
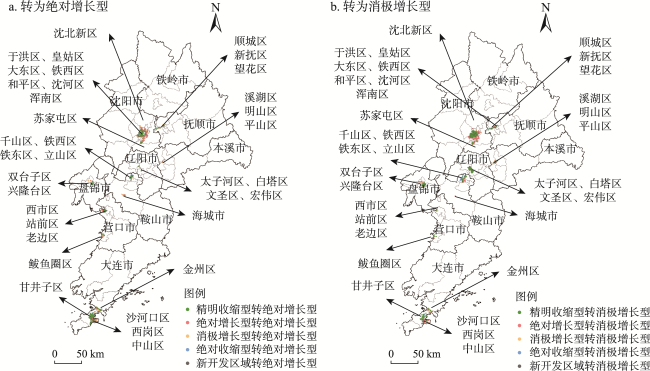
【目的】受限于社会经济数据空间化技术的发展,过往城市实体地域尺度下的城市收缩影响因素研究大多停留于定性分析或以行政地域口径数据代替实体地域口径数据开展定量化分析的阶段。突破社会经济数据在城市实体地域内的空间化,是真正实现实体地域尺度下影响因素定量化分析的首要前提。【方法】通过构建VANUI指数和综合门槛阈值设定,实现了对辽中南地区城市实体地域的范围确定。立足于“新东北现象”的时代背景,通过对2013—2017年和2018—2022年夜间灯光DN值和LandScan人口栅格数据两时段一元线性回归斜率的叠加,将城市实体地域划分为绝对增长型、消极增长型、精明收缩型和绝对收缩型4类,并进行了时空演化分析。通过CRITIC与熵值法组合赋权,利用夜间灯光和POI数据实现了经济发展水平、医疗服务水平、教育资源丰度、文化设施密度、环境宜居程度和对外交通便利程度等影响因素数据的空间化。最后,利用GTWR模型对辽中南地区城市人口增长与收缩的影响因素进行了定量化分析。【结果】①2013—2017年辽中南地区各城市内的收缩型区域在2018—2022年全部转变为增长型;②2018—2022年消极增长型占比超半数(55.80%);③医疗服务水平、教育资源丰度、文化设施密度和环境宜居程度在两时段对各城市的人口增长整体起正向作用,但第二时段正向作用普遍出现弱化;而对外交通便利程度和经济发展水平两时段均呈现负向作用。【结论】①辽中南地区的城市人口收缩已实现增长转变,现阶段更多表现为人口、社会、经济发展的不适配问题。②各城市人口、社会、经济的多维度收缩不普遍,且具有短期内实现增长转变的可能和明显的城市层级差异。③资源枯竭和产业转型伴随的社会、经济发展阵痛,致使与城市经济发展捆绑度较高的医疗、教育、文化设施配给和人居环境提升等对人口的正向吸附作用出现弱化。④各城市对外交通系统的发展现阶段存在助推人口流失的作用。
梁源钊 , 魏冶 , 何静仪 . 辽中南地区城市增长与收缩时空演化及其影响因素——基于城市实体地域视角[J]. 资源科学, 2024 , 46(6) : 1103 -1118 . DOI: 10.18402/resci.2024.06.05
[Objective] Due to the limited development of spatialization technology for socioeconomic data, previous research on the factors that affect urban shrinkage at the physical area scale of cities has mostly remained at the stage of qualitative analysis or quantitative analysis using administrative area data instead of physical area data. Breaking through the limit of spatialization of socioeconomic data within physical urban areas is the primary prerequisite for achieving quantitative analysis of influencing factors at the physical area scale. [Methods] By constructing the VANUI index and setting a comprehensive threshold, the scope of physical urban areas in Central and Southern Liaoning was determined. Based on the superposition of the slopes of univariate linear regression between the DN values of nighttime light and LandScan population grid data in the periods of 2013-2017 and 2018-2022, the physical urban areas were divided into four types: absolute growth type, negative growth type, smart shrinkage type, and absolute shrinkage type, and a spatiotemporal evolution analysis was conducted, based on the historical background of the “New Northeast Phenomenon”. By combining CRITIC and entropy weight method for equal weighting, the spatialization of data on influencing factors such as economic development level, medical service level, educational resource abundance, cultural facility density, livability of the environment, and external transportation convenience was achieved using nighttime light data and point of interest (POI) data. Finally, the GTWR model was used to quantitatively analyze the influencing factors of urban population growth and shrinkage during the two periods of the region. [Results] (1) The shrinking areas within cities from 2013 to 2017 in Central and Southern Liaoning were all transformed into growing areas from 2018 to 2022. (2) From 2018 to 2022, the proportion of negative growing areas within cities reached 55.80%. (3) The level of medical services, abundance of educational resources, density of cultural facilities, and livability of the environment all had a positive effect on the overall population growth in each city, but the positive effect was generally weakened in the second period. The overall negative effects of external transportation convenience and economic development level were observed during the two periods. [Conclusions] (1) The urban population shrinkage of Central and Southern Liaoning has achieved a growing transformation, and at present, all cities are more characterized by the mismatch of population, social, and economic development. (2) The multidimensional shrinkage of population, society, and economy within all cities is not common. There is a possibility of achieving growing transformation in the short term, and there are significant differences by urban hierarchy. (3) The social and economic development pains accompanied by resource depletion and industrial transformation have weakened the positive attraction of medical, educational, and cultural facility provisions and improvement of the living environment, which are highly tied to economic development, on population. (4) The development of the external transportation system currently has played a role in promoting population loss in cities.
表1 部分影响因素及其POI类型、权重(除经济发展水平外)Table 1 Some influencing factors and their point of interest types and weights (excluding the factor of economic development level) |
| 影响因素 | POI类型(权重) |
|---|---|
| 医疗服务水平 | 诊所(0.322)、专科医院(0.334)、综合医院(0.343) |
| 教育资源丰度 | 幼儿园(0.171)、小学(0.189)、中学(0.220)、高等 院校(0.127)、成人学校(0.115)、职业技术学校(0.177) |
| 文化设施密度 | 博物馆(0.246)、科技馆(0.198)、美术馆(0.180)、图书馆(0.137)、文化宫(0.238) |
| 环境宜居程度 | 公园(0.467)、广场(0.428)、植物园(0.105) |
| 对外交通便利 程度 | 机场(0.191)、火车站(0.235)、长途汽车客运站(0.574) |
表2 两时段各类型区域面积占比变化Table 2 Changes in the proportion of different types of areas during the two periods |
| 时段 | 类型 | 面积/km2 | 占比/% |
|---|---|---|---|
| 2013—2017年 | 绝对增长型 | 259.25 | 27.91 |
| 消极增长型 | 153.75 | 16.55 | |
| 精明收缩型 | 367.50 | 39.56 | |
| 绝对收缩型 | 148.50 | 15.98 | |
| 2018—2022年 | 绝对增长型 | 443.25 | 44.20 |
| 消极增长型 | 559.50 | 55.80 |
图3 2013—2022年辽中南地区城市增长与收缩区域的演化路径及面积占比Figure 3 Transformation path and areal proportion of urban growth and shrinkage areas in the Central and Southern Liaoning, 2013-2022 |
表3 POOL、TWR、GWR、GTWR模型的R2、调整R2和AIC值Table 3 R2, adjusted R2, and AIC values for the POOL, TWR, GWR, and GTWR models |
| 时段 | 参数 | POOL | TWR | GWR | GTWR |
|---|---|---|---|---|---|
| 2013—2017年 | R2 | 0.327 | 0.826 | 0.773 | 0.829 |
| 调整R2 | 0.326 | 0.804 | 0.760 | 0.805 | |
| AIC | 305764.460 | 309820.805 | 305467.114 | ||
| 2018—2022年 | R2 | 0.243 | 0.855 | 0.855 | 0.835 |
| 调整R2 | 0.243 | 0.827 | 0.829 | 0.807 | |
| AIC | 317307.044 | 317122.326 | 319563.724 |
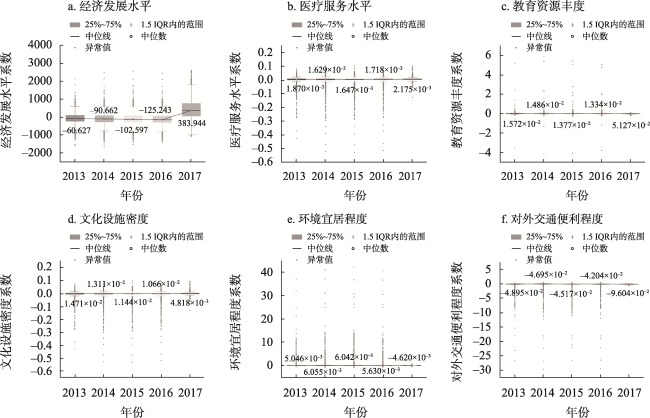
表4 2013—2017年GTWR模型各解释变量回归系数的描述性统计Table 4 Descriptive statistics of regression coefficients of various explanatory variables in the GTWR model, 2013-2017 |
| 变量 | 最小值 | 下分位数 | 中位数 | 上分位数 | 最大值 | 平均值 | 标准差 | 变异系数/% |
|---|---|---|---|---|---|---|---|---|
| 医疗服务水平 | -0.529 | -0.002 | 0.002 | 0.006 | 0.103 | -0.002 | 0.032 | -1478.851 |
| 教育资源丰度 | -4.116 | 0.001 | 0.012 | 0.029 | 11.170 | 0.028 | 0.230 | 829.143 |
| 文化设施密度 | -48.450 | -0.023 | 0.010 | 0.054 | 10.968 | -0.072 | 1.542 | -2134.152 |
| 环境宜居程度 | -1.065 | -0.016 | 0.003 | 0.032 | 42.342 | 0.315 | 2.070 | 656.125 |
| 对外交通便利程度 | -30.593 | -0.114 | -0.053 | -0.015 | 0.716 | -0.290 | 1.496 | -516.340 |
| 经济发展水平 | -1681.141 | -224.138 | -32.118 | 195.690 | 3059.087 | 30.274 | 462.481 | 1527.649 |
注:核函数类型为高斯核函数,带宽类型为自适应带宽,带宽为16,样本量为18580。 |
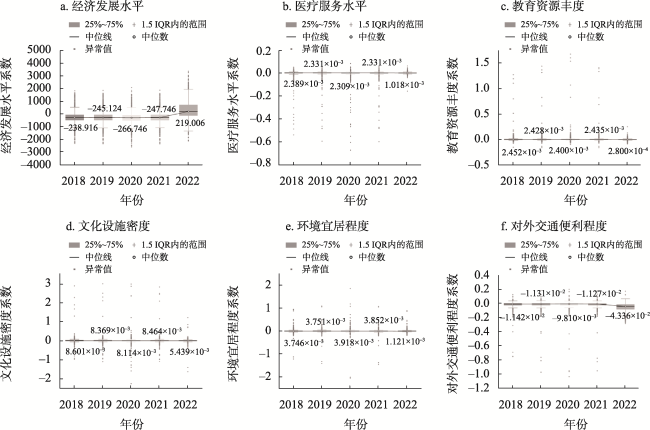
表5 2018—2022年GTWR模型各解释变量回归系数的描述性统计Table 5 Descriptive statistics of regression coefficients of various explanatory variables in the GTWR model, 2018-2022 |
| 变量 | 最小值 | 下分位数 | 中位数 | 上分位数 | 最大值 | 平均值 | 标准差 | 变异系数/% |
|---|---|---|---|---|---|---|---|---|
| 医疗服务水平 | -0.678 | 0.000 | 0.002 | 0.005 | 0.084 | 0.000 | 0.028 | 21647.964 |
| 教育资源丰度 | -0.475 | -0.002 | 0.002 | 0.008 | 1.673 | 0.007 | 0.057 | 768.133 |
| 文化设施密度 | -2.252 | -0.005 | 0.008 | 0.029 | 4.914 | 0.013 | 0.129 | 1007.020 |
| 环境宜居程度 | -2.508 | -0.004 | 0.003 | 0.018 | 1.868 | 0.010 | 0.074 | 765.402 |
| 对外交通便利程度 | -1.037 | -0.035 | -0.015 | -0.003 | 0.199 | -0.027 | 0.049 | -180.761 |
| 经济发展水平 | -2603.867 | -419.741 | -196.087 | 62.573 | 3520.892 | -137.862 | 587.717 | -426.309 |
注:核函数类型为高斯核函数,带宽类型为自适应带宽,带宽为17,样本量为20055。 |
| [1] |
王争磊, 乔家君, 朱乾坤, 等. 河南省专业村人口收缩时空特征及影响因素[J]. 资源科学, 2024, 46(2): 352-367.
[
|
| [2] |
孙平军, 张可秋, 曹乃刚, 等. 东北区域性城市收缩的地理认知与治理逻辑[J/OL]. 地理学报, (2023-11-24) [2024-06-18]. https://link.cnki.net/urlid/11.1856.P.20231123.1336.002.
[
|
| [3] |
戚伟, 刘振, 刘盛和, 等. 基于“城区常住人口”的2010-2020年中国收缩城市识别[J]. 地理研究, 2023, 42(10): 2539-2555.
[
|
| [4] |
梁源钊, 魏冶. 城市收缩的时空格局与影响因素: 德国东部地区与中国东北地区的对比研究[J/OL]. 世界地理研究, (2023-06-29) [2023-11-15]. http://kns.cnki.net/kcms/detail/31.1626.P.20230628.1232.002.html.
[
|
| [5] |
吴康, 戚伟. 收缩型城市: 认知误区、统计甄别与测算反思[J]. 地理研究, 2021, 40(1): 213-229.
[
|
| [6] |
李妍琳, 李鹤. 人口收缩背景下资源型城市住宅价格的差异化响应及影响因素[J]. 自然资源学报, 2023, 38(1): 157-170.
[
|
| [7] |
林靖杰, 张京祥. 北京城市空间增长-收缩并存的特征与机制[J]. 城市规划, 2023, 47(11): 90-100.
[
|
| [8] |
林思仪, 赵渺希, 王笑涵. 局部收缩背景下深圳都市圈企业更替格局及机制[J]. 资源科学, 2024, 46(2): 262-278.
[
|
| [9] |
刘菊, 孙平军. 东北三省收缩城市的基本公共服务均等化收缩效应与机理解析[J]. 人文地理, 2023, 38(3): 128-137.
[
|
| [10] |
闫广华, 陈曦, 张云. 基于随机森林模型的东北地区收缩城市分布格局及影响因素研究[J]. 地理科学, 2021, 41(5): 880-889.
[
|
| [11] |
文余源, 刘洋, 邢晓旭, 等. 人口收缩视角下中国产业集聚与城市人口规模演化及其关系[J]. 经济地理, 2023, 43(11): 115-125.
[
|
| [12] |
周一星, 史育龙. 建立中国城市的实体地域概念[J]. 地理学报, 1995, 50(4): 289-301.
[
|
| [13] |
孟祥凤, 马爽, 项雯怡, 等. 基于百度慧眼的中国收缩城市分类研究[J]. 地理学报, 2021, 76(10): 2477-2488.
[
|
| [14] |
陈曦. 东北地区实体城市视角下收缩城市及其空间收缩模式研究[D]. 长春: 长春师范大学, 2022.
[
|
| [15] |
孙千里. 湖北省实体城市收缩识别及其空间特征与影响因素研究[D]. 武汉: 湖北大学, 2023.
[
|
| [16] |
孙斌栋, 张之帆, 李琬. 中国省域人口空间结构特征及其对经济绩效的影响: 基于实体城市的空间识别[J]. 地理科学, 2021, 41(11): 1884-1896.
[
|
| [17] |
乔艺波, 罗震东. 多中心空间结构对中国城市创新绩效的影响: 基于279个地级及以上城市的实证[J/OL]. 城市规划, (2023-08-24) [2024-01-27]. http://kns.cnki.net/kcms/detail/11.2378.TU.20230823.1451.002.html.
[
|
| [18] |
钱凤魁, 朱益梅, 张晓霞, 等. 辽宁省城市收缩综合测度及影响因素分析[J]. 中国土地科学, 2021, 35(9): 74-83.
[
|
| [19] |
|
| [20] |
赵小风, 涂刘欣, 孟浩, 等. 中国城乡建设用地减量化研究进展及展望[J]. 资源科学, 2024, 46(2): 235-248.
[
|
| [21] |
张少华, 陈洁仪. 中国城市收缩研究: 基于资源错配的视角[J]. 中国经济学, 2022, (2): 46-81.
[
|
| [22] |
孙平军. 城市收缩: 内涵·中国化·研究框架[J]. 地理科学进展, 2022, 41(8): 1478-1491.
[
|
| [23] |
郑洁, 汪甜甜, 陈浩. 长江经济带人口收缩城市的识别与影响因素分析[J]. 华东经济管理, 2022, 36(8): 13-25.
[
|
| [24] |
张帅, 王成新, 王敬, 等. 中国城市收缩的综合测度及其时空分异特征研究[J]. 中国人口·资源与环境, 2020, 30(8): 72-82.
[
|
| [25] |
郭红翔, 朱文泉. 社会经济统计数据空间化研究进展[J]. 地理学报, 2022, 77(10): 2650-2667.
[
|
| [26] |
张恒硕, 李绍萍, 彭民. 中国农村能源消费碳排放区域非均衡性及驱动因素动态识别[J]. 中国农村经济, 2022, (1): 112-134.
[
|
| [27] |
王琳, 钟泓文, 许章华, 等. Luojia-01夜光数据和“点轴发育”理论支持下的夜间经济集聚区定量识别与分类方法[J]. 地球信息科学学报, 2022, 24(11): 2141-2152.
[
|
| [28] |
李娜, 吴凯萍. 基于POI数据的城市功能区识别与分布特征研究[J]. 遥感技术与应用, 2022, 37(6): 1482-1491.
[
|
| [29] |
吴忠, 关娇, 何江. 最低工资标准测算实证研究: 基于CRITIC-熵权法客观赋权的动态组合测算[J]. 当代经济科学, 2019, 41(3): 103-117.
[
|
| [30] |
高同彪, 刘云达. 东北地区城市群高质量发展研究[J]. 社会科学战线, 2020, (11): 245-250.
[
|
| [31] |
|
| [32] |
|
| [33] |
|
| [34] |
|
| [35] |
吕新鹏. 辽宁省高等教育财政投入优化研究[D]. 沈阳: 沈阳大学, 2014.
[
|
| [36] |
|
/
| 〈 |
|
〉 |