
中国口粮自给率的区域非均衡特征及空间收敛
|
杨一单,女,陕西汉中人,博士研究生,主要研究方向为农业资源经济等。E-mail: echo_d0815@163.com |
收稿日期: 2023-05-15
修回日期: 2023-08-02
网络出版日期: 2024-05-29
基金资助
赣鄱俊才支持计划·文化领军人才培养项目(23RCZZ18)
国家自然科学基金项目(41761110)
Regional non-equilibrium characteristics and spatial convergence of China’s self-sufficiency rate of rations
Received date: 2023-05-15
Revised date: 2023-08-02
Online published: 2024-05-29
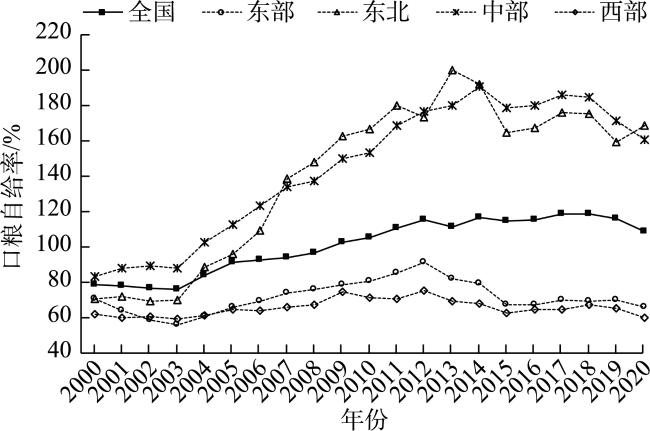
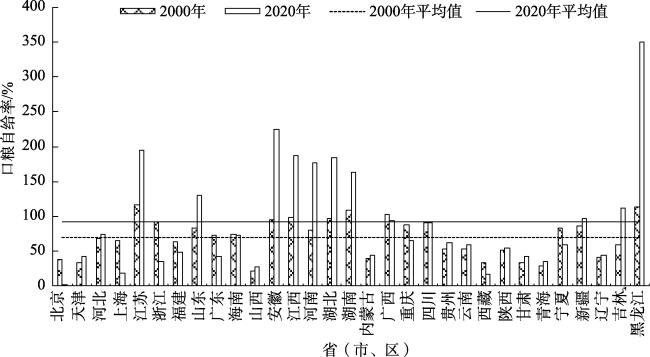
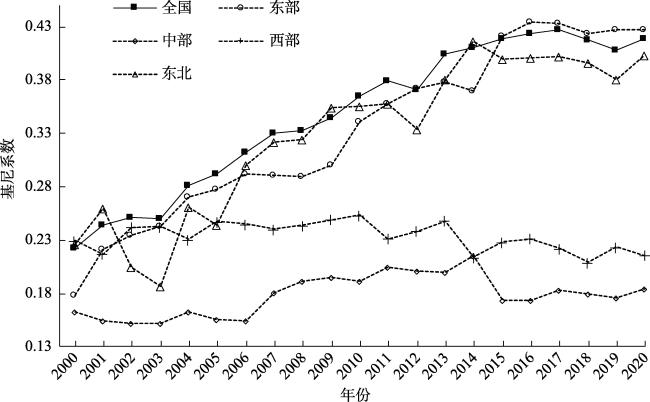
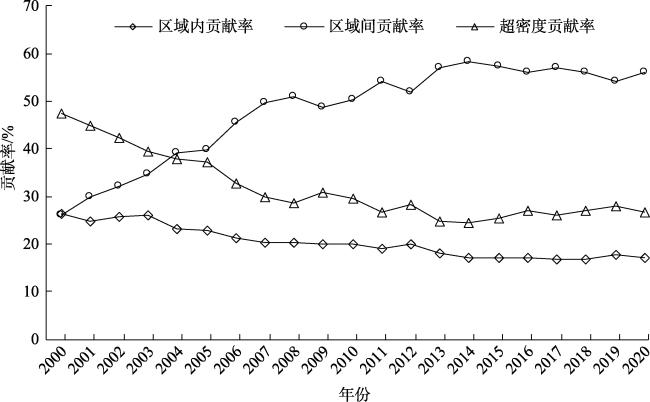
【目的】从消费和需求两个角度探讨口粮安全的区域差异和空间敛散性,以期为各区域更好地承担口粮安全责任提供科学依据。【方法】本文以口粮自给率作为衡量口粮安全的标准,基于消费统计法测量2000—2020年中国省域口粮自给率,利用Dagum基尼系数及其分解方法考察全国及四大区域口粮自给率相对差异的大小、来源及演变态势,进一步应用Kernel密度估计及空间收敛分析其绝对差异分布的动态演进过程及空间敛散性特征。【结果】①2000—2020年全国口粮自给率呈三阶段上升,四大区域口粮自给率上升程度差异明显,上升程度总体呈现中部>东北>东部>西部的变化特征。②研究期内,东部及东北地区口粮自给率区域内差异显著扩大,中、西部地区略微扩大;区域间差异对全国口粮自给率区域差异的贡献率均值高达47.92%,远高于区域内差异20.38%的贡献率和超变密度31.71%的贡献率。③与西部地区不同,东部、中部和东北地区口粮自给率在分布形态和极化趋势上相似,表明研究期内三大区域内的绝对差异不断扩大,存在高低两极分化现象。④空间溢出效应情境下,全国和四大区域口粮自给率均存在显著的绝对β收敛和条件β收敛,口粮生产的各影响因素对区域口粮自给率条件收敛起着决定作用。【结论】中国整体口粮的绝对安全掩盖了区域口粮的不安全,但是未来口粮安全区域差异有缩小的可能。
杨一单 , 姚成胜 , 高云鹏 , 刘伟芳 . 中国口粮自给率的区域非均衡特征及空间收敛[J]. 资源科学, 2024 , 46(4) : 786 -800 . DOI: 10.18402/resci.2024.04.10
[Objective] This article discussed the regional differences and spatial convergence of ration security from the perspectives of consumption and demand, in order to provide a scientific basis for each region to better assume the due responsibility of ration safety. [Methods] In order to examine the spatial differentiation characteristics and distribution dynamics of ration self-sufficiency rate in the four main regions of China, this study used the consumption statistics method and measured the self-sufficiency rate of rations based on provincial data from 2000 to 2020. We used the Dagum Gini coefficient and its decomposition method to investigate the degree, source, and trend of change of regional relative differences of ration self-sufficiency in China and its four regions. On this basis, the kernel density estimation method and spatial convergence were further used to describe the dynamic change process of distribution and spatial convergence characteristics of absolute difference. [Results] (1) From 2000 to 2020, the national ration self-sufficiency rate kept rising in three stages and in the four regions it was significantly different. The ration self-sufficiency rate of the four regions in descending order were central China, northeast China, eastern China, and western China. (2) During the study period, the regional differences of the ration self-sufficiency rate increased significantly in eastern and northeastern China, but only slightly in central and western China. However, the average contribution rate of the difference of ration self-sufficiency rate among the four regions to the interregional differences was 47.92%, much higher than the contribution rate of intraregional difference of 20.38% and super-density of 31.71%. (3) Different from the western region, the distribution pattern and polarization trend of the ration self-sufficiency rate in the eastern, central, and northeastern regions were similar, indicating that the absolute differences in the three regions were expanding continuously, and there was a phenomenon of high and low polarization. (4) Considering the spatial spillover effect, the absolute β convergence and conditional β convergence of the ration self-sufficiency rate existed in the whole country and the four main regions. The influencing factors of the ration production played a decisive role in the conditional convergence of the regional ration self-sufficiency rate. [Conclusion] The overall absolute security of China’s ration provision obscured regional insecurity, downplaying the research on regional differences of ration security. But regional differences in ration security are likely to narrow in the future.
图3 2000—2020年全国及四大区域内口粮自给率基尼系数Figure 3 Gini coefficient of ration self-sufficiency rate in China and its four regions, 2000-2020 |
表1 2000—2020年中国各大区域间口粮自给率差异的基尼系数Table 1 Gini coefficient of the difference of ration self-sufficiency rate among different regions in China, 2000-2020 |
| 年份 | 东部-东北 | 东部-中部 | 东部-西部 | 东北-中部 | 东北-西部 | 中部-西部 |
|---|---|---|---|---|---|---|
| 2000 | 0.226 | 0.213 | 0.221 | 0.249 | 0.251 | 0.252 |
| 2001 | 0.270 | 0.264 | 0.235 | 0.265 | 0.270 | 0.270 |
| 2002 | 0.240 | 0.296 | 0.255 | 0.235 | 0.241 | 0.269 |
| 2003 | 0.241 | 0.295 | 0.254 | 0.223 | 0.238 | 0.267 |
| 2004 | 0.313 | 0.341 | 0.262 | 0.268 | 0.303 | 0.321 |
| 2005 | 0.313 | 0.358 | 0.273 | 0.251 | 0.301 | 0.346 |
| 2006 | 0.361 | 0.368 | 0.277 | 0.300 | 0.361 | 0.381 |
| 2007 | 0.400 | 0.383 | 0.278 | 0.333 | 0.411 | 0.406 |
| 2008 | 0.418 | 0.378 | 0.280 | 0.319 | 0.431 | 0.396 |
| 2009 | 0.441 | 0.402 | 0.286 | 0.361 | 0.437 | 0.402 |
| 2010 | 0.454 | 0.414 | 0.317 | 0.360 | 0.458 | 0.429 |
| 2011 | 0.465 | 0.437 | 0.317 | 0.367 | 0.477 | 0.468 |
| 2012 | 0.432 | 0.433 | 0.327 | 0.354 | 0.434 | 0.458 |
| 2013 | 0.511 | 0.468 | 0.332 | 0.396 | 0.513 | 0.494 |
| 2014 | 0.530 | 0.473 | 0.323 | 0.402 | 0.538 | 0.518 |
| 2015 | 0.538 | 0.502 | 0.356 | 0.376 | 0.519 | 0.518 |
| 2016 | 0.545 | 0.511 | 0.365 | 0.382 | 0.515 | 0.520 |
| 2017 | 0.547 | 0.512 | 0.362 | 0.387 | 0.522 | 0.530 |
| 2018 | 0.544 | 0.512 | 0.350 | 0.382 | 0.512 | 0.517 |
| 2019 | 0.516 | 0.487 | 0.356 | 0.372 | 0.482 | 0.502 |
| 2020 | 0.551 | 0.490 | 0.355 | 0.393 | 0.530 | 0.507 |
| 均值 | 0.422 | 0.406 | 0.304 | 0.332 | 0.416 | 0.418 |
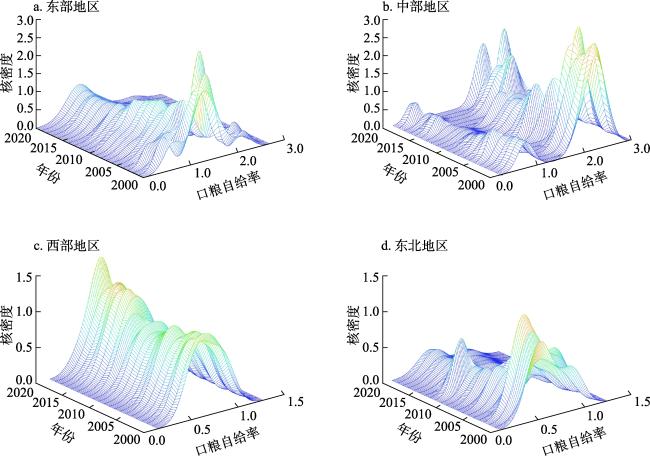
表2 2000—2020年中国口粮自给率动态演进特征Table 2 Dynamic change characteristics of ration self-sufficiency rate in China, 2000-2020 |
| 区域 | 分布位置 | 主峰分布形态 | 分布延展性 | 极化趋势 |
|---|---|---|---|---|
| 东部 | 左移 | 波峰下降,宽度扩大 | 右拖尾,延展拓宽 | 多极化向无极化 |
| 中部 | 右移 | 波峰下降,宽度扩大 | 左拖尾,延展变窄 | 多极化趋势 |
| 西部 | 左移 | 波峰上升,宽度缩小 | 右拖尾,延展拓宽 | 无极化趋势 |
| 东北 | 右移 | 波峰下降,宽度扩大 | 右拖尾,延展拓宽 | 多极化趋势 |
表3 2000-2020年口粮自给率Moran's ITable 3 Moran's I of ration self-sufficiency rate, 2000-2020 |
| 年份 | 2000 | 2001 | 2002 | 2003 | 2004 | 2005 | 2006 | 2007 | 2008 | 2009 | 2010 |
|---|---|---|---|---|---|---|---|---|---|---|---|
| Moran’s I | 0.179*** | 0.171*** | 0.184** | 0.075 | 0.229*** | 0.159** | 0.232*** | 0.140** | 0.171*** | 0.254*** | 0.241*** |
| Z值 | 2.542 | 2.448 | 2.049 | 1.049 | 2.445 | 2.022 | 2.793 | 2.072 | 2.448 | 2.865 | 2.664 |
| 年份 | 2011 | 2012 | 2013 | 2014 | 2015 | 2016 | 2017 | 2018 | 2019 | 2020 | |
| Moran’s I | 0.231*** | 0.191*** | 0.249*** | 0.161** | 0.120* | 0.121* | 0.258*** | 0.334*** | 0.465*** | 0.464*** | |
| Z值 | 2.516 | 2.365 | 2.69 | 1.938 | 1.46 | 1.474 | 2.777 | 3.666 | 4.972 | 4.968 |
注:*、**、***分别表示在10%、5%、1%水平上通过显著检验,下同。 |
表4 中国口粮自给率绝对β收敛结果Table 4 Absolute β convergence results of ration self-sufficiency rate in China |
| 全国 | 东部 | 中部 | 西部 | 东北 | |
|---|---|---|---|---|---|
| -0.359*** | -0.290*** | -0.460*** | -0.505*** | -0.368*** | |
| (-15.17) | (-8.09) | (-10.25) | (-11.16) | (-4.80) | |
| wfq | 0.173*** | -0.092 | 0.323*** | -0.033 | -0.115 |
| (4.06) | (-1.52) | (5.01) | (-0.32) | (-1.51) | |
| ρ | 0.294*** | 0.294*** | 0.181* | 0.031 | -0.033 |
| (5.85) | (4.37) | (1.73) | (0.32) | (-0.27) | |
| 收敛速度 | 0.022 | 0.017 | 0.031 | 0.035 | 0.023 |
表5 中国口粮自给率条件β收敛结果Table 5 Results of conditional β convergence of ration self-sufficiency rate in China |
| 全国 | 东部 | 中部 | 西部 | 东北 | |
|---|---|---|---|---|---|
| -0.637*** | -0.658*** | -0.798*** | -0.648*** | -0.978*** | |
| (-25.90) | (-14.70) | (-16.95) | (-14.44) | (-11.27) | |
| GRSA | 0.518*** | 0.338*** | 1.538*** | 0.326*** | 0.519 |
| (11.94) | (4.69) | (9.94) | (4.11) | (1.11) | |
| RPOP | -0.033 | -0.280** | -0.871*** | -0.071** | -0.659* |
| (-1.01) | (-2.53) | (-4.62) | (-2.47) | (-1.82) | |
| DAM | -0.012 | 0.013 | 0.009 | -0.007 | 0.010 |
| (-1.23) | (0.87) | (0.47) | (-0.52) | (0.27) | |
| TAMP | 0.008 | -0.044 | 0.076 | -0.145*** | 1.863*** |
| (0.23) | (-0.66) | (1.34) | (-2.82) | (3.48) | |
| CFU | 0.209*** | 0.704*** | 0.006*** | 0.203*** | -0.145 |
| (4.47) | (6.46) | (3.96) | (3.55) | (-0.27) | |
| RRI | 0.107 | 0.075 | -0.229 | 0.262 | 0.081 |
| (1.48) | (1.04) | (-1.63) | (1.17) | (0.48) | |
| PGDP | -0.053 | 0.069 | 0.409 | -0.191 | 0.069 |
| (-0.58) | (0.61) | (1.18) | (-0.75) | (0.61) | |
| ρ | 0.351*** | 0.019 | 0.057 | 0.081 | 0.019 |
| (6.73) | (0.23) | (0.54) | (0.87) | (0.23) | |
| 收敛速度 | 0.051 | 0.054 | 0.080 | 0.052 | 0.191 |
| [1] |
普蓂喆, 周琳, 钟钰, 等. 我国粮食产销平衡区和主销区粮食自给底线设定研究[J]. 农业经济问题, 2022, (7): 113-123.
[
|
| [2] |
姚成胜, 杨一单, 殷伟. 三大区域粮食安全责任共担的角色定位与推进路径: 基于中国省域口粮自给率差异视角[J]. 经济学家, 2023, (6): 100-109.
[
|
| [3] |
朱晶, 臧星月, 李天祥. 新发展格局下中国粮食安全风险及其防范[J]. 中国农村经济, 2021, (9): 2-21.
[
|
| [4] |
成升魁, 李云云, 刘晓洁, 等. 关于新时代我国粮食安全观的思考[J]. 自然资源学报, 2018, 33(6): 911-926.
[
|
| [5] |
辛翔飞, 王济民. 我国粮食自给水平目标设定: 研究综述与政策启示[J]. 自然资源学报, 2019, 34(11): 2257-2269.
[
|
| [6] |
|
| [7] |
|
| [8] |
黄季焜. 对近期与中长期中国粮食安全的再认识[J]. 农业经济问题, 2021, (1): 19-26.
[
|
| [9] |
刘长全, 韩磊, 李婷婷, 等. 大食物观下中国饲料粮供给安全问题研究[J]. 中国农村经济, 2023, (1): 33-57.
[
|
| [10] |
朱晶, 李天祥, 臧星月. 高水平开放下我国粮食安全的非传统挑战及政策转型[J]. 农业经济问题, 2021, (1): 27-40.
[
|
| [11] |
杨明智, 裴源生, 李旭东. 中国粮食自给率研究: 粮食、谷物和口粮自给率分析[J]. 自然资源学报, 2019, 34(4): 881-889.
[
|
| [12] |
|
| [13] |
吕亚荣, 王立娇. 消费前端粮食损失数量和环境足迹的评估[J]. 农业现代化研究, 2022, 43(1): 29-37.
[
|
| [14] |
陈锡文, 韩俊. 农业转型发展与乡村振兴[M]. 北京: 清华大学出版社, 2019.
[
|
| [15] |
金涛, 夏晴, 岳蒙蒙, 等. 粮饲兼顾视角下江苏省粮食产需格局及其优化策略[J]. 经济地理, 2016, 36(6): 136-141.
[
|
| [16] |
陈明华, 刘文斐, 王山, 等. 长江经济带城市生态效率的空间格局及演进趋势[J]. 资源科学, 2020, 42(6): 1087-1098.
[
|
| [17] |
余威震, 罗小锋, 薛龙飞, 等. 中国农村绿色发展水平的时空差异及驱动因素分析[J]. 中国农业大学学报, 2018, 23(9): 186-195.
[
|
| [18] |
刘华军, 乔列成, 孙淑惠. 黄河流域用水效率的空间格局及动态演进[J]. 资源科学, 2020, 42(1): 57-68.
[
|
| [19] |
卢照地, 张正峰. 京津冀国土空间格局演变及其驱动因素的区域差异性研究[J]. 中国土地科学, 2022, 36(10): 42-52.
[
|
| [20] |
|
| [21] |
|
| [22] |
李隆玲, 武拉平. 乡村人口变迁对我国粮食安全的影响[J]. 中国农业大学学报(社会科学版), 2020, 37(1): 80-91.
[
|
| [23] |
刘蒙罢, 张安录, 文高辉. 长江中下游粮食主产区耕地利用生态效率区域差异与空间收敛[J]. 自然资源学报, 2022, 37(2): 477-493.
[
|
| [24] |
杨旭, 屈志光, 邓远建. 中国省域林业生产技术效率的空间收敛性及分异特征[J]. 资源科学, 2021, 43(10): 1947-1960.
[
|
| [25] |
|
| [26] |
|
| [27] |
封志明, 孙通, 杨艳昭. 2003-2013年中国粮食增产格局及其贡献因素研究[J]. 自然资源学报, 2016, 31(6): 895-907.
[
|
| [28] |
卢新海, 柯楠, 匡兵. 中国粮食生产能力的区域差异和影响因素[J]. 中国土地科学, 2020, 34(8): 53-62.
[
|
| [29] |
姚成胜, 杨一单, 殷伟. 中国非主粮生产的地理集聚特征及其空间演化机制[J]. 经济地理, 2020, 40(12): 155-165.
[
|
| [30] |
金涛. 中国粮食生产时空变化及其耕地利用效应[J]. 自然资源学报, 2014, 29(6): 911-919.
[
|
| [31] |
姚成胜, 肖雅雯, 杨一单. 农业劳动力转移与农业机械化对中国粮食生产的关联影响分析[J]. 农业现代化研究, 2022, 43(2): 306-317.
[
|
| [32] |
邓宗兵, 封永刚, 张俊亮, 等. 中国粮食生产空间布局变迁的特征分析[J]. 经济地理, 2013, 33(5): 117-123.
[
|
| [33] |
赵颖文, 赵剑. 我国粮食种植业地理集聚态势研究: 测度分析、时空特征与发展对策[J]. 农村经济, 2020, (7): 86-93.
[
|
| [34] |
李旭辉, 何金玉, 严晗. 中国三大海洋经济圈海洋经济发展区域差异与分布动态及影响因素[J]. 自然资源学报, 2022, 37(4): 966-984.
[
|
| [35] |
邓远建, 杨旭, 马强文, 等. 中国生态福利绩效水平的地区差距及收敛性[J]. 中国人口·资源与环境, 2021, 31(4): 132-143.
[
|
| [36] |
|
| [37] |
刘钦普, 濮励杰. 中国粮食主产区化肥施用时空特征及生态经济合理性分析[J]. 农业工程学报, 2019, 35(23): 142-150.
[
|
/
| 〈 |
|
〉 |