
基于大规模用户数据的中国燃油私家车出行碳排放测算方法
|
陈晓红,女,湖南长沙人,中国工程院院士,教授,博士生导师,主要研究方向为资源能源环境管理、生态文明与绿色发展等。E-mail: c88877803@163.com |
收稿日期: 2023-09-22
修回日期: 2024-03-19
网络出版日期: 2024-05-29
基金资助
国家自然科学基金基础科学中心项目(72088101)
湖南省科技创新计划资助项目(2023RC3182)
Method for estimating carbon emissions from fuel-powered private cars in China based on large-scale user data
Received date: 2023-09-22
Revised date: 2024-03-19
Online published: 2024-05-29
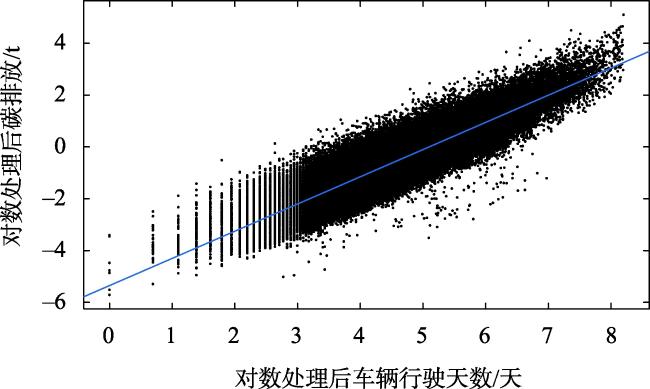
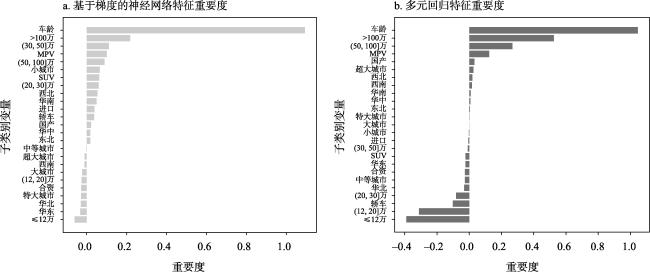
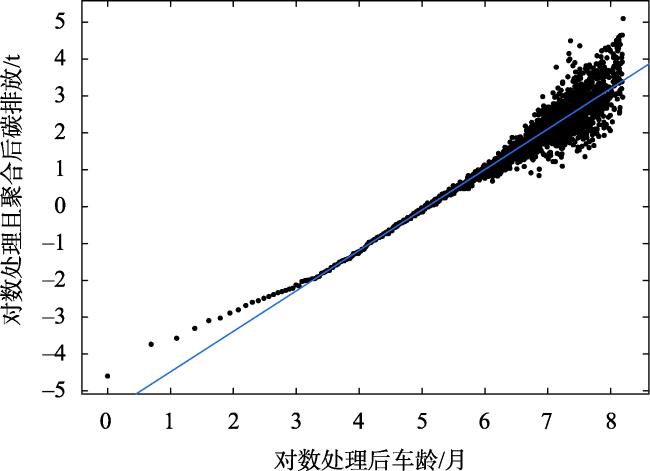
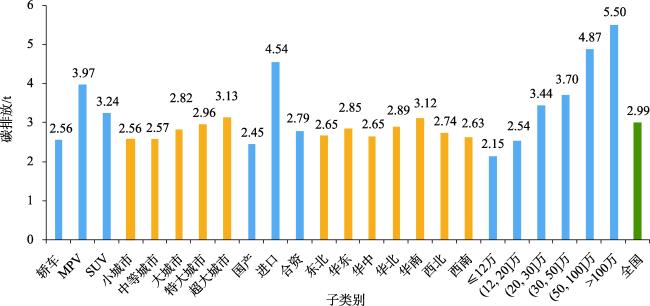
【目的】私家车行驶碳排放是中国居民日常出行碳排放的主要来源,现有测算方法局限于宏观层面研究,本文以车主大数据和机器学习方法为基础,旨在构建燃油私家车出行碳排放量测算方法,可为道路交通碳排放量核算提供科学依据,助力实现碳达峰、碳中和。【方法】本文以2014—2023年中国13万余燃油车主披露的多维度数据为基础,运用线性回归、决策树、神经网络等方法,提出车辆(单辆车)累积出行碳排放量、相同行驶天数车辆群的平均累积出行碳排放量计算模型及预测模型,构建车辆年均出行碳排放量计算模型。【结果】①在车辆累积出行碳排放量预测方面,相比仅基于车龄的预测模型,由车型、制造商、区域、城市级别、价格区间等5个类别以及车龄构建的包含25个变量的模型可将预测精度(R2)由0.666提高到0.821,其中车龄对车辆累积出行碳排放量预测的影响程度仍然最高;②在相同行驶天数车辆群的平均累积出行碳排放量预测方面,基于神经网络方法的预测结果显示,全国层面的车辆平均累积出行碳排放量的预测精度达到0.915,车型、制造商、区域、城市级别、价格区间等5个类别的车辆平均累积出行碳排放量的预测精度处于0.875~0.925之间;③在车辆年均出行碳排放量测算方面,全国层面的车辆年均出行碳排放量为2.99 t,进口制造商、价格区间在(50, 100]万、价格高于100万等3个类别下的车辆年均出行碳排放量高于4 t,MPV、SUV车型、华南区域、超大城市级别、价格区间在(20, 30]万、价格区间在(30, 50]万等6个类别下的车辆年均出行碳排放量处于3.00~3.99 t之间,其余15个子类别划分下车辆年均出行碳排放量均低于全国层面的平均水平,处于2.15~2.99 t之间。【结论】具有车龄、车型、制造商、区域、城市级别、价格区间等多维特征的大规模车主数据以及神经网络模型有助于提高私家车使用周期碳排放量测算的科学性、全面性,不同区域的道路交通碳排放量测算应考虑上述特征差异。本文可为新能源私家车出行碳排放量测算研究提供参考。
陈晓红 , 李洁月 , 杨艺 , 胡东滨 . 基于大规模用户数据的中国燃油私家车出行碳排放测算方法[J]. 资源科学, 2024 , 46(4) : 717 -727 . DOI: 10.18402/resci.2024.04.05
[Objective] The objective of this study was to develop a precise calculation method for fuel-powered private car travel carbon emissions, utilizing big data from car owners and employing machine learning techniques. This method aims to address the limitations of existing macro-level studies and provide a scientific basis for accurately estimating road transport carbon emissions. It will also contribute to achieving peak carbon dioxide emissions and promoting carbon neutrality in China. [Methods] Based on multidimensional data disclosed by over 130000 fuel vehicle owners in China from 2014 to 2023, this article utilizes methods such as linear regression, decision trees, and neural networks to propose a calculation model and prediction model for the average cumulative travel carbon emissions of vehicle groups with the same number of days traveled as well as individual vehicles. Subsequently, a calculation model for annual average travel carbon emissions of vehicles is constructed. [Results] (1) In terms of predicting the cumulative travel carbon emissions of vehicles, compared to the vehicle cumulative travel carbon emission prediction model based solely on vehicle age, the prediction accuracy (R2) of the model with 25 variables in five categories (vehicle type, manufacturer, region, city level, price range) and vehicle age increased from 0.666 to 0.821. Age was found to have the highest impact on predicting cumulative travel carbon emissions for vehicles. (2) In terms of predicting the average cumulative carbon emissions from vehicles in a group with the same number of days traveled, the results based on neural network methods show that the prediction accuracy for the average cumulative travel carbon emissions at a national level reaches 0.915. The prediction accuracy for average cumulative travel carbon emissions for vehicles in five categories including vehicle type, manufacturer, region, city level, and price range ranges from 0.875 to 0.925. (3) In terms of calculating the average annual carbon emissions from vehicle travel, the national level has an average of 2.99 t. Vehicles in three categories—imported manufacturers, prices between (500, 1000] thousand CNY, and prices over 1000 thousand CNY—have higher average annual carbon emissions exceeding 4 t. Vehicles in six categories—MPV and SUV models, South China region, super large cities, price range between (200, 300] thousand CNY and price range between (300, 500] thousand CNY—have average annual carbon emissions ranging from 3.00 to 3.99 t. The remaining fifteen subcategories have lower average annual carbon emissions than the national level's average level and fall within the range of 2.15 to 2.99 t. [Conclusion] The large-scale vehicle owner data of multiple dimensions such as vehicle age, vehicle type, manufacturer, region, city level, and price range, along with the neural network model, contribute to improving the scientific and comprehensive measurement of carbon emissions from private car usage cycles. The calculation of road traffic carbon emissions in different regions should take into account the aforementioned differences in features. This study provides a reference for calculating carbon emissions from new energy private car travel.
表1 因素类别及其符号Table 1 Factor categories and their symbols |
| 因素类别 | 子类别 | 符号 |
|---|---|---|
| 车型 | 轿车、MPV、SUV | |
| 制造商 | 国产、进口、合资 | |
| 区域 | 东北、华东、华中、华北、华南 西北、西南 | |
| 城市级别 | 小城市、中等城市、大城市、特 大城市、超大城市 | |
| 价格区间 | ≤12万、(12, 20]万、(20, 30]万、 (30, 50]万、(50, 100]万、>100万 |
表2 预测模型精度对比Table 2 Comparison of the accuracy of multiple prediction models |
| 模型f | RMSE | R2 | 时间/s | 备注 |
|---|---|---|---|---|
| 线性回归 | 0.507 | 0.816 | 8 | |
| 树模型 | 0.555 | 0.780 | 82 | 精细树 |
| 神经网络 | 0.501 | 0.821 | 595 | 三层网络 |
| SVM | 0.502 | 0.820 | 3689 | 三次SVM |
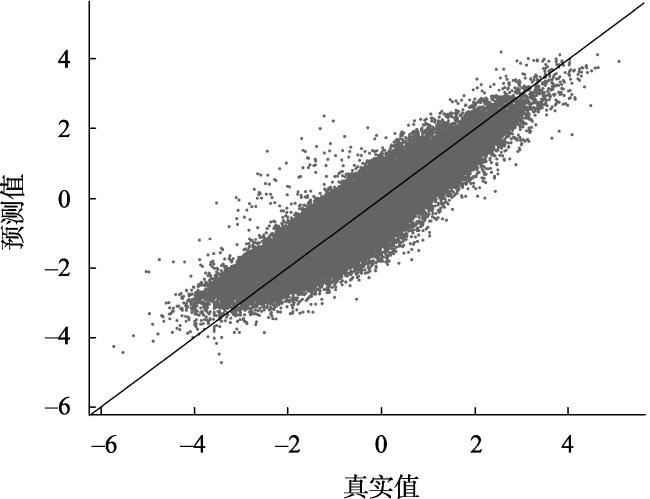
图2 累积碳排放量样本值与预测值(R2=0.821)Figure 2 Sample and predicted values of cumulative carbon emissions (R2=0.821) |
表3 平均累积碳排放量不同预测模型f精度对比Table 3 Comparison of the accuracy of different prediction models for average cumulative carbon emissions |
| 模型f | RMSE | R2 | 时间/s | 备注 |
|---|---|---|---|---|
| 树模型 | 0.378 | 0.901 | 5 | 粗略树 |
| 线性回归 | 0.362 | 0.909 | 4 | 线性回归 |
| SVM | 0.360 | 0.910 | 3 | 粗略高斯SVM |
| 神经网络 | 0.351 | 0.915 | 7 | 中型神经网络 |
表4 基于神经网络模型的24个子类别的拟合结果Table 4 Fitting results for 24 subcategories by neural network model |
| 类别 | 子类别 | 样本量 | 样本占比/% | R2 | 车辆年均碳排放量/t | 平均行驶里程/km | 平均油耗/(L/100 km) |
|---|---|---|---|---|---|---|---|
| 车型 | 轿车 | 61537 | 44.61 | 0.914 | 2.56 | 5928.28 | 7.52 |
| MPV | 10658 | 7.73 | 0.911 | 3.97 | 7106.17 | 9.36 | |
| SUV | 65735 | 47.66 | 0.922 | 3.24 | 5086.58 | 8.95 | |
| 制造商 | 国产 | 39710 | 28.79 | 0.903 | 2.45 | 4944.23 | 8.34 |
| 进口 | 6116 | 4.43 | 0.892 | 4.54 | 10033.49 | 10.25 | |
| 合资 | 92104 | 66.78 | 0.920 | 2.79 | 5615.52 | 8.22 | |
| 区域 | 东北 | 7570 | 5.49 | 0.875 | 2.66 | 6009.24 | 8.51 |
| 华东 | 50463 | 36.59 | 0.899 | 2.85 | 5387.49 | 8.37 | |
| 华中 | 19905 | 14.43 | 0.894 | 2.65 | 5355.96 | 8.27 | |
| 华北 | 19465 | 14.11 | 0.892 | 2.89 | 5820.29 | 8.33 | |
| 华南 | 15770 | 11.43 | 0.906 | 3.12 | 5982.18 | 8.38 | |
| 西北 | 8672 | 6.29 | 0.913 | 2.74 | 5663.42 | 8.07 | |
| 西南 | 16085 | 11.66 | 0.915 | 2.63 | 5856.34 | 8.40 | |
| 城市级别 | 小城市 | 9171 | 6.65 | 0.898 | 2.56 | 5643.80 | 8.12 |
| 中等城市 | 29101 | 21.10 | 0.907 | 2.57 | 5073.82 | 8.12 | |
| 大城市 | 48691 | 35.30 | 0.908 | 2.82 | 5501.24 | 8.29 | |
| 特大城市 | 26951 | 19.54 | 0.893 | 2.96 | 5787.92 | 8.46 | |
| 超大城市 | 24016 | 17.41 | 0.907 | 3.13 | 6314.50 | 8.68 | |
| 价格/万 | ≤12 | 46510 | 33.72 | 0.920 | 2.15 | 5289.89 | 7.35 |
| (12, 20] | 50134 | 36.35 | 0.925 | 2.54 | 5283.41 | 7.79 | |
| (20, 30] | 19350 | 14.03 | 0.920 | 3.44 | 6076.27 | 9.54 | |
| (30, 50] | 17595 | 12.76 | 0.914 | 3.70 | 5601.81 | 10.24 | |
| (50, 100] | 3541 | 2.57 | 0.900 | 4.87 | 8207.13 | 11.98 | |
| >100 | 800 | 0.58 | 0.903 | 5.50 | 23500.24 | 13.96 |
| [1] |
王世进, 蒯乐伊. 中国交通运输业碳排放驱动因素与达峰路径[J]. 资源科学, 2022, 44(12): 2415-2427.
[
|
| [2] |
International Energy Agency. Key World Energy Statistics[R/OL]. (2019-12-01) [2023-09-10]. https://www.iea.org/topics/transport.
|
| [3] |
中汽数据有限公司. 中国汽车低碳行动计划(2022)[R]. 天津: 中汽数据有限公司, 2022.
[ Automotive Data of China. China Automobile Low Carbon Action Plan Research Report (2022)[R]. Tianjin:Automotive Data of China, 2022.]
|
| [4] |
|
| [5] |
|
| [6] |
|
| [7] |
|
| [8] |
|
| [9] |
柴彦威, 肖作鹏, 刘志林. 居民家庭日常出行碳排放的发生机制与调控策略: 以北京市为例[J]. 地理研究, 2012, 31(2): 334-344.
[
|
| [10] |
Intergovernmental Panel on Climate Change. 2006 IPCC Guidelines for National Greenhouse Gas Inventories[M]. Japan: Institute for Global Environmental Strategies (IGES), 2006.
|
| [11] |
|
| [12] |
陈文婕, 吴小刚, 肖竹. 中国四大经济区域道路交通碳排放预测与减排潜力评估: 基于私家车轨迹数据的情景模拟[J]. 经济地理, 2022, 42(7): 44-52.
[
|
| [13] |
|
| [14] |
|
| [15] |
|
| [16] |
|
| [17] |
|
| [18] |
|
| [19] |
|
| [20] |
|
| [21] |
|
| [22] |
中华人民共和国国家发展和改革委员会. 关于调整城市规模划分标准的通知[EB/OL]. (2014-10-29) [2023-09-10]. https://www.ndrc.gov.cn/xwdt/ztzl/xxczhjs/ghzc/201605/t20160509_971910.html.
[ National Development and Reform Commission. Circular on the Adjustment of the Criteria for the Classification of the Size of Cities[EB/OL]. (2014-10-29) [2023-09-10]. https://www.ndrc.gov.cn/xwdt/ztzl/xxczhjs/ghzc/201605/t20160509_971910.html.]
|
| [23] |
中汽数据有限公司. 中国汽车低碳行动计划(2021)[R]. 天津: 中汽数据有限公司, 2021.
[ Automotive Data of China. China Automobile Low Carbon Action Plan Research Report (2021)[R]. Tianjin:Automotive Data of China, 2021.]
|
/
| 〈 |
|
〉 |