
基于递进动因分解的碳税减排机制研究
|
姚西龙,男,山东日照人,教授,博士生导师,研究方向为能源工程管理。E-mail: xilongyao@163.com |
收稿日期: 2023-03-17
修回日期: 2023-07-02
网络出版日期: 2023-09-12
基金资助
山西省高等学校哲学社会科学研究基地项目(RD2100003605)
Impact mechanism of carbon tax on carbon emission reduction based on progressive motivation decomposition
Received date: 2023-03-17
Revised date: 2023-07-02
Online published: 2023-09-12
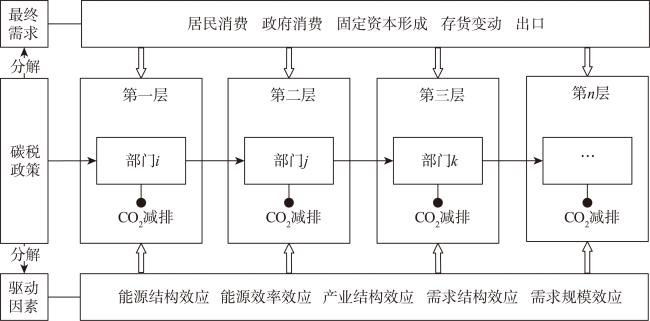
【目的】旨在厘清碳税的具体减排机制,助其充分发挥减排功能,推动碳减排政策体系建设。【方法】本文基于多层递进动因分解视角探究碳税的减排机制,建立可计算一般均衡模型(CGE)与结构路径分解(SPD)的耦合模型,识别碳税的关键减排路径,并对促进各路径减排的驱动因素进行分解分析。【结果】①碳税的减排作用以产业链引发的间接减排为主,占碳减排总量的80.77%,且碳税的减排效果随生产层级的增加而逐渐减弱;②能源效率效应是碳税促进减排的最主要动因,不同驱动因素在各生产层级、不同减排路径上的作用存在差异;③重工业、火电行业、煤炭行业等少数关键行业提供了主要碳减排贡献,固定资本形成的减排贡献最大,且主要通过影响建筑业对上游高耗能行业的需求这一路径实现碳减排。【结论】因此,应当充分把握和利用各关键因素对不同生产层级和路径碳减排的驱动机制,充分挖掘产业链关键环节的减排潜力,采取针对性措施促进行业间协同减排。
姚西龙 , 刘娜 . 基于递进动因分解的碳税减排机制研究[J]. 资源科学, 2023 , 45(7) : 1285 -1296 . DOI: 10.18402/resci.2023.07.01
[Objective] Aiming to clarify the specific emission reduction mechanism of carbon tax, give full play to its emission reduction function, and promote the construction of carbon emission reduction policy system. [Methods] A coupled model of computable general equilibrium (CGE) and structural path decomposition (SPD) was developed to identify the key emission reduction paths of carbon taxes, and the drivers promoting emission reduction on each path were decomposed and analyzed. [Results] The results show that the indirect emission reduction triggered by the industrial chain accounts for 80.77% of the total emission reduction from the carbon tax, and the emission reduction effect of the carbon tax will gradually diminish with the increase of the production level. The energy efficiency effect is the most important driver of carbon tax for emission reduction, and the role of different drivers varies across production levels and on different emission reduction paths. The key industries such as heavy industry, thermal power industry and coal industry providing the main carbon reduction contribution. Fixed capital formation contributes the most to carbon reduction and mainly achieves carbon emission reduction through the path of influencing the construction industry’s demand for upstream energy-intensive industries. [Conclusion] Therefore, the driving force mechanism of each key factor on carbon emission reduction at different production levels and paths of carbon tax should be fully grasped and utilized, the emission reduction potential of key links in the industrial chain should also be fully explored, and targeted measures should be taken to promote synergistic emission reduction among industries.
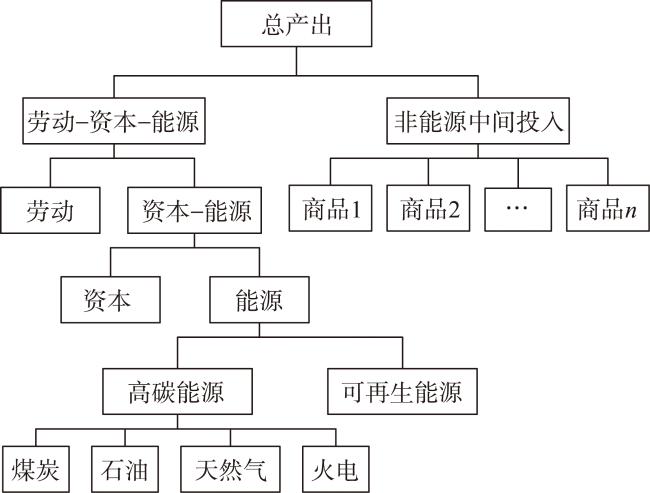
表1 CGE模型行业划分Table 1 Industry division of the computable general equilibrium (CGE) model |
| 序号 | 行业名称 | 2020 I/O表编号 | 序号 | 行业名称 | 2020 I/O表编号 |
|---|---|---|---|---|---|
| S1 | 农业 | 1-5 | S7 | 煤炭行业 | 6,42 |
| S2 | 重工业 | 8-11,43-99 | S8 | 石油行业 | 7,41 |
| S3 | 轻工业 | 12-40,102 | S9 | 天然气行业 | 7,101 |
| S4 | 建筑业 | 103-108 | S10 | 火电行业 | 100 |
| S5 | 交通运输业 | 111-122 | S11 | 低碳能源业 | 100 |
| S6 | 服务业 | 109-110,123-153 |
注:火电行业和低碳能源行业根据火电占电力生产量的比例拆分,本文假设仅有火电行业使用化石能源商品作为中间投入,原“电力、热力的生产和供应业”活动列与煤炭、石油和天然气3类化石能源商品行的交叉项全部划归火电行业,低碳能源行业活动列与化石能源商品行的交叉项为0。 |
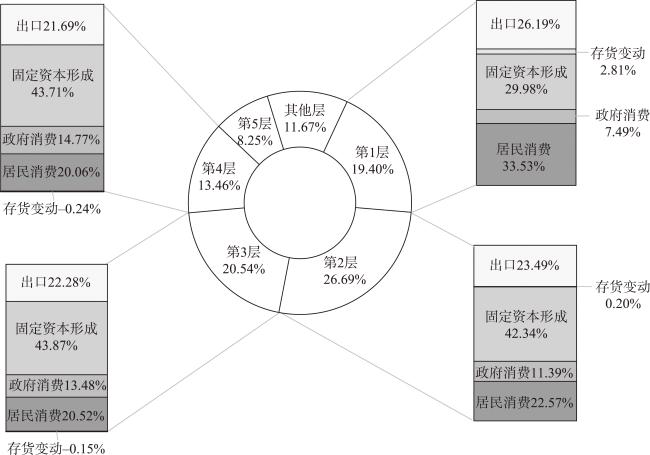
表2 碳税情景下的碳减排量结构分解 (%)Table 2 Structural decomposition of carbon emission reduction under the carbon tax scenario (%) |
| f(ΔS) | f(ΔT) | f(ΔL) | f(ΔU) | f(ΔH) | 合计 | |
|---|---|---|---|---|---|---|
| 居民消费 | 3.94 | 19.02 | 3.83 | 2.35 | -5.70 | 23.44 |
| 政府消费 | 1.11 | 5.33 | 0.93 | 0.08 | 5.01 | 12.47 |
| 固定资本形成 | 7.09 | 30.39 | 6.55 | 0.71 | -4.21 | 40.52 |
| 存货变动 | -0.04 | -0.13 | 0.01 | -1.93 | 2.57 | 0.48 |
| 出口 | 3.83 | 15.82 | 3.63 | -2.02 | 1.83 | 23.08 |
| 合计 | 15.93 | 70.43 | 14.94 | -0.81 | -0.49 | 100.00 |
表3 碳税情景下不同行业碳减排贡献分布情况Table 3 Carbon emission reduction contribution distribution of different industries under the carbon tax scenario |
| 序号 | 行业 | 影响值/万t | 贡献率/% | 减排贡献占比/% | |
|---|---|---|---|---|---|
| 直接减排 | 间接减排 | ||||
| S1 | 农业 | -71.65 | 0.38 | 32.19 | 67.81 |
| S2 | 重工业 | -8828.28 | 46.33 | 26.76 | 73.24 |
| S3 | 轻工业 | -507.10 | 2.66 | 41.61 | 58.39 |
| S4 | 建筑业 | -406.92 | 2.14 | 94.97 | 5.03 |
| S5 | 交通运输 | -651.11 | 3.42 | 30.82 | 69.18 |
| S6 | 服务业 | -608.61 | 3.19 | 52.19 | 47.81 |
| S7 | 煤炭行业 | -3025.50 | 15.88 | -16.49 | 116.49 |
| S8 | 石油行业 | -418.49 | 2.20 | -53.68 | 153.68 |
| S9 | 天然气行业 | -314.02 | 1.65 | 12.44 | 87.56 |
| S10 | 火电行业 | -4223.72 | 22.17 | 20.84 | 79.16 |
| S11 | 低碳能源行业 | 0.00 | 0.00 | — | — |
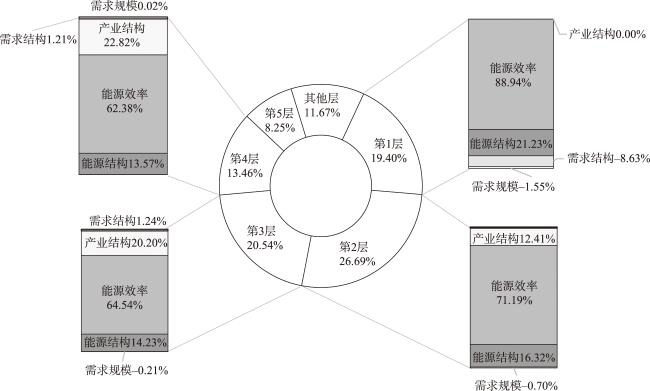
表4 碳税情景下前20条减排路径及驱动因素分解Table 4 Top 20 emission reduction paths and the decomposition of driving factors |
| 排序 | 路径 | 影响值/万t | 贡献率/% | 各因素减排贡献占比/% | ||||
|---|---|---|---|---|---|---|---|---|
| f(ΔS) | f(ΔT) | f(ΔL) | f(ΔU) | f(ΔH) | ||||
| 1 | EX→S2 | -1326.97 | 6.96 | 19.36 | 66.74 | 13.19 | 10.41 | -9.71 |
| 2 | FC→S4→S2 | -1095.56 | 5.75 | 22.90 | 78.93 | -1.59 | 8.31 | -8.54 |
| 3 | HD→S10 | -860.88 | 4.52 | 6.35 | 60.58 | -1.09 | 45.91 | -11.76 |
| 4 | FC→S2 | -677.56 | 3.56 | 26.96 | 92.91 | -21.26 | 20.40 | -19.01 |
| 5 | EX→S2→S2 | -617.80 | 3.24 | 19.45 | 67.04 | -0.45 | 7.93 | 6.03 |
| 6 | FC→S4→S2→S2 | -509.64 | 2.67 | 23.02 | 79.35 | -2.14 | 8.35 | -8.59 |
| 7 | FC→S4 | -391.89 | 2.06 | 17.54 | 82.79 | -0.39 | -2.10 | 2.18 |
| 8 | HD→S2 | -344.64 | 1.81 | 24.95 | 86.01 | -13.69 | 40.10 | -37.38 |
| 9 | FC→S2→S2 | -314.89 | 1.65 | 27.13 | 93.50 | -0.63 | -9.88 | -10.12 |
| 10 | EX→S2→S2→S2 | -287.62 | 1.51 | 19.54 | 67.35 | -0.91 | 7.97 | 6.06 |
| 11 | EX→S2→S7 | -253.77 | 1.33 | 0.67 | 10.39 | 77.66 | 6.41 | 4.87 |
| 12 | FC→S4→S2→S2→S2 | -237.63 | 1.25 | 24.31 | 83.80 | -2.82 | -2.61 | -2.68 |
| 13 | FC→S4→S2→S7 | -216.70 | 1.14 | 0.76 | 11.88 | 87.54 | 6.53 | -6.71 |
| 14 | FC→S4→S10 | -211.26 | 1.11 | 11.43 | 109.02 | -20.17 | 9.93 | -10.21 |
| 15 | GD→S6 | -209.16 | 1.10 | 8.73 | 50.63 | 32.28 | -18.93 | 27.28 |
| 16 | GD→S6→S2 | -200.09 | 1.05 | 15.22 | 52.46 | -2.96 | -0.47 | 35.75 |
| 17 | EX→S2→S10 | -191.07 | 1.00 | 9.36 | 89.23 | -14.67 | 9.13 | 6.94 |
| 18 | HD→S10→S7 | -171.65 | 0.90 | 0.57 | 8.93 | 61.09 | 39.93 | -10.53 |
| 19 | HD→S2→S2 | -160.24 | 0.84 | 25.10 | 86.51 | -0.58 | 8.50 | -19.53 |
| 20 | HD→S10→S10 | -158.32 | 0.83 | 6.74 | 64.25 | -6.05 | 47.62 | -12.47 |
| 合计 | -8437.34 | 44.28 | 17.54 | 70.37 | 4.78 | 13.70 | -6.53 | |
| [1] |
周迪, 罗东权. 绿色税收视角下产业结构变迁对中国碳排放的影响[J]. 资源科学, 2021, 43(4): 693-709.
[
|
| [2] |
刘磊, 张永强, 周千惠. 政策协同视角下对我国征收碳税的政策建议[J]. 税务研究, 2022, (3): 121-126.
[
|
| [3] |
宋国君, 王语苓, 姜艺婧. 基于“双碳”目标的碳排放控制政策设计[J]. 中国人口·资源与环境, 2021, 31(9): 55-63.
[
|
| [4] |
叶金育, 蒙思颖. “双碳”视阈下碳税并入环境保护税的制度证成与立法安排: 以《环境保护税法》修改为依归[J]. 南京工业大学学报(社会科学版), 2023, 22(2): 23-39.
[
|
| [5] |
|
| [6] |
|
| [7] |
李桃. 我国碳税政策设计与实施的国际经验借鉴[J]. 税务研究, 2022, (5): 86-90.
[
|
| [8] |
|
| [9] |
|
| [10] |
|
| [11] |
|
| [12] |
|
| [13] |
|
| [14] |
翁智雄, 吴玉锋, 李伯含, 等. 征收差异化行业碳税对中国经济与环境的影响[J]. 中国人口·资源与环境, 2021, 31(3): 75-86.
[
|
| [15] |
|
| [16] |
|
| [17] |
潘欣欣, 周志波. “环境税双重红利”假说CGE实证研究评述[J]. 税务研究, 2021, (4): 134-139.
[
|
| [18] |
|
| [19] |
|
| [20] |
|
| [21] |
刘海英, 钟莹. 碳交易与“碳税”的减排效应及作用路径研究[J]. 商业研究, 2023, (1): 98-107.
[
|
| [22] |
|
| [23] |
|
| [24] |
|
| [25] |
李虹, 王帅. 需求侧视角下中国隐含能源消费量及强度的影响因素[J]. 资源科学, 2021, 43(9): 1728-1742.
[
|
| [26] |
顾阿伦, 吕志强. 经济结构变动对中国碳排放影响: 基于IO-SDA方法的分析[J]. 中国人口·资源与环境, 2016, 26(3): 37-45.
[
|
| [27] |
尹伟华. 中国出口贸易隐含碳排放强度变动及驱动因素研究: 基于CMRIO-SDA模型[J]. 经济问题探索, 2019, (12): 123-134.
[
|
| [28] |
|
| [29] |
|
| [30] |
张炎治, 冯颖, 张磊. 中国碳排放增长的多层递进动因: 基于SDA和SPD的实证研究[J]. 资源科学, 2021, 43(6): 1153-1165.
[
|
| [31] |
|
| [32] |
杨莉莎, 朱俊鹏, 贾智杰. 中国碳减排实现的影响因素和当前挑战: 基于技术进步的视角[J]. 经济研究, 2019, 54(11): 118-132.
[
|
| [33] |
陈晓红, 张嘉敏, 唐湘博. 中国工业减污降碳协同效应及其影响机制[J]. 资源科学, 2022, 44(12): 2387-2398.
[
|
| [34] |
姜钰卿, 唐旭, 任凯鹏, 等. 基于双层嵌套SDA的中国减污降碳驱动因素研究[J]. 系统工程理论与实践, 2022, 42(12): 3294-3304.
[
|
| [35] |
张聪, 汪鹏, 赵黛青, 等. 基于结构分解的碳排放驱动因素及行业影响分析: 以广东为例[J]. 科技管理研究, 2022, 42(16): 204-217.
[
|
| [36] |
|
| [37] |
|
| [38] |
许士春, 张文文. 不同返还情景下碳税对中国经济影响及减排效果: 基于动态CGE的模拟分析[J]. 中国人口·资源与环境, 2016, 26(12): 46-54.
[
|
| [39] |
|
| [40] |
杨中文, 许新宜, 王红瑞, 等. 用水变化动态结构分解分析模型研究I: 建模[J]. 水利学报, 2015, 46(6): 658-667.
[
|
/
| 〈 |
|
〉 |