
波动分解视角下中国能源业系统性风险溢出
|
赵树然,女,湖南邵阳人,博士,教授,研究方向为系统性风险管理。E-mail: zhshuran@163.com |
收稿日期: 2022-09-05
修回日期: 2023-02-15
网络出版日期: 2023-05-25
基金资助
国家自然科学基金项目(72271224)
教育部人文社会科学规划基金项目(18YJA79013)
国家社会科学基金项目(19BTJ042)
Systemic risk spillover of China’s energy industry based on the perspective of volatility decomposition
Received date: 2022-09-05
Revised date: 2023-02-15
Online published: 2023-05-25
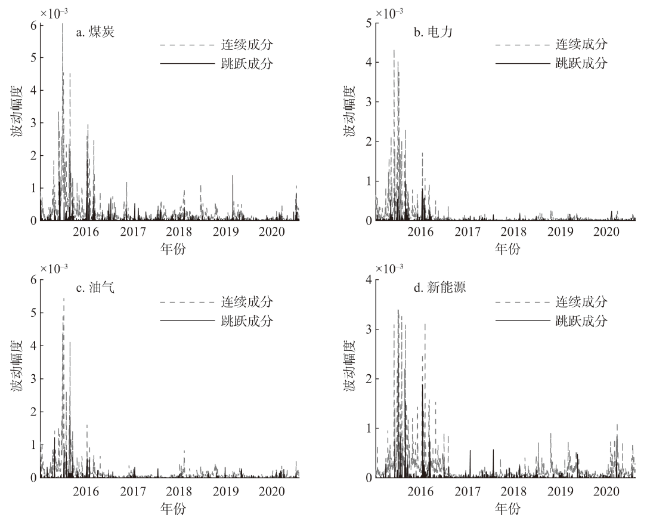
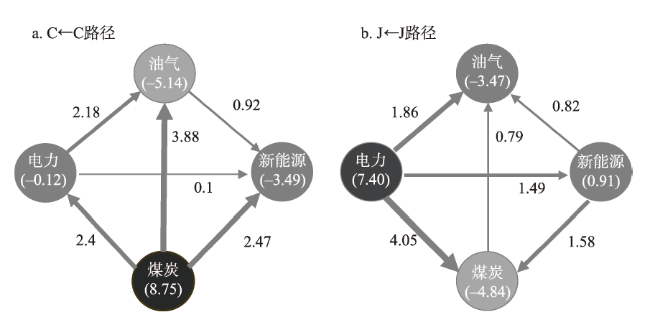
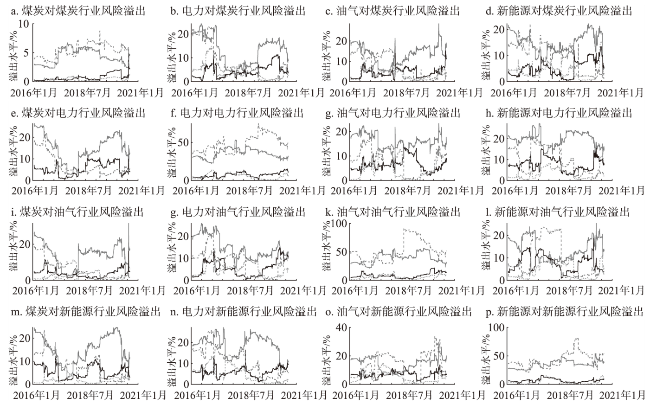
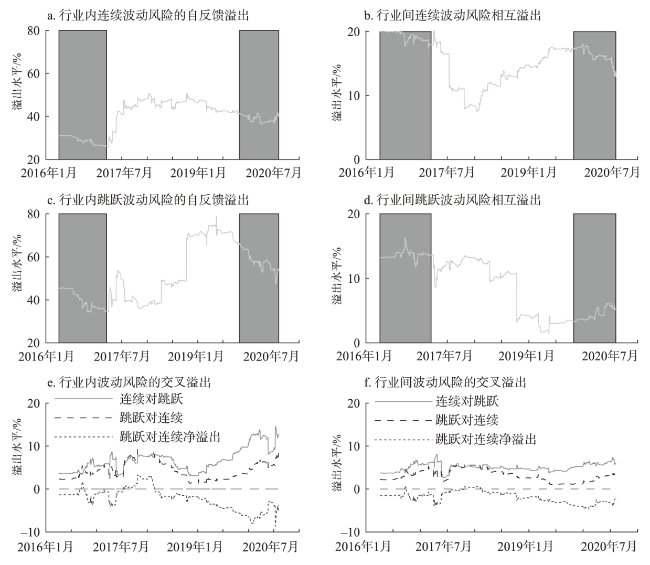
【目的】能源行业与国家安全和经济发展息息相关,其系统性风险不容忽视。本文旨在研究常态和极端情形下能源行业间系统性风险溢出方向及特点,为能源行业系统性风险管理提供新的思路与方法。【方法】本文基于波动分解视角,将能源行业的波动风险分解为连续性和跳跃性成分,并通过向量自回归模型的广义误差方差分解思想,构建系统分析下各能源子行业及各波动成分间的溢出矩阵及溢出指标,并据此从静态和动态两个角度,研究了中国能源行业系统性波动风险溢出效应。【结果】实证结果表明:①能源行业有明显的跳跃性波动,行业内极端跳跃风险的积累会导致行业间系统性风险增加。②能源行业之间的系统风险溢出具有显著的时变性,在股市动荡期风险易向行业外扩散,系统性风险水平相对较高,但在稳定期则易转向行业内传染,系统性风险水平相对较低。③能源行业波动风险易在同种风险类型中传导,交叉风险传染有限,其中,能源系统性波动风险在行业间的溢出主要通过连续对连续路径实现,而行业内主要为跳跃对跳跃路径。④煤炭行业是连续性风险的最大发出者,电力行业是跳跃性波动风险的唯一发出者,新能源行业是以跳跃性波动形式接收外部风险的最大接收者。【结论】应密切关注能源行业系统性风险,并根据其传染特点进行灵活动态监管,稳定时期需重点关注行业内同类型风险间的溢出,在波动较大时期,应重点关注风险在跨行业和跨成分间的传染,坚决守住不发生系统性风险的底线。
赵树然 , 张洁 , 李金宸 , 任培民 . 波动分解视角下中国能源业系统性风险溢出[J]. 资源科学, 2023 , 45(3) : 637 -651 . DOI: 10.18402/resci.2023.03.13
[Objective] The energy industry is closely related to national security and economic development, and its systemic risks cannot be ignored. This study explored the industry-level volatility interconnections and examined the direction and characteristics of systemic risk spillover from the normal and extreme energy market states. It provides a new perspective and technical support for systemic risk management in the energy industry. [Methods] Based on the volatility decomposition approach, we decomposed the volatility risk of each energy industry into continuity and jump components, and then constructed the connection matrix and spillover indicators between these components through the generalized variance decomposition method of the vector autoregressive model. Subsequently, the systemic risk spillover effects in China’s energy industries were analyzed from static and dynamic perspectives. [Results] The empirical results suggest that: (1) There are obvious jump fluctuations in the energy industry, and the accumulation of jump risk in the energy industry will lead to an increasing systemic risk; (2) The systemic risk spillover in the energy industry is significantly time variant. The risk tends to spread outside the industry during fluctuation periods and shifts to the intra-industry contagion during the stable periods; (3) Either within or between industries, volatility risks tend to be transferred within the same type of volatility components, and the net spillover direction between two components is along the continuity-to-jump path; (4) The coal industry is the largest sender of the continuity risk, the electricity industry is the only sender of the jump risk, and the new energy industry is the largest receiver of external risk in the form of volatility jumps. [Conclusion] The government should pay more attention to both cross-industry and cross-component spillovers during turbulent periods while paying attention to the self-feedback spillover within industries during stable periods, so as to prevent local risk from accumulating and spreading to the whole energy system.
表1 95%置信水平下跳跃性波动情况描述统计Table 1 Descriptive statistics of fluctuating jumps at 95% confidence level for four energy sectors |
| 煤炭 | 电力 | 油气 | 新能源 | |
|---|---|---|---|---|
| 跳跃天数 | 3851 | 3222 | 2704 | 3083 |
| 跳跃频率 | 0.28331 | 0.23692 | 0.19874 | 0.22663 |
| 单跳次数 | 1911 | 1882 | 1674 | 1733 |
| 2个连续跳跃次数 | 611 | 462 | 294 | 423 |
| 3个及以上跳跃次数 | 241 | 144 | 153 | 172 |
| 连续幅度(10-4) | 2.40361 | 1.24284 | 1.55753 | 2.04692 |
| 跳跃幅度(10-4) | 1.0431 | 0.5464 | 0.6993 | 0.8482 |
| 总波动(10-4) | 3.44661 | 1.78884 | 2.25653 | 2.89492 |
| 跳跃幅度比 | 0.32931 | 0.29643 | 0.24434 | 0.30842 |
注:表中各数据右上角数字为各指标在4个行业中的排名。下同。 |
表2 能源行业系统性波动风险的溢出矩阵( ) (%)Table 2 Spillover matrix of volatility risks in the energy system (%) |
| 煤炭 | 电力 | 油气 | 新能源 | |||||||||
|---|---|---|---|---|---|---|---|---|---|---|---|---|
| 连续 | 跳跃 | 连续 | 跳跃 | 连续 | 跳跃 | 连续 | 跳跃 | |||||
| 煤炭 | 连续 | 30.52 | 0.74 | 21.12 | 5.13 | 19.30 | 0.92 | 19.10 | 3.15 | |||
| 跳跃 | 2.57 | 51.05 | 1.93 | 15.87 | 1.65 | 11.93 | 2.76 | 12.25 | ||||
| 电力 | 连续 | 23.52 | 0.19 | 33.11 | 2.93 | 19.39 | 0.33 | 19.63 | 0.92 | |||
| 跳跃 | 5.93 | 11.82 | 5.56 | 41.08 | 5.36 | 8.21 | 7.43 | 14.61 | ||||
| 油气 | 连续 | 23.18 | 0.51 | 21.57 | 2.68 | 32.34 | 1.59 | 16.91 | 1.21 | |||
| 跳跃 | 3.77 | 12.72 | 2.12 | 10.07 | 6.41 | 54.06 | 4.74 | 6.10 | ||||
| 新能源 | 连续 | 21.57 | 0.52 | 19.73 | 6.36 | 17.83 | 1.58 | 29.96 | 2.45 | |||
| 跳跃 | 7.68 | 10.67 | 5.46 | 16.10 | 6.42 | 5.28 | 5.19 | 43.20 | ||||
表3 系统层面下两类波动风险的相互溢出( , , , )Table 3 Cross-component spillovers at the system level |
| 连续 | 跳跃 | |
|---|---|---|
| 连续 | 92.20 | 7.80 |
| 跳跃 | 18.75 | 81.26 |
| 净溢出 | 10.95 | -10.95 |
注:净输出是扣除风险流入后的风险溢出,旨在反映该波动成分是风险发送者还是接收方。其计算为列的总和与所在的行之间的差额。下文的净溢出计算方法相同。 |
表4 总波动率的跨行业溢出效应( )Table 4 Cross-industry spillovers of total volatility |
| 煤炭 | 电力 | 油气 | 新能源 | |
|---|---|---|---|---|
| 煤炭 | 42.44 | 22.03 | 16.90 | 18.63 |
| 电力 | 20.73 | 41.34 | 16.65 | 21.30 |
| 油气 | 20.09 | 18.22 | 47.20 | 14.49 |
| 新能源 | 20.22 | 23.83 | 15.56 | 40.40 |
| 净溢出 | 3.48 | 5.40 | -3.69 | -5.19 |
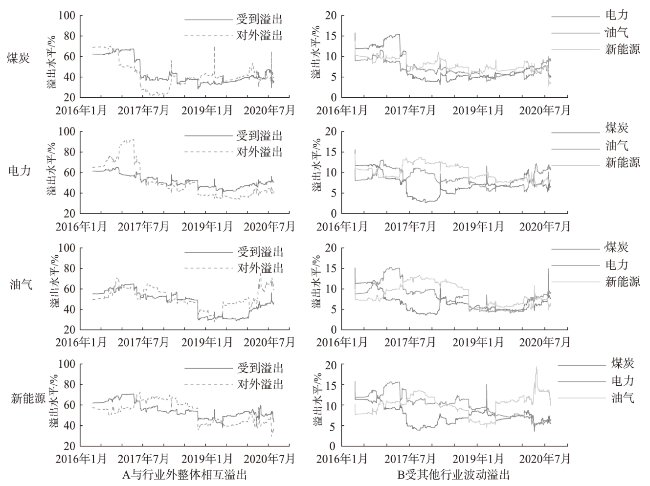
表5 各能源子行业两类波动风险对内对外溢出情况Table 5 Spillovers from and to outside industries |
| 连续 | 跳跃 | ||||||||
|---|---|---|---|---|---|---|---|---|---|
| 煤炭 | 电力 | 油气 | 新能源 | 煤炭 | 电力 | 油气 | 新能源 | ||
| A:对其他能源行业溢出 | |||||||||
| 连续 | 68.271 | 62.422 | 56.524 | 55.643 | 1.224 | 14.171 | 2.833 | 5.282 | |
| 跳跃 | 17.381 | 9.514 | 13.433 | 14.932 | 35.212 | 42.041 | 25.424 | 32.963 | |
| 合计1 | 85.651 | 71.932 | 69.954 | 70.573 | 36.433 | 56.211 | 28.254 | 38.242 | |
| B:受到其他能源行业溢出 | |||||||||
| 连续 | 59.523 | 62.541 | 61.662 | 59.134 | 6.344 | 18.722 | 10.633 | 19.561 | |
| 跳跃 | 9.201 | 1.444 | 4.403 | 8.462 | 40.051 | 34.642 | 28.894 | 32.053 | |
| 合计2 | 68.721 | 63.984 | 66.063 | 67.592 | 46.393 | 53.361 | 39.524 | 51.612 | |
| C:与其他能源行业的净溢出 | |||||||||
| 连续 | 8.751 | -0.123 | -5.144 | -3.492 | -5.122 | -4.551 | -7.803 | -14.284 | |
| 跳跃 | 8.182 | 8.073 | 9.031 | 6.474 | -4.844 | 7.401 | -3.473 | 0.912 | |
| 合计3 | 16.931 | 7.952 | 3.893 | 2.984 | -9.962 | 2.851 | -11.273 | -13.374 | |
| [1] |
叶五一, 谭轲祺, 缪柏其. 基于动态因子Copula模型的行业间系统性风险分析[J]. 中国管理科学, 2018, 26(3): 1-12.
[
|
| [2] |
翟永会. 系统性风险管理视角下实体行业与银行业间风险溢出效应研究[J]. 国际金融研究, 2019, (12): 74-84.
[
|
| [3] |
严良, 熊伟伟, 王小林, 等. 供需错配下能源替代路径优化[J]. 资源科学, 2019, 41(9): 1655-1664.
[
|
| [4] |
|
| [5] |
赵文琦, 胡健, 赵守国. 中国能源产业的要素配置效率与产业高级化[J]. 数量经济技术经济研究, 2020, 37(12): 146-162.
[
|
| [6] |
汪鹏, 王翘楚, 韩茹茹, 等. 全球关键金属-低碳能源关联研究综述及其启示[J]. 资源科学, 2021, 43(4): 669-681.
[
|
| [7] |
|
| [8] |
龚旭, 姬强, 林伯强. 能源金融研究回顾与前沿方向探索[J]. 系统工程理论与实践, 2021, 41(12): 3349-3365.
[
|
| [9] |
|
| [10] |
|
| [11] |
赵娜娜, 王志宝, 李鸿梅. 中国能耗模式演变及其对经济发展的影响[J]. 资源科学, 2021, 43(1): 122-133.
[
|
| [12] |
唐绍祥, 娄峰. 能源消费新模式对宏观经济的作用机制和影响分析[J]. 宏观经济研究, 2020, (10): 145-153.
[
|
| [13] |
|
| [14] |
|
| [15] |
|
| [16] |
|
| [17] |
|
| [18] |
|
| [19] |
刘超, 郭亚东. 多时间尺度下行业间系统性金融风险溢出及拓扑结构分析[J]. 中国管理科学, 2022, 30(10): 46-59.
[
|
| [20] |
|
| [21] |
|
| [22] |
|
| [23] |
|
| [24] |
|
| [25] |
|
| [26] |
|
| [27] |
|
| [28] |
龚旭, 林伯强. 跳跃风险、结构突变与原油期货价格波动预测[J]. 中国管理科学, 2018, 26(11): 11-21.
[
|
| [29] |
刘振华, 丁志华, 段钊平. 气候政策不确定性会加剧能源市场间极端风险溢出吗?[J]. 系统工程理论与实践, 2023, (1): 1-25.
[
|
| [30] |
|
| [31] |
|
| [32] |
|
| [33] |
杨宇, 何则. 中国海外油气依存的现状、地缘风险与应对策略[J]. 资源科学, 2020, 42(8): 1614-1629.
[
|
| [34] |
丁日佳, 高青. 去杠杆背景下我国煤炭行业杠杆率合理水平测算[J]. 统计与决策, 2020, 36(22): 148-152.
[
|
| [35] |
|
| [36] |
杨科, 陈浪南. 中国股市高频波动率跳跃的特征分析[J]. 系统工程学报, 2012, 27(4): 492-497.
[
|
| [37] |
|
| [38] |
|
| [39] |
|
/
| 〈 |
|
〉 |