
基于生态系统服务供需关系的农业生态管理分区
作者简介:管青春,女,山东青岛人,博士生,研究方向为土地利用规划和社会-生态系统。E-mail: qingchun68628@126.com
收稿日期: 2018-10-22
要求修回日期: 2019-04-17
网络出版日期: 2019-07-25
基金资助
国家科技支撑计划项目(2015BAB06B01)
Zoning of agroecological management based on the relationship between supply and demand of ecosystem services
Received date: 2018-10-22
Request revised date: 2019-04-17
Online published: 2019-07-25
Copyright
生态系统服务是人类赖以生存和发展的基础,厘清生态系统服务供给与需求的关系并对其分区管控有助于提升人类福祉。本文针对如何表征农业生态系统服务供需状态及其空间异质性问题,采用基于LUCC的生态系统服务矩阵,构建供需匹配度和供需协调度2个指标,并对2015年河北省曲周县村级行政单元农业生态系统服务状态和可持续能力进行评判;运用局部空间自相关分析,以局部空间集聚特征为依据,通过空间叠加产生的组合类型划分曲周县的农业生态管理区,并提出针对分区的管理措施。研究结果表明:①供需匹配度和供需协调度指标能实现区域内农业生态系统服务的整体评价,且具有可应用性和普适性。②2015年曲周县生态系统服务供需匹配度和协调度空间差异明显。区域供需匹配度为1.0647,处于一般均衡等级,表明2015年曲周县生态系统服务供需处于均衡状态;区域供需协调度为0.8977,处于良好协调状态,表明区域生态系统服务可持续能力较高。③将曲周县339个村级行政单元划分为4个一级生态管理区和12个二级生态管理亚区。提出的管理措施如下:生态保育区实施严格保护,禁止大规模建设;生态培育区实施综合保护,提升投产效益;生态改良区实施综合改良,促使生态环境转好;生态重构区实施整体生态整治和针对性生态重构。该研究结果可为区域的生态系统服务精细化管理、差异化保护提供思路。
管青春 , 郝晋珉 , 许月卿 , 任国平 , 康蕾 . 基于生态系统服务供需关系的农业生态管理分区[J]. 资源科学, 2019 , 41(7) : 1359 -1373 . DOI: 10.18402/resci.2019.07.16
Ecosystem services are the basis for human survival and development. Clarifying the relationship between supply and demand of ecosystem services and applying differentiated management and control can contribute to human well-being. This research aimed at characterizing the relationship between supply and demand of agroecosystem services and their spatial heterogeneity. It used ecosystem service matrix based on land use and cover change data to obtain ecosystem service capability in different spaces. Two indices—supply and demand matching degree and coordination degree—were formulated to evaluate the agroecosystem service status and sustainability of administrative village units in Quzhou County in 2015. Based on the characteristics of local spatial agglomeration, the agroecosystem management areas of Quzhou County were divided, and the management measures for the districts were put forward by using local spatial autocorrelation analysis. The results show that: (1) Supply and demand matching degree and coordination degree can realize the overall evaluation of natural resources in the region. (2) The spatial differences of the supply and demand matching degree and coordination degree of agroecosystem services in Quzhou County in 2015 were obvious. The matching degree of Quzhou County was 1.0647, which was at the general equilibrium level, indicating that the supply and demand of agroecosystem services was in an equilibrium state. The coordination degree of Quzhou County was 0.8977, which was in a state of good coordination, indicating that the sustainability of regional ecosystem services was high. (3) The 339 administrative village units in Quzhou County can be divided into four primary agroecological management areas and 12 secondary agroecological management subareas. Differential management measures are proposed for the ecological areas: Ecological conservation area shall be protected strictly and large-scale construction is prohibited. Ecological protection area shall be protected comprehensively to improve production efficiency. Ecological improvement area should implement comprehensive improvement measures in order to improve the ecosystem. Ecological reconstruction area should implement overall ecological rehabilitation and targeted ecological reconstruction. This study can provide some references for the fine management and differential protection of regional ecosystem services.
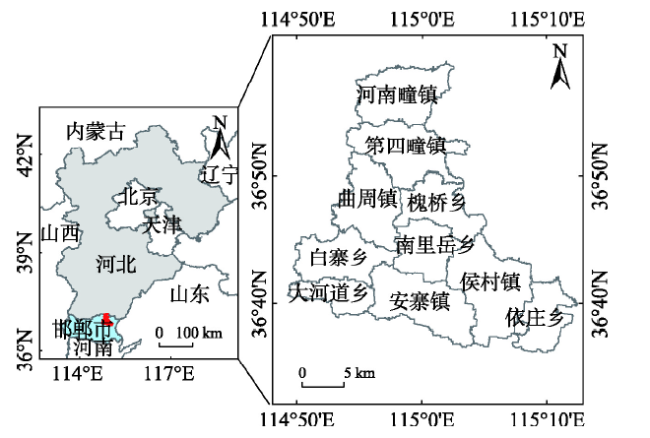
Figure 1 Location of Quzhou County in Hebei Province, China图1 中国河北省曲周县区位图 |
Table 1 Ecosystem service potential matrix for Quzhou County, 2015表1 2015年曲周县生态系统服务潜在供给 |
 |
Table 2 Ecosystem service flow matrix for Quzhou County, 2015表2 2015年曲周县生态系统服务实际供给 |
 |
Table 3 Ecosystem service demand matrix for Quzhou County, 2015表3 2015年曲周县生态系统服务需求 |
 |
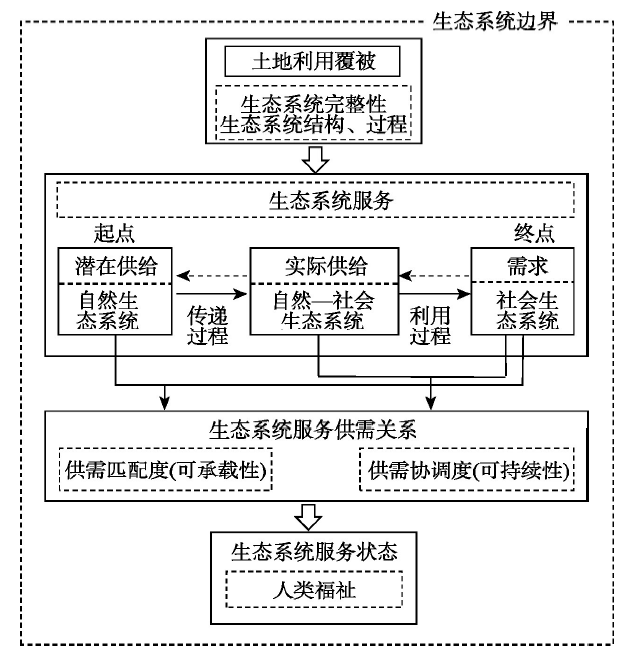
Figure 2 Analytical framework of supply and demand process of ecosystem services图2 生态系统服务分析框架 |
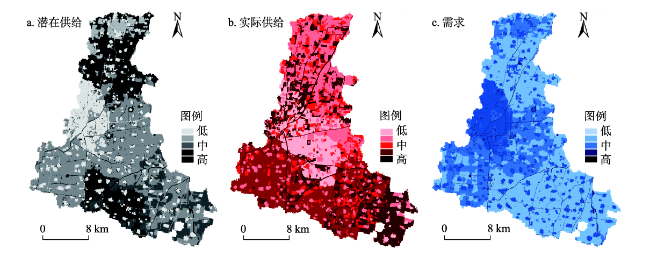
Figure 3 Spatial distribution of ecosystem service potential (a), flow (b), and demand (c) matrices for Quzhou County, 2015图3 2015年曲周县生态系统服务潜在供给(a)、实际供给(b)、需求(c)空间分布 |
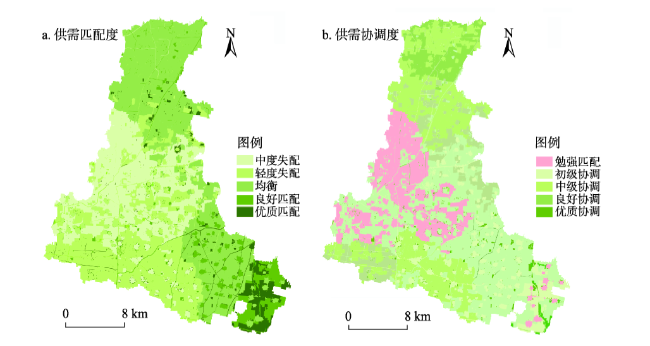
Figure 4 Spatial distribution of ecosystem service supply and demand matching degree (a) and coordination degree (b) of Quzhou County, 2015图4 2015年曲周县生态系统服务供需匹配度(a)、供需协调度(b)空间分布 |
Table 4 Statistics of local spatial autocorrelation types of ecosystem service supply and demand matching degree and coordination degree of Quzhou County, 2015表4 2015年曲周县生态系统服务供需匹配度和供需协调度局部空间自相关类型统计表 |
| 自相关类型 | 供需匹配度 | 供需协调度 | |||||
|---|---|---|---|---|---|---|---|
| 行政村个数 | 面积/hm2 | 面积占比/% | 行政村个数 | 面积/hm2 | 面积占比/% | ||
| HH型 | 87 | 13764.27 | 20.34 | 75 | 11865.75 | 17.54 | |
| HL型 | 21 | 3616.41 | 5.34 | 42 | 7232.82 | 10.69 | |
| LH型 | 32 | 6055.04 | 8.95 | 39 | 7379.58 | 10.91 | |
| LL型 | 98 | 15435.98 | 22.81 | 67 | 10553.17 | 15.60 | |
| NN型 | 101 | 28796.39 | 42.56 | 116 | 30636.77 | 45.28 | |
| 总计 | 339 | 67668.09 | 100.00 | 339 | 67668.09 | 100.00 | |
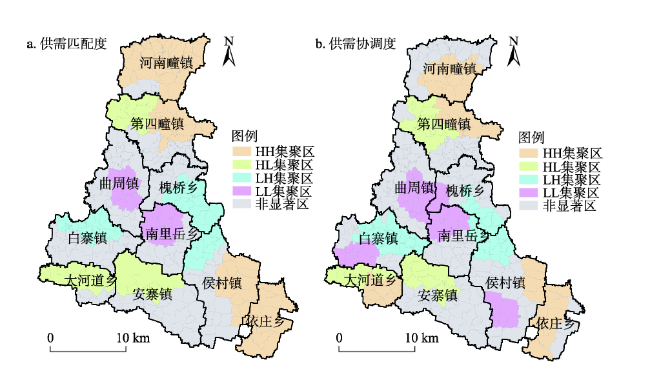
注:HH为高高型;HL为高低型;LH为低高型;LL为低低型;NN为非显著型。 |
Figure 5 Local spatial agglomeration of ecosystem service supply and demand matching degree (a) and coordination degree (b) of Quzhou County, 2015图5 2015年曲周县生态系统服务供需匹配度(a)、供需协调度(b)局部空间自相关分布 |
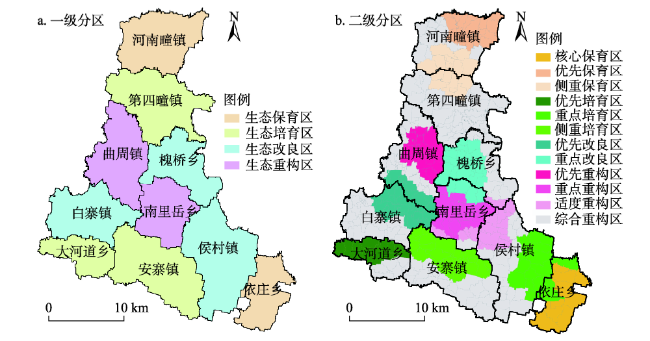
Figure 6 Ecological management zoning of Quzhou County, 2015图6 2015年曲周县生态系管理分区图 |
Table 5 Combination of local spatial autocorrelation types of ecosystem service supply and demand matching degree and coordination degree of Quzhou County, 2015表5 2015年曲周县生态系统服务供需匹配度和供需协调度局部空间自相关组合类型 |
| 序号 | 局部空间自相关类型 | 行政村个数 | 面积/hm2 | 面积占比/% | |
|---|---|---|---|---|---|
| 供需匹配度 | 供需协调度 | ||||
| 1 | HH型 | HH型 | 36 | 6667.56 | 9.85 |
| 2 | HH型 | NN型 | 13 | 2328.43 | 3.44 |
| 3 | NN型 | HH型 | 15 | 2869.80 | 4.24 |
| 4 | HL型 | HL型 | 39 | 6795.36 | 10.04 |
| 5 | HL型 | NN型 | 24 | 4058.64 | 6.00 |
| 6 | NN型 | HL型 | 19 | 3450.97 | 5.10 |
| 7 | LH型 | LH型 | 35 | 6168.40 | 9.12 |
| 8 | LH型 | NN型 | 4 | 581.68 | 0.86 |
| 9 | NN型 | LH型 | 3 | 597.48 | 0.88 |
| 10 | LL型 | LL型 | 44 | 6787.02 | 10.03 |
| 11 | LL型 | NN型 | 21 | 3731.47 | 5.51 |
| 12 | NN型 | LL型 | 19 | 3500.56 | 5.17 |
| 13 | NN型 | NN型 | 67 | 20130.72 | 29.75 |
Table 6 Zoning of ecological management based on local spatial autocorrelation in Quzhou County表6 基于局部空间自相关的曲周县生态管理分区 |
| 一级分区 | 二级分区 | 局部空间自相关类型 | 管理措施 | 典型区域 | |
|---|---|---|---|---|---|
| 供需匹配度 | 供需协调度 | ||||
| 生态 保育区 | 核心保育区 | HH型 | HH型 | 严格保护,禁止大规模开发 | 河南疃镇北部郑韩村、宁屯村等和依庄乡东南部的曹庄村、宋庄村等区域 |
| 优先保育区 | HH型 | NN型 | 保护和维持现有的自然生态环境 | 河南疃镇东部的马屯村、连珠村等和依庄乡南部的西路庄村、牛疃村等区域 | |
| 一般保育区 | NN型 | HH型 | 维持现有的供需水平条件 | 第四疃镇北部的巩村、焦庄村、李庄村等区域 | |
| 生态 培育区 | 优先培育区 | HL型 | HL型 | 综合保护生态系统服务高值地类,提高利用产出能力和管理水平 | 大河道乡北部的孔庄村、赵逯庄村、西河道村等区域 |
| 重点培育区 | HL型 | NN型 | 重点保护生态系统服务高值地类,提升投入产出效益 | 侯村镇东部的东王堡村、戚寨村、堤上村等区域 | |
| 适度培育区 | NN型 | HL型 | 重点保护生态系统服务高值地类,提高利用管理水平 | 安寨镇北部的后公城堡村、前公城堡村、南马店村、东屯村等区域 | |
| 生态 改良区 | 优先改良区 | LH型 | LH型 | 综合改善生态系统服务低值地类,利用水平和投入产出效益 | 白寨镇东北部的王村、东陈庄村、西陈庄村等区域 |
| 重点改良区 | LH型/NN型 | LH型/NN型 | 重点改良生态系统服务低值地类,增加投入,挖掘潜能 | 槐桥乡西部的小秦庄村、陈袁庄村、西漳头村、乔堡村等区域 | |
| 生态 重构区 | 优先重构区 | LL型 | LL型 | 生境斑块连通和修复 | 曲周镇中部的后河东村、陈庄村、袁庄村、北甫村、南甫村、前河东村等区域 |
| 重点重构区 | LL型 | NN型 | 生态修复和潜在节点重构 | 南里岳乡西北的史寨村、安上村、炒寨村、北里岳村、马兰村等区域 | |
| 适度重构区 | NN型 | LL型 | 生态廊道修复和生态网络重构 | 南里岳乡的东南部的杨军寨村、刘大寨村、封庄村等和侯村镇西北部的西高胡寨村、东高胡寨村等区域 | |
| 综合重构区 | NN型 | NN型 | 生态基质修复和生态退耕 | 非显著型区域 | |
| [1] |
Millennium Ecosystem Assessment (MA). Millennium Ecosystem Assessment: Living Beyond Our Means: Natural Assets and Human Well-Being[R]. Washington: World Resources Institute, 2005.
|
| [2] |
|
| [3] |
[
|
| [4] |
[
|
| [5] |
[
|
| [6] |
[
|
| [7] |
[
|
| [8] |
[
|
| [9] |
[
|
| [10] |
[
|
| [11] |
[
|
| [12] |
[
|
| [13] |
[
|
| [14] |
[
|
| [15] |
[
|
| [16] |
[
|
| [17] |
[
|
| [18] |
[
|
| [19] |
[
|
| [20] |
[
|
| [21] |
|
| [22] |
|
| [23] |
|
| [24] |
|
| [25] |
|
| [26] |
[
|
| [27] |
[
|
| [28] |
|
| [29] |
|
| [30] |
|
| [31] |
|
| [32] |
|
| [33] |
|
| [34] |
|
| [35] |
|
| [36] |
[
|
| [37] |
[
|
| [38] |
[
|
| [39] |
[
|
| [40] |
[
|
| [41] |
|
| [42] |
[
|
| [43] |
[
|
| [44] |
[
|
| [45] |
|
| [46] |
[
|
| [47] |
[
|
/
| 〈 |
|
〉 |