
基于投入产出模型的长江经济带贸易隐含水污染转移格局
|
何伟军,男,湖南邵阳人,教授,研究方向为资源环境管理与区域经济。E-mail: weijunhe@ctgu.edu.cn |
收稿日期: 2024-03-04
修回日期: 2024-09-05
网络出版日期: 2025-04-09
基金资助
国家自然科学基金青年项目(72004116)
国家社会科学基金重大项目(19ZDA089)
湖北省自然科学基金面上项目(2022CFB292)
The pattern of trade-embodied water pollution transfer in the Yangtze River Economic Belt based on an input-output model
Received date: 2024-03-04
Revised date: 2024-09-05
Online published: 2025-04-09
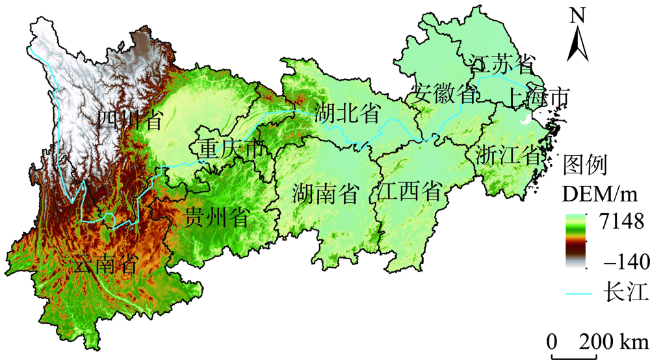
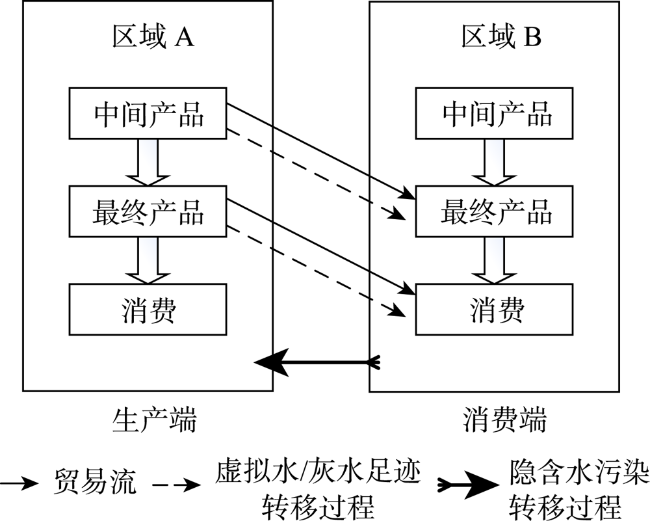
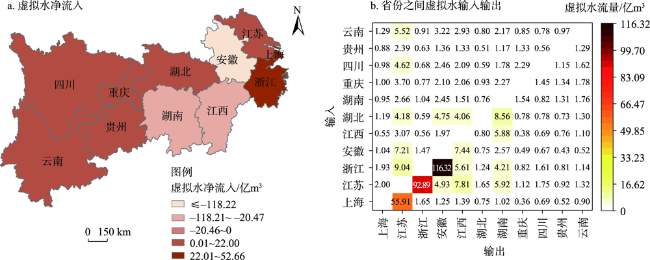
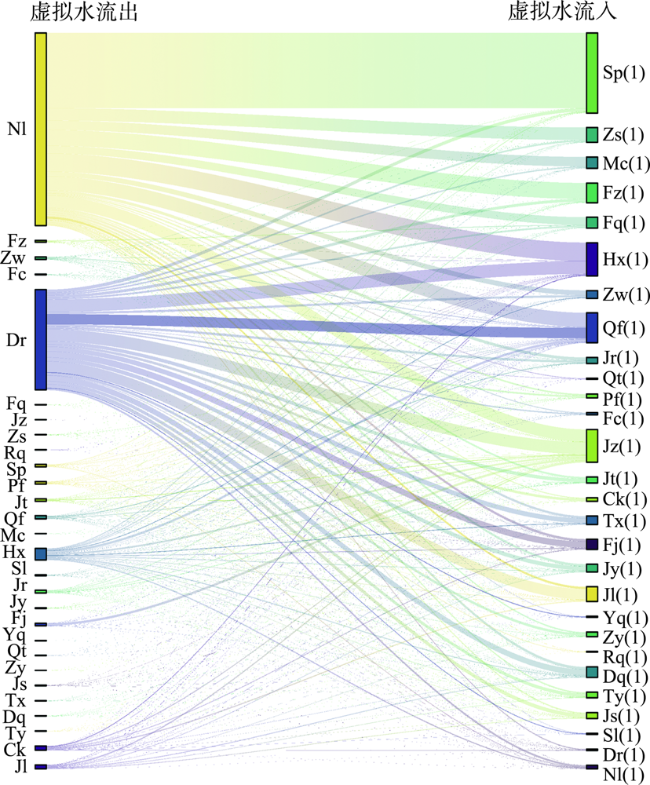
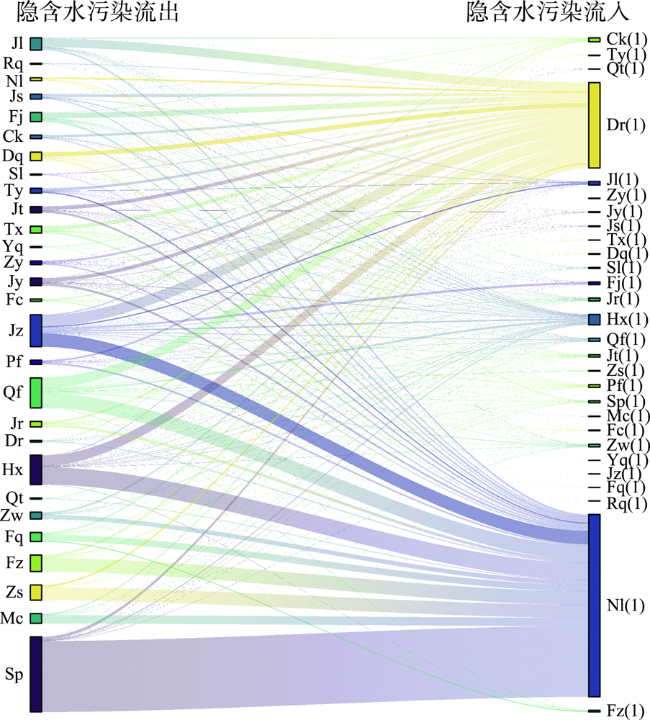
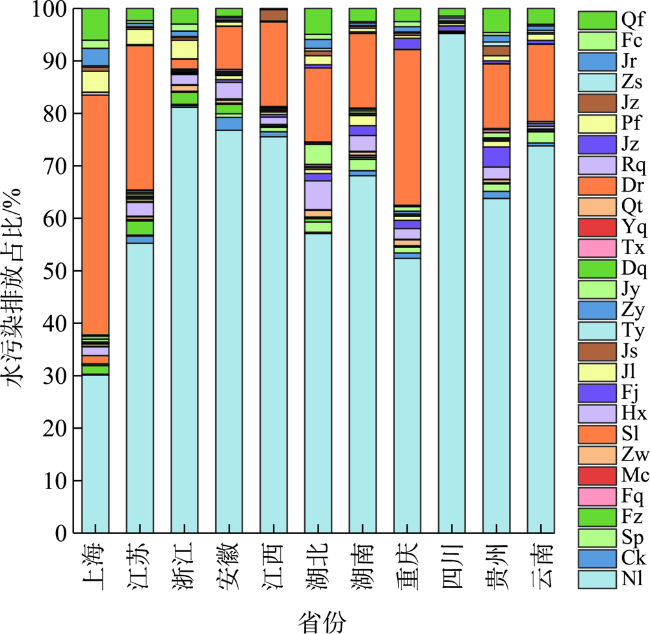
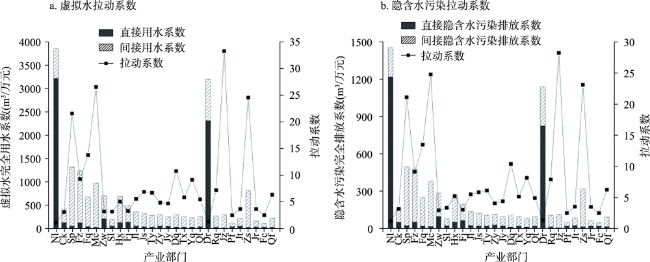
【目的】分析长江经济带贸易隐含水污染转移格局及各产业部门的隐含水污染排放拉动系数,有利于更深层次掌握区域经济社会发展与水资源保护之间的关系,为区域人水关系协同优化和可持续发展格局构建提供参考依据。【方法】本文依据多区域投入产出原理,结合2017年长江经济带多区域投入产出表与其各省(市)部门的用水数据,建立多区域投入产出模型,计算分析各省(市)间虚拟水流动格局、隐含水污染转移格局和产业部门间隐含水污染排放的拉动情况。【结果】①在虚拟水流动中,下游地区主要消费虚拟水,中游地区主要供应虚拟水,上游地区与其他地区虚拟水贸易联系较弱;上海是虚拟水的主要消费者,安徽是虚拟水的主要生产者;其他部门的虚拟水大部分来自农业和电力热力的生产供应业。②在隐含水污染转移中,下游地区转移的隐含水污染最多,隐含水污染净流出量为5.92亿m3,中游地区是隐含水污染排放的主要承担者,隐含水污染净流入量为6.43亿m3;江苏转移的隐含水污染最多,浙江承担了江苏83.37%的隐含水污染;农业部门承担的隐含水污染最多。③农业部门隐含水污染的直接排放系数最大,为1222.16 m3/万元,建筑业拉动系数最高,为28.31,若增加产出将增大其他部门的隐含水污染排放。【结论】中下游省(市)在虚拟水流动中表现活跃;隐含水污染的转移主要集中在中下游省(市)间或贸易联系密切的部门间;不同部门直接或间接用水以及隐含水污染排放强度存在较大差异。
何伟军 , 李晟桦 , 安敏 , 方雪 . 基于投入产出模型的长江经济带贸易隐含水污染转移格局[J]. 资源科学, 2025 , 47(3) : 558 -571 . DOI: 10.18402/resci.2025.03.10
[Objective] The analysis of the trade embodied water pollution transfer pattern and the pull coefficient of embodied water pollution discharge of various industrial sectors in the Yangtze River Economic Belt is conducive to a deeper understanding of the relationship between regional economic and social development and water resources protection, and provides a scientific reference for the collaborative optimization of regional human-water relationship and the construction of sustainable development pattern. [Methods] Based on the principle of multi-regional input-output, this paper established a multi-regional input-output model based on the multi-regional input-output table of the Yangtze River Economic Belt and the water consumption data of various provinces and municipalities in 2017, and calculated and analyzed the virtual water flow pattern among provinces, embodied water pollution transfer pattern and the pull of embodied water pollution discharge among industrial sectors. [Results] (1) In the virtual water flow, the downstream area mainly consumes virtual water, the middle area mainly supplies virtual water, and the upstream area has weak trade relationship with other areas; Shanghai is the main consumer of virtual water, and Anhui is the main producer of virtual water. Most of the virtual water in other sectors comes from agriculture and the production and supply of electricity and heat. (2) In the transfer of embodied water pollution, the downstream area transferred the largest amount of embodied water pollution, with a net outflow of 592 million m3, and the middle reaches area was the main bearer of the discharge of embodied water pollution, with a net inflow of 643 million m3, and Jiangsu transferred the largest amount of embodied water pollution, with Zhejiang bearing 83.37% of the embodied water pollution in Jiangsu. The agricultural sector bears the most of the embodied water pollution. (3) The direct embodied water pollution discharge of the agricultural sector was the largest, and the direct grey water discharge coefficient was 1222.16 m3/10000 yuan. The pull coefficient of the construction industry was the highest, which was 28.31, indicating that increasing the output of the construction industry would lead to a large amount of sewage discharge in other sectors. [Conclusion] The middle and lower provinces are active in the virtual water flow. The transfer of embodied water pollution is mainly concentrated in the middle and lower provinces or among departments with close trade links. There are great differences in the discharge intensity of direct or indirect water use and embodied water pollution in different departments.
表1 长江经济带多区域投入产出简表Table 1 Input-output table in multiple regions of the Yangtze River Economic Belt |
| 投入 | 中间使用 | 最终使用 | 出口 | 总产出 | |||||||||||
|---|---|---|---|---|---|---|---|---|---|---|---|---|---|---|---|
| 上海 | … | 云南 | 上海 | … | 云南 | ||||||||||
| 部门1 | … | 部门n | … | 部门1 | … | 部门n | |||||||||
| 中间投入 | 上海 | 部门1 | … | … | … | … | |||||||||
| … | … | … | … | … | … | … | … | … | |||||||
| 部门n | … | … | … | … | |||||||||||
| … | … | … | … | … | … | … | … | … | … | … | … | … | |||
| 云南 | 部门1 | … | … | … | … | ||||||||||
| … | … | … | … | … | … | … | … | … | |||||||
| 部门n | … | … | … | … | |||||||||||
| 进口 | … | … | … | ||||||||||||
| 增加值 | … | … | … | ||||||||||||
| 总投入 | … | … | … | ||||||||||||
表2 产业部门代码表Table 2 List of industrial sector codes |
| 序号 | 产业部门 | 代码 | 序号 | 产业部门 | 代码 |
|---|---|---|---|---|---|
| 1 | 农林牧渔产品和服务 | Nl | 15 | 交通运输设备 | Jy |
| 2 | 采矿业 | Ck | 16 | 电气机械和器材 | Dq |
| 3 | 食品和烟草 | Sp | 17 | 通信设备、计算机和其他电子设备 | Tx |
| 4 | 纺织品 | Fz | 18 | 仪器仪表 | Yq |
| 5 | 纺织服装鞋帽皮革羽绒及其制品 | Fq | 19 | 其他制造业 | Qt |
| 6 | 木材加工品和家具 | Mc | 20 | 电力、热力的生产和供应 | Dr |
| 7 | 造纸印刷和文教体育用品 | Zw | 21 | 燃气、水的生产和供应 | Rq |
| 8 | 石油、炼焦产品和核燃料加工品 | Sl | 22 | 建筑 | Jz |
| 9 | 化学产品 | Hx | 23 | 批发和零售 | Pf |
| 10 | 非金属矿物制品 | Fj | 24 | 交通运输、仓储和邮政 | Jt |
| 11 | 金属冶炼和压延加工品 | Jl | 25 | 住宿和餐饮 | Zs |
| 12 | 金属制品业 | Js | 26 | 金融 | Jr |
| 13 | 通用设备 | Ty | 27 | 房地产 | Fc |
| 14 | 专用设备 | Zy | 28 | 其他服务业 | Qf |
| [1] |
胡森林, 曾刚, 王胜鹏, 等. 长江经济带减污降碳的时空格局演变与技术创新驱动[J]. 地理研究, 2025, 44(1): 72-90.
[
|
| [2] |
邓淇中, 张玲. 长江经济带水资源绿色效率时空演变特征及其影响因素[J]. 资源科学, 2022, 44(2): 247-260.
[
|
| [3] |
|
| [4] |
田欣, 熊翌灵, 刘尚炜, 等. 中国省际水资源压力的转移模式[J]. 中国人口·资源与环境, 2020, 30(12): 75-83.
[
|
| [5] |
石常峰, 俞越, 吴凤平, 等. 近远程耦合视角下黄河流域产业虚拟水流动与水资源短缺风险传递[J]. 自然资源学报, 2024, 39(1): 228-244.
[
|
| [6] |
|
| [7] |
|
| [8] |
杜慧娟, 王光耀, 冉光妍, 等. 面向SDGs的塔里木河流域农业灰水足迹分析[J]. 干旱区研究, 2023, 40(7): 1184-1193.
[
|
| [9] |
柯新利, 杜丹妮, 刘姿媚. 基于灰水足迹的长江经济带耕地利用生态效率时空分异特征[J]. 农业工程学报, 2024, 40(7): 277-287.
[
|
| [10] |
柯新利, 杨银玲, 刘姿媚, 等. 兼顾水质与水量的长江经济带农业水土资源匹配时空格局[J]. 中国农业资源与区划, 2023, 44(11): 65-78.
[
|
| [11] |
张扬, 郭彤彤, 张子恺. 农业绿色水资源利用与农业经济增长脱钩关系研究[J]. 中国农业资源与区划, 2023, 44(11): 103-113.
[
|
| [12] |
刘艺文, 王洪涛. 基于灰水足迹和熵值法的苏锡常地区水敏感性行业识别[J]. 环境科学学报, 2020, 40(8): 3053-3061.
[
|
| [13] |
|
| [14] |
程鹏, 孙明东, 宋晓伟. 中国灰水足迹时空动态演进及驱动因素研究[J]. 生态环境学报, 2024, 33(5): 745-756.
[
|
| [15] |
陈敏. 长江经济带水资源配置质量演化特征及其驱动因素[J]. 资源科学, 2022, 44(6): 1280-1291.
[
|
| [16] |
何伟军, 孔阳, 沈菊琴. 长江经济带灰水足迹与经济增长的二维脱钩分析[J]. 河海大学学报(哲学社会科学版), 2022, 24(1): 68-74.
[
|
| [17] |
李胜楠, 王远, 罗进, 等. 福建省灰水足迹时空变化及驱动因素[J]. 生态学报, 2020, 40(21): 7952-7965.
[
|
| [18] |
尹明财, 朱豪, 胡圆昭, 等. 甘肃省灰水足迹变化特征及驱动因素[J]. 干旱区研究, 2022, 39(6): 1810-1818.
[
|
| [19] |
王雅洁, 刘俊国, 赵丹丹. 基于水足迹理论的水资源评价: 以河北省张家口市宣化区为例[J]. 水土保持通报, 2018, 38(5): 213-219.
[
|
| [20] |
孙才志, 阎晓东. 基于MRIO的中国省区和产业灰水足迹测算及转移分析[J]. 地理科学进展, 2020, 39(2): 207-218.
[
|
| [21] |
|
| [22] |
戴翔. 世界经济增长中的中国贡献: 基于新框架的测算[J]. 世界经济研究, 2020, (11): 45-56.
[
|
| [23] |
曹涛, 王赛鸽, 陈彬. 基于多区域投入产出分析的京津冀地区虚拟水核算[J]. 生态学报, 2018, 38(3): 788-799.
[
|
| [24] |
邓建伟, 金彦兆, 胡想全. 甘肃省水资源投入产出分析[J]. 水资源与水工程学报, 2018, 29(1): 62-66.
[
|
| [25] |
薄立明, 魏伟, 尹力, 等. 2000-2020年长江经济带水生态空间格局变化及其影响要素[J]. 中国环境科学, 2023, 43(2): 874-885.
[
|
| [26] |
|
| [27] |
金巍, 蒋薇. 长江经济带人口集聚对科技创新影响的空间异质性研究[J]. 长江流域资源与环境, 2025, 34(1): 14-27.
[
|
| [28] |
王厚双, 盛新宇, 赵鲁南. 长江经济带对外贸易竞争力水平测度及比较研究[J]. 经济理论与经济管理, 2021, 41(8): 96-112.
[
|
| [29] |
张祖增, 王灿发. 长江流域生态环境协同规制的立法诠释与意涵表达: 以《长江保护法》为述评视角[J]. 中国环境管理, 2023, 15(5): 97-106.
[
|
| [30] |
|
| [31] |
王勤勤, 刘俊国, 赵丹丹. 京津冀地区主要农作物生产水足迹研究[J]. 水资源保护, 2018, 34(2): 22-27.
[
|
| [32] |
李慧, 郑王睿, 刘耕源. 灰水足迹研究进展与方法学改进[J]. 中国环境管理, 2024, 16(1): 127-135.
[
|
| [33] |
|
| [34] |
|
| [35] |
姜珊, 秦长海, 朱永楠, 等. 北京市虚拟水消费与贸易分析[J]. 南水北调与水利科技(中英文), 2021, 19(5): 853-861.
[
|
| [36] |
孙才志, 高春阳. 中国与“一带一路”沿线国家能源贸易隐含水足迹分形特征分析[J]. 水资源保护, 2022, 38(1): 52-61.
[
|
| [37] |
阎晓东, 孙才志. 中国省际水足迹空间转移网络特征研究[J]. 长江流域资源与环境, 2021, 30(3): 602-613.
[
|
/
| 〈 |
|
〉 |
