
中国交通运输碳回弹效应的时空演进特征及机制
|
李健,男,河北沧州人,教授,研究方向为资源环境管理、循环经济与生态工业工程。E-mail: lijian631219@163.com |
收稿日期: 2024-04-07
修回日期: 2024-07-17
网络出版日期: 2024-10-29
基金资助
贵州省2023年度哲学社会科学规划重大课题项目(23GZZB17)
Spatiotemporal evolution characteristics of carbon rebound effect in China’s transportation industry and mechanism
Received date: 2024-04-07
Revised date: 2024-07-17
Online published: 2024-10-29
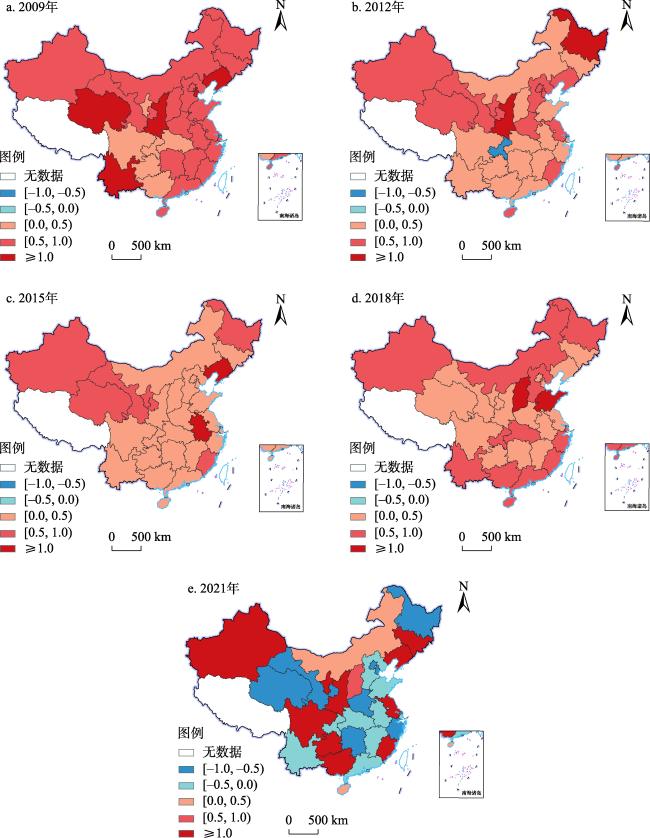
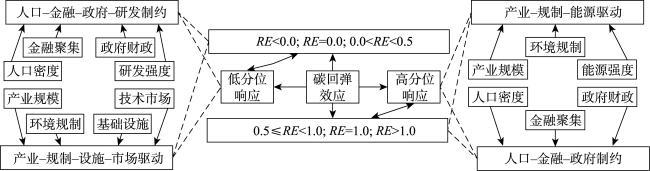
【目的】 为贯彻新发展理念,助力实现“双碳”目标,揭示交通运输业碳回弹效应的时空演进特征及影响机制,拓展能源回弹理论研究边界,为基于能源结构转型的交通运输领域节能降碳实践提供科学依据与策略参考。【方法】 采用空间核密度估计法,对2009—2021年中国交通运输业碳回弹效应的时空演进特征进行剖析,通过面板分位数回归探究不同因子对不同水平碳回弹效应的作用得到驱动或制约机制,最后引入地理探测器模型对不同机制进一步完善。【结果】 ①中国大部分省份交通运输业碳回弹效应水平在疫情前呈现出“急下降缓回升”的趋势,且具有空间相关性。②交通运输业碳回弹效应受时空条件的综合影响,随着时间的推移,逐渐形成以弱回弹为主、强回弹为辅的空间分布格局。③交通运输业碳回弹效应影响机制可分为4类驱动或制约模式(产业-规制-设施-市场驱动模式;产业-规制-能源驱动模式;人口-金融-政府-研发制约模式和人口-金融-政府制约模式)。大部分省份受低分位驱动和低分位制约两种机制作用,仅有少部分省份继续受高分位制约和高分位驱动影响,且基本属于东北、西北或西南地区。④在交通运输业碳回弹效应影响机制分析中引入地理探测器模型,发现多因子对碳回弹效应的影响存在协同作用。【结论】 碳回弹效应很大程度上与能源回弹现象同根同源,应尽快将交通运输业碳回弹效应纳入政策决策视野,根据其空间分布特点及时空演进变化趋势采用不同的政策工具,对于加快交通运输领域能源转型进程及因地制宜进行降碳减排具有重要意义。
李健 , 刘舒琪 , 王晓祺 . 中国交通运输碳回弹效应的时空演进特征及机制[J]. 资源科学, 2024 , 46(9) : 1737 -1752 . DOI: 10.18402/resci.2024.09.06
[Objective] To implement the new development concept and achieve the “dual carbon”, this study reveals the spatiotemporal evolution characteristics of the carbon rebound effect in the transportation industry and its impact mechanism, expands theoretical boundaries of energy rebound research, provides scientific evidence and strategic references for energy-saving and carbon-reduction practices in the transportation sector based on energy structure transformation. [Methods] This study employed spatial kernel density estimation to analyze the spatiotemporal evolution characteristics of the carbon rebound effect in China’s transportation sector from 2009 to 2021. Panel quantile regression was used to investigate the influence of different factors on the carbon rebound effect at various levels, thereby identifying corresponding driving or restraining mechanisms. A geographic detector model was introduced to further refine the influencing mechanisms. [Results] (1) Before the pandemic, the carbon rebound effect in China’s transportation industry primarily followed a pattern of sharp decline followed by gradual rebound, with spatial correlation observed. (2) The carbon rebound effect in the transportation sector were significantly influenced by spatiotemporal factors. Over time, a spatial distribution pattern gradually developed, with weak rebounds predominating and strong rebounds being secondary. (3) The influencing mechanism of the carbon rebound effect in the transportation sector can be divided into four driving or restraining modes (industry-regulation-facility-market driving mode; industry-regulation-energy driving mode; population-finance-government-R&D restraining mode, and population-finance-government restraining mode). Most provinces were affected by low quantile driving and restraining mechanisms, with only a few provinces continuing to be influenced by high quantile restraining and driving mechanisms, primarily located in the Northeast, Northwest, or Southwest regions. (4) Based on the mechanisms influencing carbon rebound effect in the transportation sector, the geographic detector model was introduced to investigate the impact of multi-factor coordination on carbon rebound effect, with the aim of enhancing the cohesion of regional collaborative governance. [Conclusion] The carbon rebound effect is largely homologous to the energy rebound phenomenon. To incorporate the carbon rebound in the transportation industry into policy considerations, and adopt different policy tools based on its temporal and spatial evolution characteristics are essential for accelerating the transformation of transportation energy and adapting to local conditions for emission reduction.
表1 相关变量描述Table 1 Description of related variables |
| 选取维度 | 变量名称 | 缩写 | 指标定义 | 单位 |
|---|---|---|---|---|
| 人口维度 | 人口密度 | P | 年末常住人口总数/区域面积 | 人/km2 |
| 经济维度 | 金融聚集水平 | FA | 金融行业增加值/GDP | % |
| 交通运输产业规模 | IS | 交通运输综合周转量/GDP | t/万元 | |
| 交通基础设施水平 | TFI | 铁路周转量/铁路营业里程数 | t/km | |
| 技术维度 | 能源强度 | T | 交通能源总耗/GDP | t标准煤/万元 |
| 研发强度 | RD | 研发经费内部支出/GDP | % | |
| 市场维度 | 技术市场发展水平 | DTM | 技术市场成交额/GDP | % |
| 政策维度 | 政府财政政策 | GFP | 政府财政支出/GDP | % |
| 环境规制强度 | ER | 工业污染治理投资/工业增加值 | % |
表2 因子交互作用分类Table 2 Classification of factor interactions |
| 判断依据 | 交互作用 |
|---|---|
| 非线性减弱 | |
| 单因子非线性减弱 | |
| 双因子增强 | |
| 互相独立 | |
| 非线性增强 |
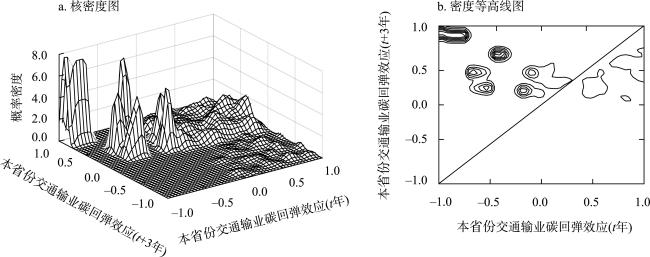
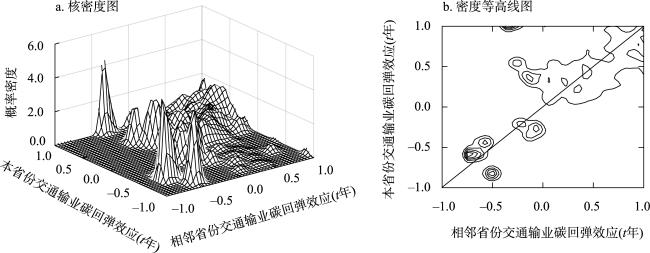
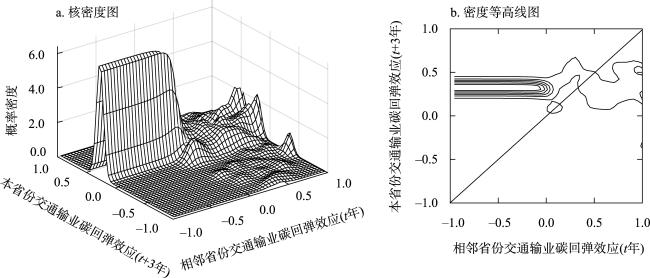
图1 中国交通运输业碳回弹效应非空间动态核密度及密度等高线Figure 1 Non-spatial dynamic kernel density and density contour of the carbon rebound effect in China’s transportation industry |
表3 中国交通运输碳回弹效应影响因素回归结果Table 3 Regression results of influencing factors of the carbon rebound effect in China’s transportation industry |
| 变量 | 分位数 | ||||
|---|---|---|---|---|---|
| 0.10 | 0.25 | 0.50 | 0.75 | 0.90 | |
| lnP | -4.45*** | -10.04*** | -6.91*** | -4.76*** | -3.40*** |
| lnFA | -0.59*** | -0.30** | -0.32** | -0.43*** | -0.74*** |
| lnIS | 1.14 | 1.99** | 2.98*** | 2.59*** | 2.07** |
| lnTFI | 6.94*** | 7.66*** | 6.02*** | 1.51 | 0.96 |
| lnT | 0.37 | 1.25 | 2.60*** | 2.94*** | 2.49** |
| lnRD | -4.33*** | -7.33*** | -2.93*** | -0.74 | -0.22 |
| lnDTM | 1.12*** | 1.10** | 0.88* | 0.68 | 0.56 |
| lnGFP | -4.29*** | -5.22*** | -7.04*** | -9.77*** | -5.88*** |
| lnER | 2.76*** | 3.67*** | 4.33*** | 2.89*** | 1.98** |
注:***、**和*分别表示在1%、5%和10%的水平上显著。 |
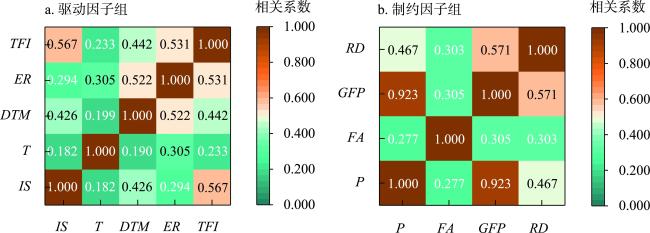
表4 2009—2021年驱动因子交互作用结果Table 4 Results of driver interactions, 2009-2021 |
| 2009年 | 2012年 | 2015年 | 2018年 | 2021年 | |||||||||
|---|---|---|---|---|---|---|---|---|---|---|---|---|---|
| 因子组 | q值 | 因子组 | q值 | 因子组 | q值 | 因子组 | q值 | 因子组 | q值 | ||||
| DTM ∩ TFI | 0.993 | DTM ∩ ER | 0.989 | TFI ∩ T | 0.915 | DTM ∩ ER | 0.892 | T ∩ ER | 0.868 | ||||
| TFI ∩ ER | 0.958 | IS ∩ ER | 0.891 | T ∩ ER | 0.915 | IS ∩ ER | 0.859 | TFI ∩ T | 0.868 | ||||
| TFI ∩ T | 0.906 | TFI ∩ ER | 0.878 | DTM ∩ ER | 0.895 | DTM ∩ TFI | 0.835 | TFI ∩ ER | 0.853 | ||||
| IS ∩ ER | 0.845 | DTM ∩ TFI | 0.874 | T ∩ IS | 0.845 | TFI ∩ ER | 0.793 | IS ∩ ER | 0.802 | ||||
| DTM ∩ IS | 0.754 | T ∩ ER | 0.851 | DTM ∩ T | 0.823 | T ∩ IS | 0.761 | IS ∩ TFI | 0.700 | ||||
| IS ∩ TFI | 0.710 | T ∩ IS | 0.784 | TFI ∩ ER | 0.805 | DTM ∩ T | 0.735 | DTM ∩ ER | 0.695 | ||||
| DTM ∩ T | 0.635 | DTM ∩ IS | 0.717 | IS ∩ ER | 0.803 | IS ∩ TFI | 0.691 | DTM ∩ IS | 0.534 | ||||
| T ∩ IS | 0.619 | DTM ∩ T | 0.671 | DTM ∩ IS | 0.785 | DTM ∩ IS | 0.670 | DTM ∩ TFI | 0.528 | ||||
| DTM ∩ ER | 0.602 | TFI ∩ T | 0.664 | IS ∩ TFI | 0.770 | T ∩ ER | 0.666 | DTM ∩ T | 0.509 | ||||
| T ∩ ER | 0.596 | IS ∩ TFI | 0.604 | DTM ∩ TFI | 0.766 | TFI ∩ T | 0.657 | T ∩ IS | 0.505 | ||||
表5 2009—2021年制约因子交互作用结果Table 5 Results of interaction of the constraints, 2009-2021 |
| 2009年 | 2012年 | 2015年 | 2018年 | 2021年 | |||||||||
|---|---|---|---|---|---|---|---|---|---|---|---|---|---|
| 因子组 | q值 | 因子组 | q值 | 因子组 | q值 | 因子组 | q值 | 因子组 | q值 | ||||
| P ∩ FA | 0.897 | FA ∩ GFP | 0.896 | RD ∩ FA | 0.899 | RD ∩ GFP | 0.894 | P ∩ FA | 0.974 | ||||
| RD ∩ GFP | 0.884 | P ∩ FA | 0.891 | P ∩ RD | 0.797 | P ∩ RD | 0.893 | RD ∩ GFP | 0.973 | ||||
| P ∩ GFP | 0.784 | P ∩ RD | 0.820 | RD ∩ GFP | 0.796 | P ∩ GFP | 0.792 | P ∩ GFP | 0.873 | ||||
| RD ∩ FA | 0.770 | P ∩ GFP | 0.719 | FA ∩ GFP | 0.694 | P ∩ FA | 0.791 | FA ∩ GFP | 0.871 | ||||
| FA ∩ GFP | 0.743 | RD ∩ GFP | 0.715 | P ∩ FA | 0.692 | FA ∩ GFP | 0.787 | P ∩ RD | 0.764 | ||||
| P ∩ RD | 0.635 | RD ∩ FA | 0.603 | P ∩ GFP | 0.636 | RD ∩ FA | 0.655 | RD ∩ FA | 0.722 | ||||
| [1] |
丁利杰, 朱泳丽. 中国交通运输业碳排放区域差异及脱钩效应[J]. 东南学术, 2023, (4): 162-174.
[
|
| [2] |
王姣娥, 陈娱, 戴特奇, 等. 中国交通地理学的传承发展与创新[J]. 经济地理, 2021, 41(10): 59-69.
[
|
| [3] |
查冬兰, 陈倩, 王群伟. 能源回弹效应最新研究进展: 理论与方法[J]. 环境经济研究, 2021(1): 182-203.
[
|
| [4] |
|
| [5] |
|
| [6] |
|
| [7] |
|
| [8] |
吴康, 耿一睿, 郭涛. 城市群绿色技术创新对碳排放的影响: 基于人力资本的调节效应[J]. 自然资源学报, 2024, 39(9): 2121-2139.
[
|
| [9] |
贾锐宁, 邵帅, 杜克锐, 等. 中国碳回弹效应的时空格局、动态演进及驱动因素: 基于改进的碳排放随机前沿模型的实证考察[J]. 中国软科学, 2022(12): 23-34.
[
|
| [10] |
张济建, 万安位, 宋雅静. 能源回弹效应下高碳产业低碳转型过程中的技术突变性[J]. 科技进步与对策, 2020, 37(18): 60-69.
[
|
| [11] |
卢娜, 王为东, 王淼, 等. 突破性低碳技术创新与碳排放: 直接影响与空间溢出[J]. 中国人口·资源与环境, 2019, 29(5): 30-39.
[
|
| [12] |
徐瑾, 单子强. 绿色技术创新对城市碳减排的影响研究: 基于空间计量模型的实证分析[J]. 经济问题探索, 2024, (9): 155-172.
[
|
| [13] |
邵帅, 范美婷, 杨莉莉. 经济结构调整、绿色技术进步与中国低碳转型发展: 基于总体技术前沿和空间溢出效应视角的经验考察[J]. 管理世界, 2022, 38(2): 46-69, 4-10.
[
|
| [14] |
何艳秋, 陈柔, 朱思宇, 等. 策略互动和技术溢出视角下的农业碳减排区域关联[J]. 中国人口·资源与环境, 2021, 31(6): 102-112.
[
|
| [15] |
田云, 尹忞昊. 技术进步促进了农业能源碳减排吗? 基于回弹效应与空间溢出效应的检验[J]. 改革, 2021, (12): 45-58.
[
|
| [16] |
陈佩. 农业碳排放回弹及机制分析: 基于农业技术进步的视角[J]. 经济与管理, 2024, 38(5): 85-92.
[
|
| [17] |
杨柏, 秦广鹏, 邬钦. “双碳”目标下中国省域碳排放核算分析[J]. 环境科学, 2022, 43(12): 5840-5849.
[
|
| [18] |
王超, 武丽敏. 基于“双碳”视角的丝绸之路经济带交通碳减排驱动因素分析[J]. 干旱区资源与环境, 2024, 38(2): 9-19.
[
|
| [19] |
李海鹏, 李卓, 张俊飚. 中国农业能源回弹效应的形成机制、时空演变及影响因素[J]. 中国人口·资源与环境, 2022, 32(10): 24-34.
[
|
| [20] |
刘华军, 乔列成, 孙淑惠. 黄河流域用水效率的空间格局及动态演进[J]. 资源科学, 2020, 42(1): 57-68.
[
|
| [21] |
|
| [22] |
阿多, 赵文吉, 宫兆宁, 等. 1981-2013华北平原气候时空变化及其对植被覆盖度的影响[J]. 生态学报, 2017, 37(2): 576-592.
[
|
| [23] |
王劲峰, 徐成东. 地理探测器: 原理与展望[J]. 地理学报, 2017, 72(1): 116-134.
[
|
| [24] |
|
| [25] |
乔岩, 焦利民. 全球视角下城市形态对交通碳排放的影响[J]. 地理研究, 2023, 42(12): 3202-3218.
[
|
| [26] |
王峥, 程占红. “双碳”目标下中国服务业碳强度时空交互特征及跃迁机制[J]. 地理学报, 2023, 78(1): 54-70.
[
|
| [27] |
梁任敏, 巴曙松. 交通通达性、资源配置与城乡消费水平差距[J]. 财经科学, 2022, (3): 68-81.
[
|
| [28] |
徐鹏, 包存宽. 环境规制对碳排放影响研究进展及未来展望[J]. 科技管理研究, 2022, 42(10): 41-47.
[
|
| [29] |
|
| [30] |
|
| [31] |
王少剑, 苏泳娴, 赵亚博. 中国城市能源消费碳排放的区域差异、空间溢出效应及影响因素[J]. 地理学报, 2018, 73(3): 414-428.
[
|
| [32] |
胡俊峰, 季爱佳. 研发强度目标导向对绿色发展的影响研究: 基于合成控制法的实证研究[J]. 湖南科技大学学报(社会科学版), 2024, 27(1): 149-158.
[
|
| [33] |
何小钰, 庄雅烨, 邱穗萱, 等. 城市三维空间结构对碳排放影响的尺度效应[J]. 生态学报, 2024, 44(2): 612-624.
[
|
/
| 〈 |
|
〉 |