
中国能源转型的空间分异与内生驱动因素
|
王琦,女,山东烟台人,硕士研究生,研究方向为区域可持续发展。E-mail: wangqi0029@igsnrr.ac.cn |
收稿日期: 2024-05-31
修回日期: 2024-08-27
网络出版日期: 2024-10-29
基金资助
国家自然科学基金项目(42071158)
国家自然科学基金项目(72050001)
Spatial differentiation and endogenous driving mechanisms of China’s energy transition
Received date: 2024-05-31
Revised date: 2024-08-27
Online published: 2024-10-29
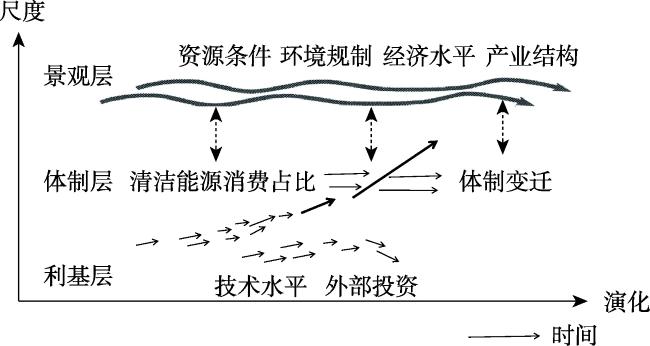
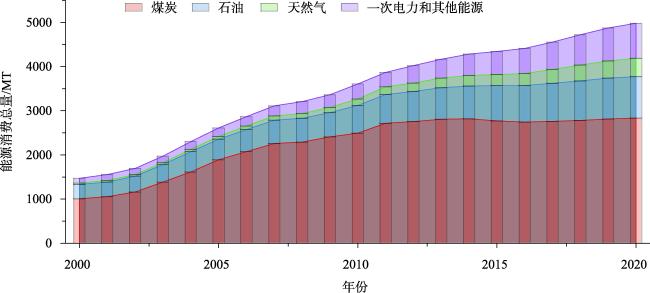
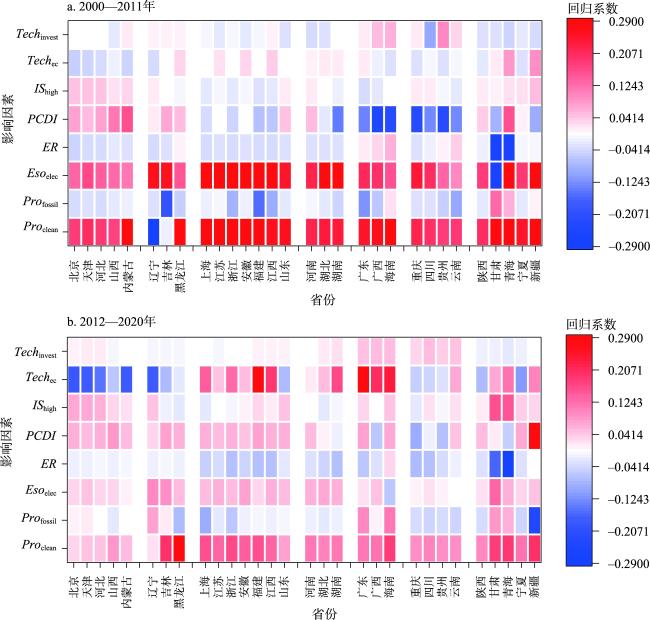
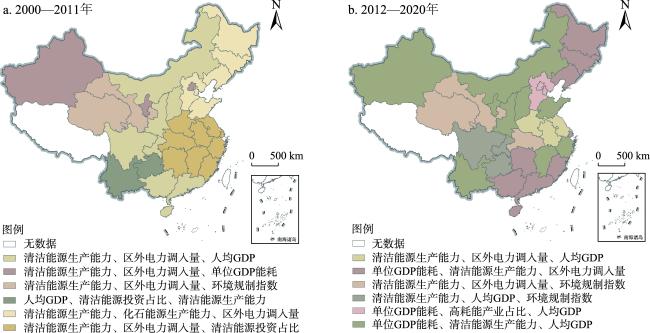
【目的】 为确保双碳目标的顺利推进,因地制宜地推动能源转型,明确中国省级层次的能源转型空间分异格局,识别影响其转型的内生驱动因素与作用差异至关重要。【方法】 本文以中国30个省份为研究对象,以清洁能源占地区能源消费的比重作为衡量指标,采用社会-技术系统多层次视角构建分析框架,运用重心模型、最小二乘法和地理时空加权回归的方法分析2000—2020年中国能源转型的格局及驱动因素。【结果】 ①尽管中国各省份在能源转型方面呈现出差异化推进态势,但随时间推移地域间差异正在逐步缩小。②在驱动因素方面,资源禀赋是驱动地区能源转型的核心主导因素,尤其是水能资源禀赋的托底和化石能源禀赋的锁定与保障作用。但区域碳减排压力与创新投入已成为新时期地区能源转型的重要驱动力量。③中国各省份能源转型的驱动因素及作用效果具有显著的时空异质性。2012年之前清洁能源生产力和区外电力调入量几乎是所有省份的主导因素。2012年后,区外电力调入的影响相对减弱,技术水平的影响加大。在空间分布上,资源禀赋对华北地区影响更为显著,经济发展水平对西北地区的转型影响更大。【结论】 随着中国能源转型的进程不断加快,地域差异逐步缩小,本文建议构建以煤电为支撑的风光水核储输一体化清洁能源供应体系,加大技术投入促进清洁能源高效利用,完善跨区域能源配置,以推动能源结构转型与可持续发展。
王琦 , 马丽 . 中国能源转型的空间分异与内生驱动因素[J]. 资源科学, 2024 , 46(9) : 1709 -1722 . DOI: 10.18402/resci.2024.09.04
[Objective] To facilitate the achievement of China’s dual carbon goals and advance energy transitions tailored to local conditions across provinces, it is crucial to clarify the spatial differentiation patterns of energy transitions at the provincial level in China and identify the endogenous driving factors and their varying effects. [Methods] This study investigated 30 Chinese provinces, employing the proportion of clean energy in regional energy consumption as a metric. A multi-level analytical framework rooted in the sociotechnical systems perspective was constructed. The centroid model, ordinary least squares (OLS) method, and geographically and temporally weighted regression (GTWR) method were used to analyze the status and driving factors of China’s energy transition from 2000 to 2020. [Results] (1) Although the provinces exhibited differentiated progress in energy transitions, the regional disparities were gradually narrowing over time. (2) In terms of driving factors of regional energy transition,s resource endowments have been the core and dominant factor, particularly the underpinning role of hydropower resources and the locking-in and assurance role of fossil fuel endowments. However, regional carbon emission reduction pressures and innovation investments have become important driving forces for regional energy transition in the new period. (3) The driving factors and their effects on energy transitions in these provinces were characterized by significant spatial and temporal heterogeneity. Prior to 2012, clean energy production capacity and electricity imports from outside the region dominated almost all provinces. Post-2012, the influence of electricity imports weakened, while technological advancements gained greater influence. Spatially, resource endowments had a more significant impact on northern China, while economic development levels exerted a stronger influence on energy transitions in northwestern China. [Conclusion] As China’s energy transition accelerates, regional disparities are diminishing. This study recommends the construction of an integrated clean energy supply system of wind, light, water, and nuclear energy storage and transmission, supported by coal power; increasing technological investments to promote the efficient use of clean energy; and improving cross-regional energy allocation, thereby driving the transformation of energy structures and sustainable development.
Key words: energy transition; sociotechnical systems; LDSV; GTWR; multi-level perspective analysis; China
表1 变量定义及数据来源Table 1 Variable definition and data sources |
| 变量分类 | 变量维度 | 变量名称 | 变量含义/单位 | 变量代号 | 数据来源 |
|---|---|---|---|---|---|
| 被解释变量 | 体制层 | 能源消费结构转型程度 | 清洁能源占能源消费比重 | ECclean | 中国能源统计年鉴 |
| 解释变量 | 景观层 | 资源禀赋 | 清洁能源禀赋分区 | Reswater Resclean | 中国统计年鉴 |
| 化石能源禀赋分区 | Resfossil | ||||
| 资源本地生产能力 | 清洁能源生产能力(生产量)/t标准煤 | Proclean | 中国能源统计年鉴 | ||
| 化石能源生产能力(生产量)/t标准煤 | Profossil | ||||
| 资源区外输入能力 | 区外电力输入量(净调入量)/t标准煤 | Esoelec | |||
| 区外化石能源输入量/t标准煤 | Esofossil | ||||
| 环境规制 | 工业排放二氧化硫、烟尘和PM2.5浓度 综合计算指数 | ER | 中国环境部数据保护中心、各省统计年鉴 | ||
| 经济水平 | 人均GDP/万元 | PCDI | 各省统计年鉴 | ||
| 产业结构 | 高能耗产业产值占工业产值比重 | IShigh | |||
| 利基层 | 技术水平 | 万元GDP能耗/(t标准煤/万元) | Techec | ||
| 外部投资 | 风电光伏投资额占总投资额比重 | Techinvest | 各省统计年鉴 |
表2 2000—2020年中国能源转型重心分布经纬度及其变化Table 2 Latitude and longitude of the center of gravity of China’s energy transition and its changes, 2000-2020 |
| 年份 | 经度 | 纬度 | 重心所在省份 | 变化方位 | 变异系数 | 年份 | 经度 | 纬度 | 重心所在省份 | 变化方位 | 变异系数 |
|---|---|---|---|---|---|---|---|---|---|---|---|
| 2000 | 108.461 | 30.392 | 湖北 | 1.022 | 2011 | 109.169 | 32.108 | 陕西 | 西北 | 0.873 | |
| 2001 | 109.389 | 30.121 | 湖北 | 东南 | 0.916 | 2012 | 109.601 | 31.918 | 陕西 | 东南 | 0.787 |
| 2002 | 109.163 | 30.164 | 湖北 | 西北 | 0.936 | 2013 | 109.602 | 32.248 | 湖北 | 东北 | 0.747 |
| 2003 | 109.259 | 30.418 | 湖北 | 东北 | 0.926 | 2014 | 109.604 | 31.788 | 陕西 | 东南 | 0.731 |
| 2004 | 109.205 | 30.933 | 重庆 | 东北 | 0.949 | 2015 | 109.727 | 31.496 | 重庆 | 东南 | 0.683 |
| 2005 | 109.631 | 31.242 | 重庆 | 东北 | 0.911 | 2016 | 110.041 | 31.724 | 湖北 | 东北 | 0.644 |
| 2006 | 109.853 | 31.421 | 重庆 | 东北 | 0.890 | 2017 | 110.098 | 31.665 | 湖北 | 东南 | 0.582 |
| 2007 | 110.010 | 31.567 | 湖北 | 东北 | 0.846 | 2018 | 110.065 | 31.872 | 湖北 | 东北 | 0.565 |
| 2008 | 109.973 | 30.992 | 重庆 | 西南 | 0.817 | 2019 | 110.176 | 31.862 | 湖北 | 西北 | 0.544 |
| 2009 | 110.098 | 31.589 | 湖北 | 东北 | 0.781 | 2020 | 110.162 | 31.909 | 湖北 | 东北 | 0.535 |
| 2010 | 109.535 | 31.987 | 陕西 | 西北 | 0.848 |
表3 共线性检验结果Table 3 Results of collinearity test |
| 变量 | VIF | 1/VIF |
|---|---|---|
| Profossil | 4.27 | 0.234 |
| Resfossil | 3.31 | 0.302 |
| Esofossil | 2.65 | 0.377 |
| PCDI | 2.40 | 0.416 |
| Resclean | 2.27 | 0.440 |
| Reswater | 2.13 | 0.471 |
| Techec | 2.01 | 0.498 |
| Proclean | 1.90 | 0.525 |
| IShigh | 1.79 | 0.557 |
| Esoelec | 1.39 | 0.721 |
| Techinvest | 1.38 | 0.727 |
| ER | 1.14 | 0.876 |
| Mean VIF | 2.22 |
表4 回归结果Table 4 Results of regression |
| 解释变量 | 双固定效应 | 固定省份 | 固定时间 |
|---|---|---|---|
| Resfossil | -0.341*** | -0.332*** | 0.016*** |
| Reswater | 0.681*** | 0.674*** | 0.026*** |
| Resclean | 0.188*** | 0.177*** | -0.031*** |
| Proclean | 0.082*** | 0.093*** | 0.123*** |
| Profossil | -0.016*** | -0.023*** | -0.039*** |
| Esoelec | 0.023*** | 0.021*** | 0.063*** |
| Esofossil | -0.004 | -0.013** | -0.012 |
| ER | 0.019*** | 0.007* | -0.038*** |
| PCDI | 0.044*** | 0.055*** | 0.108*** |
| IShigh | 0.015*** | 0.008 | 0.088*** |
| Techec | -0.030*** | -0.020*** | -0.027*** |
| Techinvest | 0.009** | 0.014*** | 0.030** |
| R2 | 0.9287 | 0.9181 | 0.6195 |
注:*、**、***表示回归系数在10%、5%、1%的水平上统计显著,下同。 |
表5 稳健性检验结果Table 5 Results of robustness test |
| 解释变量 | 回归系数 | 解释变量 | 回归系数 |
|---|---|---|---|
| Resfossil | -0.347*** | Esofossil | -0.006 |
| Reswater | 0.704*** | ER | 0.016*** |
| Resclean | 0.140*** | PCDI | 0.020** |
| Proclean | 0.087*** | IShigh | 0.011* |
| Profossil | -0.018** | Techec | -0.019 |
| Esoelec | 0.007 | Techinvest | 0.008* |
| [1] |
|
| [2] |
高启慧, 秦圆圆, 梁媚聪, 等. IPCC第六次评估报告综合报告解读及对我国的建议[J]. 环境保护, 2023, 51(Z2): 82-84.
[
|
| [3] |
王兵, 陆峰, 管欣梦, 等. 保供降碳目标下能源转型模式及转型时点分析[J]. 中国煤炭, 2024, 50(7): 8-18.
[
|
| [4] |
|
| [5] |
|
| [6] |
|
| [7] |
|
| [8] |
李慧, 涂家豪, 郭丕斌. 社会-技术景观驱动能源系统低碳转型的机理研究[J]. 软科学, 2023, 37(12): 57-64.
[
|
| [9] |
|
| [10] |
|
| [11] |
|
| [12] |
|
| [13] |
|
| [14] |
张寅浩. 能源消费强度的区域差异及其影响因素分析[J]. 宏观经济研究, 2022, (10): 129-142.
[
|
| [15] |
周婷, 王强, 党牛, 等. 青藏高原少数民族聚居区家庭能源转型效应及其影响因素研究: 基于青海省1188户家庭的问卷调查[J]. 地理科学进展, 2023, 42(10): 1921-1932.
[
|
| [16] |
|
| [17] |
|
| [18] |
陈军华, 李乔楚. 成渝双城经济圈建设背景下四川省能源消费碳排放影响因素研究: 基于LMDI模型视角[J]. 生态经济, 2021, 37(12): 30-36.
[
|
| [19] |
王青, 傅莉媛, 孙海添. 中国工业生产能源消费碳排放的区域差异、动态演进与影响因素[J]. 资源科学, 2023, 45(6): 1239-1254.
[
|
| [20] |
杨玺, 孙奕生, 常世彦, 等. 加速能源转型与产业结构调整的环境健康协同效益评估: 以京津冀鲁地区为例[J]. 环境科学, 2023, 44(7): 3627-3636.
[
|
| [21] |
冯超, 赵军, 卿苗, 等. 城市活力视角下全国地级资源型城市转型效率评价研究[J]. 资源开发与市场, 2022, 38(9): 1043-1051.
[
|
| [22] |
封亦代, 刘耀彬, 程风雨. 中国城市绿色全要素能源效率的区域差异及空间收敛[J]. 地理研究, 2023, 42(9): 2343-2368.
[
|
| [23] |
李顺成, 肖卫东, 王志宝. 家庭部门能源消费影响因素及碳排放结构研究: 基于PLS结构方程模型的实证解析[J]. 软科学, 2020, 34(2): 117-123.
[
|
| [24] |
刘玉珂, 金声甜. 中部六省能源消费碳排放时空演变特征及影响因素[J]. 经济地理, 2019, 39(1): 182-191.
[
|
| [25] |
刘司乐, 王芳, 冯艳芬, 等. “双碳”目标下中国能源绿色消费转型的时空格局及影响因素[J]. 资源开发与市场, 2023, 39(4): 408-416.
[
|
| [26] |
|
| [27] |
|
| [28] |
|
| [29] |
田原, 孙慧, 李建军. 中国资源型产业低碳转型影响因素实证研究: 基于STIRPAT模型的动态面板数据检验[J]. 生态经济, 2018, 34(8): 14-18.
[
|
| [30] |
赵晓丽, 张钰琛, 杨曦. 中国城市能源转型的特征及影响因素分析: 基于中国131个城市的经验证据[J]. 技术经济, 2022, 41(4): 130-140.
[
|
| [31] |
|
| [32] |
|
| [33] |
|
| [34] |
|
| [35] |
|
| [36] |
邹瞳, 郭丕斌, 吴青龙. 中国能源绿色消费水平的时空演化特征及驱动因素: 基于“社会-技术”系统转型视角[J]. 科技管理研究, 2022, 42(22): 191-198.
[
|
| [37] |
梁龙武, 先乐, 陈明星. 改革开放以来中国区域人口与经济重心演进态势及其影响因素[J]. 经济地理, 2022, 42(2): 93-103.
[
|
| [38] |
陈强. 高级计量经济学及STATA应用[M]. 北京: 高等教育出版社, 2014.
[
|
| [39] |
|
| [40] |
李慧, 涂家豪. 多层级视角下能源低碳转型因素组态研究: 基于我国30个省域的模糊集定性比较分析[J]. 技术经济, 2020, 39(8): 152-160.
[
|
| [41] |
胡晓辉, 董柯. 可持续性转型研究动态与经济地理学展望[J]. 地理研究, 2022, 41(1): 18-33.
[
|
| [42] |
孙振清, 成晓斐, 谷文姗. 中国环保投资效率的空间差异及影响因素研究: 基于差异化环境规制工具视角[J]. 生态经济, 2022, 38(4): 170-176.
[
|
| [43] |
李卫兵, 张凯霞. 空气污染对企业生产率的影响: 来自中国工业企业的证据[J]. 管理世界, 2019, 35(10): 95-112.
[
|
| [44] |
万世龙, 杨海楠, 马丽, 等. 黄河流域城市群水生态系统服务与城镇化权衡协同关系[J]. 资源科学, 2024, 46(3): 505-523.
[
|
| [45] |
王国法, 刘合, 王丹丹, 等. 新形势下我国能源高质量发展与能源安全[J]. 中国科学院院刊, 2023, 38(1): 23-37.
[
|
/
| 〈 |
|
〉 |