
人口增长与收缩对城市经济韧性的影响机制——基于产业结构和人力资本的调节效应
|
吴康,男,江苏淮安人,教授,研究方向为城市经济、城乡规划与国土空间治理、大数据与城市可持续发展。E-mail: wukang@cueb.edu.cn |
收稿日期: 2023-12-08
修回日期: 2024-02-01
网络出版日期: 2024-03-21
基金资助
国家自然科学基金项目(42171216)
首都经济贸易大学重大培育项目(ZD202302)
首都经济贸易大学学术学位研究生科技创新项目(2023KJCX011)
The impact mechanism of population growth and shrinkage on urban economic resilience: Based on the moderating effects of industrial structure and human capital
Received date: 2023-12-08
Revised date: 2024-02-01
Online published: 2024-03-21
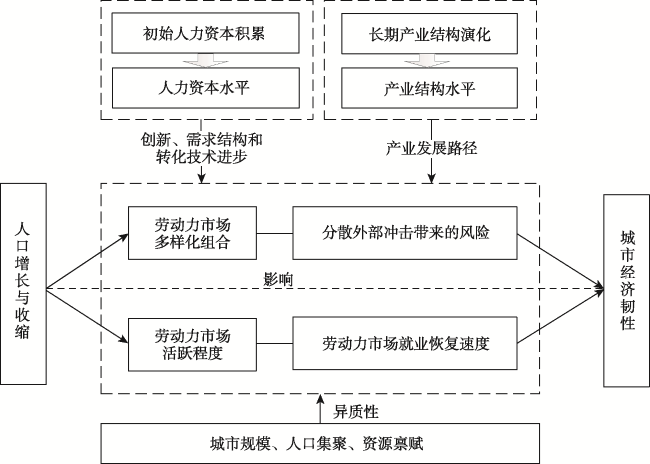
【目的】 提高经济韧性是实现城市可持续发展的关键。当前城市人口分化日益明显,探究人口增长与收缩对城市经济韧性的影响机制,对增强城市韧性、应对不确定风险具有重要意义。【方法】 本文基于2008—2019年中国280个地级及以上城市的面板数据,采用固定效应模型和调节效应模型,实证检验了人口增长与收缩对城市经济韧性的影响机制。【结果】 研究发现:①人口增长与收缩对城市经济韧性具有显著影响,其中对城市抵御风险能力的影响大于对经济恢复能力的影响。②机制分析表明,产业结构和人力资本水平在人口增长与收缩对城市经济韧性的影响中具有正向调节作用。③产业结构升级效应和人力资本效应具有城市规模和资源禀赋异质性,其中产业结构升级效应在大城市和非资源型经济地区较为明显。【结论】 提高人力资本水平、加快产业集聚和升级是人口分化背景下增强城市经济韧性重要策略,本文的研究发现可为不同地区制定适应人口增长与收缩的可持续发展路径提供重要参考。
吴康 , 宋嘉卓 , 陈艺文 . 人口增长与收缩对城市经济韧性的影响机制——基于产业结构和人力资本的调节效应[J]. 资源科学, 2024 , 46(2) : 249 -261 . DOI: 10.18402/resci.2024.02.02
[Objective] Enhancing economic resilience of cities is key to achieving sustainable urban development. With the increasing differentiation in urban population growth, exploring the mechanisms of impact of population growth and shrinkage on urban economic resilience is crucial for strengthening urban resilience and addressing uncertain risks. [Methods] Based on the panel data of 280 prefecture-level and above cities in China from 2008 to 2019, this study employed fixed effect models and moderating effect models to empirically test the mechanisms of impact of population growth and shrinkage on urban economic resilience. [Results] The study found that: (1) Population growth and shrinkage have a significant impact on urban economic resilience, with a greater effect on the cities’ ability to withstand risks than on their economic recovery capabilities. (2) Mechanism analysis result indicates that industrial structure and human capital level played a positive moderating role in the impact of population growth and shrinkage on urban economic resilience. (3) The effects of industrial structure upgrading and human capital varied with city size and resource endowment, with the industrial structure upgrading effect more pronounced in large cities and non-resource-based economic regions. [Conclusion] Improving the level of human capital and accelerating industrial agglomeration and upgrading are important strategies to enhance urban economic resilience in the context of population growth differentiation. The findings of this study can provide important references for different regions to formulate sustainable development paths adapted to population growth or shrinkage.
表1 变量描述性统计Table 1 Descriptive statistics |
| 变量 | 单位 | 观测数 | 平均值 | 标准差 | 最小值 | 最大值 |
|---|---|---|---|---|---|---|
| resil | —— | 3300 | 0.108 | 1.167 | -11.584 | 5.344 |
| resis | —— | 1384 | 0.527 | 0.515 | -1.996 | 2.453 |
| recov | —— | 1916 | -0.194 | 1.392 | -11.584 | 5.344 |
| gpop | —— | 3300 | 0.998 | 0.032 | 0.629 | 1.581 |
| IS | —— | 3300 | 2.293 | 1.120 | 1.831 | 65.641 |
| hum | —— | 3300 | 0.818 | 0.249 | 0.360 | 6.833 |
| pergdp | 万元/人,取对数 | 3300 | 10.360 | 0.637 | 4.483 | 12.461 |
| retail | —— | 3300 | 0.375 | 0.108 | 0.000 | 0.996 |
| density | 人/m2,取对数 | 3300 | 5.799 | 1.033 | 1.783 | 27.223 |
| financial | —— | 3300 | 0.905 | 0.557 | 0.075 | 7.450 |
| infra | m2/人,取对数 | 3300 | 8.491 | 0.993 | 2.197 | 12.822 |
| foreign | —— | 3300 | 0.018 | 0.018 | 0.000 | 0.198 |
| budget | —— | 3300 | 0.473 | 0.225 | 0.056 | 1.541 |
表2 基准回归结果Table 2 Benchmark regression results |
| 变量 | (1) | (2) | (3) | (4) | (5) |
|---|---|---|---|---|---|
| resil | resil | resil | resis | recov | |
| gpop | 2.234*** | 1.042** | 0.924** | 0.740* | 0.575 |
| (0.526) | (0.429) | (0.442) | (0.402) | (0.858) | |
| pergdp | 0.762** | 0.076 | 1.974*** | ||
| (0.336) | (0.134) | (0.495) | |||
| retail | -5.320*** | -2.006*** | -6.422*** | ||
| (0.956) | (0.627) | (1.329) | |||
| density | 0.133*** | -0.554 | 0.128** | ||
| (0.025) | (0.581) | (0.052) | |||
| financial | -0.370*** | -0.129** | -0.666** | ||
| (0.123) | (0.056) | (0.332) | |||
| infra | -0.034 | 0.090 | -0.130* | ||
| (0.044) | (0.073) | (0.074) | |||
| foreign | 2.240 | 0.448 | -0.206 | ||
| (1.922) | (1.504) | (3.388) | |||
| budget | 0.796*** | -0.050 | 1.450** | ||
| (0.301) | (0.193) | (0.590) | |||
| _cons | -2.120*** | -0.274 | -6.590** | 2.449 | -18.432*** |
| (0.529) | (0.429) | (3.340) | (3.677) | (5.229) | |
| City FE | NO | YES | YES | YES | YES |
| Year FE | NO | YES | YES | YES | YES |
| N | 3300 | 3300 | 3300 | 1384 | 1916 |
| R2 | 0.004 | 0.310 | 0.402 | 0.581 | 0.454 |
注:*、**、***分别表示在10%、5%和1%的水平上显著,括号内为标准误。下同。 |
表3 稳健性检验Table 3 Robustness test of the benchmark regression |
| (1) | (2) | (3) | (4) | |
|---|---|---|---|---|
| 变量 | 更换被解释变量 | 更换核心解释变量 | 剔除直辖市样本 | 控制城市随时间变化的线性趋势 |
| gpop | 0.146* | 0.898** | 1.144** | |
| (0.086) | (0.440) | (0.489) | ||
| gpop1 | 0.534*** | |||
| (0.117) | ||||
| _cons | -2.425 | -6.480** | -6.791* | -0.234 |
| (1.883) | (1.883) | (3.488) | (1.163) | |
| Control | YES | YES | YES | YES |
| City FE | YES | YES | YES | YES |
| Year FE | YES | YES | YES | YES |
| City×Year | NO | NO | NO | YES |
| N | 3300 | 3300 | 3252 | 3300 |
| R2 | 0.165 | 0.405 | 0.405 | 0.132 |
表4 产业结构升级效应、人力资本效应检验Table 4 Results of the analysis of industrial structure upgrading effect and human capital effect |
| 变量 | (1) | (2) | (3) | (4) |
|---|---|---|---|---|
| resil | resil | resil | resil | |
| gpop | 1.762*** | 1.594*** | 0.969** | 0.848** |
| (0.516) | (0.490) | (0.414) | (0.415) | |
| IS | -0.068*** | -0.068*** | ||
| (0.026) | (0.022) | |||
| gpop×IS | 10.177*** | 9.470*** | ||
| (3.780) | (3.268) | |||
| hum | 0.127 | 0.110 | ||
| (0.113) | (0.093) | |||
| gpop×hum | 4.477* | 4.314* | ||
| (2.410) | (2.222) | |||
| _cons | -0.850* | -7.079** | -0.304 | -6.611** |
| (0.483) | (3.325) | (0.430) | (3.352) | |
| Control | NO | YES | NO | YES |
| City FE | YES | YES | YES | YES |
| Year FE | YES | YES | YES | YES |
| N | 3300 | 3300 | 3300 | 3300 |
| R2 | 0.311 | 0.403 | 0.311 | 0.343 |
表5 城市规模的异质性分析结果Table 5 Results of heterogeneity analysis of urban scale |
| 变量 | 中小城市 | 大城市 | |||||
|---|---|---|---|---|---|---|---|
| (1) | (2) | (3) | (4) | (5) | (6) | ||
| gpop | 0.620 | 1.917** | 0.610 | 2.089*** | 1.791** | 1.880*** | |
| (0.522) | (0.884) | (0.544) | (0.725) | (0.808) | (0.569) | ||
| gpop×IS | 10.977** | 14.158** | |||||
| (5.423) | (5.855) | ||||||
| IS | 1.539 | -0.101*** | |||||
| (1.072) | (0.039) | ||||||
| gpop×hum | -0.377 | 10.417* | |||||
| (2.147) | (5.360) | ||||||
| hum | -0.068 | 0.058 | |||||
| (0.144) | (0.165) | ||||||
| _cons | -10.993* | -14.376** | -10.996* | -0.851 | -0.009 | -0.776 | |
| (6.147) | (6.483) | (6.145) | (3.149) | (3.188) | (3.108) | ||
| Control | YES | YES | YES | YES | YES | YES | |
| City FE | YES | YES | YES | YES | YES | YES | |
| Year FE | YES | YES | YES | YES | YES | YES | |
| N | 2304 | 2304 | 2304 | 996 | 996 | 996 | |
| R2 | 0.395 | 0.397 | 0.395 | 0.471 | 0.474 | 0.475 | |
表6 资源型城市与非资源型城市异质性分析结果Table 6 Results of heterogeneity analysis between resource-based and non-resource-based cities |
| 变量 | 资源型城市 | 非资源型城市 | |||||
|---|---|---|---|---|---|---|---|
| (1) | (2) | (3) | (4) | (5) | (6) | ||
| gpop | 0.020 | 2.584 | 0.406 | 1.549*** | 1.745*** | 1.244** | |
| (0.770) | (1.743) | (0.914) | (0.520) | (0.547) | (0.631) | ||
| gpop×IS | 20.244* | 7.102* | |||||
| (10.328) | (3.833) | ||||||
| IS | 1.820 | -0.052** | |||||
| (1.467) | (0.026) | ||||||
| gpop×hum | 4.916 | 3.264 | |||||
| (5.921) | (3.583) | ||||||
| hum | 0.133 | 0.077 | |||||
| (0.152) | (0.165) | ||||||
| _cons | -5.488 | -11.952** | -6.023 | -14.533*** | -14.432*** | -13.623*** | |
| (4.335) | (5.840) | (4.422) | (4.083) | (4.081) | (4.058) | ||
| Control | YES | YES | YES | YES | YES | YES | |
| City FE | YES | YES | YES | YES | YES | YES | |
| Year FE | YES | YES | YES | YES | YES | YES | |
| N | 1312 | 1312 | 1312 | 1988 | 1988 | 1988 | |
| R2 | 0.424 | 0.426 | 0.424 | 0.396 | 0.397 | 0.396 | |
| [1] |
|
| [2] |
陆铭, 向宽虎, 李鹏飞, 等. 分工与协调: 区域发展的新格局、新理论与新路径[J]. 中国工业经济, 2023, (8): 5-22.
[
|
| [3] |
吴康, 戚伟. 收缩型城市: 认知误区、统计甄别与测算反思[J]. 地理研究, 2021, 40(1): 213-229.
[
|
| [4] |
林靖杰, 张京祥. 北京城市空间增长-收缩并存的特征与机制[J]. 城市规划, 2023, 47(11): 90-100.
[
|
| [5] |
李郇, 吴康, 龙瀛, 等. 局部收缩: 后增长时代下的城市可持续发展争鸣[J]. 地理研究, 2017, 36(10): 1997-2016.
[
|
| [6] |
刘艳军, 张艺宁, 孙宏日, 等. 收缩城市住房空置时空分异及影响机制: 基于居民用电量视角[J]. 地理科学, 2021, 41(12): 2087-2095.
[
|
| [7] |
|
| [8] |
|
| [9] |
唐宇, 宋永永, 薛东前, 等. 能源富集区经济韧性演化过程及影响机制: 以榆林市为例[J]. 资源科学, 2022, 44(7): 1331-1343.
[
|
| [10] |
胡晓辉, 董柯, 杨宇. 战略耦合演化视角下的区域经济韧性分析框架[J]. 地理研究, 2021, 40(12): 3272-3286.
[
|
| [11] |
李睿倩, 徐成磊, 李永富, 等. 国外海岸带韧性研究进展及其对中国的启示[J]. 资源科学, 2022, 44(2): 232-246.
[
|
| [12] |
|
| [13] |
|
| [14] |
|
| [15] |
贺灿飞, 盛涵天. 区域经济韧性: 研究综述与展望[J]. 人文地理, 2023, 38(1): 1-10.
[
|
| [16] |
|
| [17] |
|
| [18] |
|
| [19] |
陈安平. 集聚与中国城市经济韧性[J]. 世界经济, 2022, 45(1): 158-181.
[
|
| [20] |
|
| [21] |
|
| [22] |
|
| [23] |
|
| [24] |
张明斗, 曲峻熙. 中国广义城市收缩的空间格局与生成逻辑研究: 基于人口总量和经济规模的视角[J]. 经济学家, 2020, (1): 77-85.
[
|
| [25] |
戚伟, 刘振, 刘盛和, 等. 基于“城区常住人口”的2010-2020年中国收缩城市识别[J]. 地理研究, 2023, 42(10): 2539-2555.
[
|
| [26] |
|
| [27] |
|
| [28] |
|
| [29] |
|
| [30] |
刘玉博, 张学良, 吴万宗. 中国收缩城市存在生产率悖论吗: 基于人口总量和分布的分析[J]. 经济学动态, 2017, (1): 14-27.
[
|
| [31] |
李秀霞, 崔永静, 陈奇, 等. 东北地区人口收缩的经济效应与对策响应[J]. 人口与经济, 2023, (1): 71-86.
[
|
| [32] |
|
| [33] |
|
| [34] |
|
| [35] |
陆铭, 高虹, 佐藤宏. 城市规模与包容性就业[J]. 中国社会科学, 2012, (10): 47-66, 206.
[
|
| [36] |
|
| [37] |
|
| [38] |
|
| [39] |
李伟, 贺灿飞. 中国区域产业演化路径: 基于技术关联性与技术复杂性的研究[J]. 地理科学进展, 2021, 40(4): 620-634.
[
|
| [40] |
|
| [41] |
|
| [42] |
|
| [43] |
孙红雪, 朱金鹤, 王雅莉. 高质量人力资本与中国城市经济韧性: 基于高校扩招政策的实证分析[J]. 当代财经, 2023, (5): 15-28.
[
|
| [44] |
吴康, 刘骁啸, 姚常成. 产业转型对中国资源型城市增长与收缩演变轨迹的影响机制[J]. 自然资源学报, 2023, 38(1): 109-125.
[
|
| [45] |
谭俊涛, 赵宏波, 刘文新, 等. 中国区域经济韧性特征与影响因素分析[J]. 地理科学, 2020, 40(2): 173-181.
[
|
| [46] |
孙伟增, 牛冬晓, 万广华. 交通基础设施建设与产业结构升级: 以高铁建设为例的实证分析[J]. 管理世界, 2022, 38(3): 19-34.
[
|
| [47] |
姚常成, 宋冬林. 借用规模、网络外部性与城市群集聚经济[J]. 产业经济研究, 2019, (2): 76-87.
[
|
| [48] |
刘晓星, 张旭, 李守伟. 中国宏观经济韧性测度: 基于系统性风险的视角[J]. 中国社会科学, 2021, (1): 12-32.
[
|
| [49] |
张晏, 龚六堂. 地区差距、要素流动与财政分权[J]. 经济研究, 2004, (7): 59-69.
[
|
| [50] |
吉黎, 张婉莹, 孙三百. 城市空间优化与经济高质量发展: 基于区界重组的经验证据[J]. 财经研究, 2023, 49(8): 4-18.
[
|
| [51] |
曾刚, 陆琳忆, 何金廖. 生态创新对资源型城市产业结构与工业绿色效率的影响[J]. 资源科学, 2021, 43(1): 94-103.
[
|
| [52] |
陈靖, 李惠璇, 徐建国, 等. 城市规模与就业冲击: 基于新冠疫情后的网络招聘数据分析[J]. 经济学(季刊), 2022, 22(6): 2125-2146.
[
|
| [53] |
吴康, 张文忠, 张平宇, 等. 中国资源型城市的高质量发展: 困境与突破[J]. 自然资源学报, 2023, 38(1): 1-21.
[
|
| [54] |
郑紫颜, 仇方道, 张春丽, 等. 再生性资源型城市功能转型异质性及其工业结构解析[J]. 资源科学, 2020, 42(3): 570-582.
[
|
/
| 〈 |
|
〉 |