
经济政策不确定性对中国碳排放的对称与非对称影响
|
刘妍,女,黑龙江哈尔滨人,博士,副教授,研究方向为时间序列分析理论及其应用。E-mail: liuyan0617@ouc.edu.cn |
收稿日期: 2021-11-19
修回日期: 2022-04-15
网络出版日期: 2022-08-25
基金资助
国家自然科学基金青年项目(72003180)
Symmetric and asymmetric impacts of economic policy uncertainty on China’s carbon emissions
Received date: 2021-11-19
Revised date: 2022-04-15
Online published: 2022-08-25
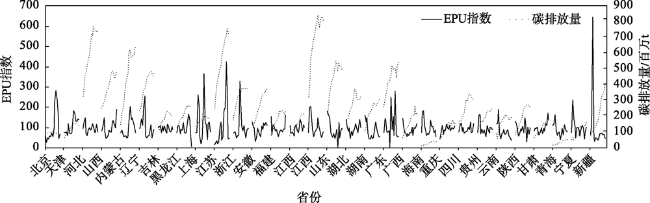
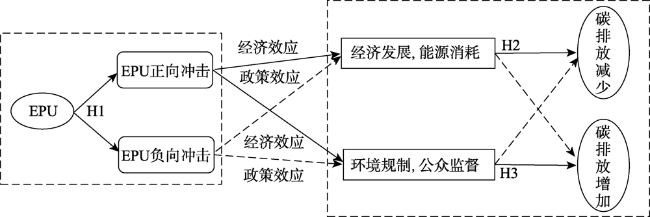
在全球经济快速转型背景下,经济政策不确定性(EPU)的影响已渗入到生产生活的各个领域,正确认识经济政策不确定性带来的环境风险对“双碳目标”实现至关重要。本文基于非对称传导效应视角,采用2003—2017年中国30个省份面板数据,实证检验EPU在长短期对碳排放的对称与非对称影响,并基于经济发展水平展开异质性分析,构建中介效应模型分析EPU上升、下降对碳排放影响的作用机制。研究表明:①EPU对碳排放短期存在非对称影响,长期存在对称影响。在短期,EPU上升显著影响碳排放,而EPU下降对碳排放影响不明显。在长期,两者呈负相关的线性关系,EPU下降促进碳排放。②EPU对碳排放的影响因经济发展水平不同而具有明显区域异质性。在短期,EPU变化对东部地区作用不显著,对中、西部地区作用显著,并表现出非对称影响;在长期,东部地区仅有EPU下降会增加碳排放,中、西部地区EPU与碳排放呈现负相关的线性关系。③碳排放在不同区域受到EPU冲击后的调整速度不同,东部地区的自我调节能力高于中、西部地区,能更迅速地调整并稳定碳排放水平。④EPU对碳排放的影响主要通过经济效应表现,EPU上升通过抑制经济增长活力导致碳排放降低,EPU下降通过加快经济增长速度导致碳排放增加。未来,政府应审慎调整经济政策,健全和完善市场信息披露体系并充分发挥地区比较优势助推新兴产业发展。
刘妍 , 赵晶 , 李晨 . 经济政策不确定性对中国碳排放的对称与非对称影响[J]. 资源科学, 2022 , 44(6) : 1091 -1104 . DOI: 10.18402/resci.2022.06.01
Under the background of rapid global economic transformation, economic policy uncertainty (EPU) has penetrated into all fields of production and life, and a proper understanding of the environmental risks brought by EPU is crucial to the achievement of the carbon peak and carbon neutrality goals. Based on the asymmetric transmission effect perspective, this study empirically examined the symmetric and asymmetric effects of EPU on carbon emissions in the long and short term using the panel data of 30 Chinese provinces from 2003 to 2017, developed heterogeneity analysis based on the level of economic development, and constructed a mediation effect model to analyze the mechanism of the effect of rising and falling EPU on carbon emissions. The results show that: (1) There is an asymmetric effect of EPU on carbon emissions in the short term and a symmetric effect in the long term. In the short term, a rise in EPU significantly affects carbon emissions, while a fall in EPU has an insignificant effect on carbon emissions. In the long term, there is a negative linear relationship between the two, and a decrease in EPU promotes carbon emissions. (2) The effect of EPU on carbon emissions shows significant regional heterogeneity depending on the level of economic development. In the short term, the effect of EPU change is not significant for the eastern region, but significant for the central and western regions, and shows asymmetric effects; in the long term, only the decline of EPU in the eastern region increases carbon emissions, and the EPU and carbon emissions in the central and western regions show a negative linear relationship. (3) Carbon emissions adjust at different speeds in different regions after EPU shocks, with the eastern region having a higher self-regulation ability than the central and western regions, and being able to adjust and stabilize carbon emission levels more quickly. (4) The impact of EPU on carbon emissions is mainly expressed through economic effects, with rising EPU leading to lower carbon emissions by suppressing economic growth dynamics, and falling EPU leading to higher carbon emissions by accelerating economic growth rate. In the future, the government should prudently adjust economic policies, improve the market information disclosure system, and give full play to regional comparative advantages to promote the development of new industries.
表1 中国EPU指数与中国省级EPU指数的比较Table 1 Comparison between national EPU and China’s provincial EPU |
| 选取维度 | 中国EPU指数 | 中国省际EPU指数 |
|---|---|---|
| 关键词报纸源 | South China Morning Post | 《人民日报》《光明日报》《经济日报》 |
| 测算报纸源 | South China Morning Post | 各省份主流报纸 |
| 反映层面 | 中国整体层面 | 中国各省份层面 |
| 关键词:经济 | economy, economic | 经济 |
| 关键词:政策 | policy, spending, budget, political, interest rate, reform, government, Beijing, authorities, tax, regulation, regulatory, Central Bank, People's Bank of China, PBOC, deficit, WTO | (促进、刺激、扩大)消费、调整利率/利率调整、(扩大、减少)投资、(增加、减少)税收/减税/税收政策/财税改革、财政支出/财政体制/财政刺激、货币/货币政策、扩大出口、增值税/消费税/企业所得税/个人所得税/房产税/关税、转移支付、地方债务、养老金、政策试点、加强监管 |
| 关键词:不确定 | uncertain, uncertainty | 不确定、预测、预计、试点、试行、示范、或许、可能、有待、有望 |
表2 变量说明Table 2 Variable descriptions |
| 指标类型 | 变量名称 | 变量解释与单位 | 数据来源 |
|---|---|---|---|
| 碳排放 | C | 碳排放量/百万t | http://www.ceads.net |
| 经济发展 | RGDP | 人均GDP/(元/人) | 《中国统计年鉴》 |
| 经济政策不确定性 | EPU | 中国省际EPU指数 | https://doi.org/10.1016/j.eneco.2020.105071 |
| DLS指数 | http://www.policyuncertainty.com | ||
| 能源消耗 | EU | 能源消耗总量/万t标准煤 | 《中国能源统计年鉴》 |
| 环境规制 | ER | 排污费征收单位个数 | 《中国环境统计年鉴》 |
表3 相关省份区域划分Table 3 Regional division of relevant provinces |
| 东部地区 | 中部地区 | 西部地区 |
|---|---|---|
| 北京市、天津市、河北省、辽宁省、上海市、江苏省、浙江省、福建省、山东省、广东省、海南省 | 山西省、吉林省、黑龙江省、安徽省、江西省、河南省、湖南省、湖北省 | 内蒙古自治区、广西壮族自治区、重庆市、四川省、贵州省、云南省、陕西省、甘肃省、青海省、宁夏回族自治区、新疆维吾尔自治区 |
表4 东、中、西部地区描述性统计Table 4 Descriptive statistics for the eastern, central, and western regions of China |
| 变量 | 样本容量 | 平均值 | 标准差 | 最小值 | 最大值 | 偏度 |
|---|---|---|---|---|---|---|
| 东部地区 | ||||||
| C/百万t | 165 | 330.3 | 234.1 | 15.6 | 842.2 | 0.561 |
| EPU | 165 | 106.0 | 67.59 | 4.098 | 424.4 | 1.924 |
| RGDP/(元/人) | 165 | 51310 | 28446 | 8592 | 128994 | 0.658 |
| 中部地区 | ||||||
| C/百万t | 120 | 271.5 | 114.5 | 75.9 | 548.5 | 0.661 |
| EPU | 120 | 93.38 | 33.03 | 2.285 | 189.2 | 0.244 |
| RGDP/(元/人) | 120 | 26669 | 13789 | 6375 | 60199 | 0.309 |
| 西部地区 | ||||||
| C/百万t | 165 | 185.5 | 125.4 | 17.6 | 639.0 | 1.603 |
| EPU | 165 | 93.82 | 53.93 | 31.17 | 646.6 | 6.777 |
| RGDP/(元/人) | 165 | 25587 | 16143 | 3701 | 72064 | 0.832 |
表5 LLC、IPS单位根检验结果Table 5 Results of LLC and IPS unit root test |
| 变量 | LLC单位根检验 | IPS单位根检验 | |||||
|---|---|---|---|---|---|---|---|
| 原序列t值 | 一阶差分t值 | 结果 | 原序列t值 | 一阶差分t值 | 结果 | ||
| LC | -10.122*** | — | I(0) | -7.319*** | — | I(0) | |
| LRGDP | -10.254*** | — | I(0) | -2.777*** | — | I(0) | |
| LRGDP2 | -9.379*** | — | I(0) | -1.699** | — | I(0) | |
| LEPU | -6.976*** | — | I(0) | -5.020*** | — | I(0) | |
| LEPU + | 1.117 | -7.739*** | I(1) | 6.671 | -6.945*** | I(1) | |
| LEPU - | -11.159*** | — | I(0) | -2.011** | — | I(0) | |
注:***、**、*分别表示在1%、5%和10%的水平上显著,下同。 |
表6 非对称协整检验、长短期非对称影响检验结果Table 6 Results of asymmetric co-integration test, long-term and short-term asymmetric impact test |
| 全样本 | 东部样本 | 中西部样本 | |
|---|---|---|---|
| F统计量(P值) | 29.49*** (0.000) | 9.64** (0.022) | 27.19***(0.000) |
| WLR(P值) | 0.05 (0.828) | 5.75** (0.017) | 0.39(0.530) |
| WSR(P值) | 3.45* (0.063) | 0.19(0.661) | 6.54**(0.011) |
注:WLR为长期非对称效应检验统计量,WSR为短期非对称效应检验统计量。 |
表7 全样本LPARDL模型和NPARDL模型估计结果Table 7 Results of full-sample LPARDL model and NPARDL model |
| LPARDL模型 | NPARDL模型 | ||||
|---|---|---|---|---|---|
| 系数 | 标准差 | 系数 | 标准差 | ||
| 短期结果 | |||||
| ECTt-1 | -0.215*** | 0.048 | -0.223*** | 0.054 | |
| ΔLRGDP | -1.477 | 1.791 | -0.599 | 1.861 | |
| ΔLRGDP2 | 0.092 | 0.087 | 0.048 | 0.091 | |
| ΔLEPU | 0.013 | 0.016 | |||
| ΔLEPU + | -0.049* | 0.027 | |||
| ΔLEPU - | 0.053 | 0.033 | |||
| Constant | -1.492*** | 0.330 | -1.953*** | 0.473 | |
| 长期结果 | |||||
| LRGDP | 2.429*** | 0.577 | 2.722*** | 0.599 | |
| LRGDP2 | -0.116*** | 0.028 | -0.129*** | 0.030 | |
| LEPU | -0.069*** | 0.016 | |||
| LEPU + | -0.087*** | 0.025 | |||
| LEPU - | -0.085*** | 0.027 | |||
| AIC | -1377.685 | -1456.360 | |||
| BIC | -1345.363 | -1416.698 | |||
| Log Likelihood | 696.843 | 738.180 | |||
注:AIC和BIC是Akaike信息准则和Bayesian信息准则,下同。 |
表8 分样本LPARDL模型和NPARDL模型估计结果Table 8 Results of sub-sample LPARDL model and NPARDL model |
| 东部 | 中西部 | ||||||||||
|---|---|---|---|---|---|---|---|---|---|---|---|
| LPARDL模型 | NPARDL模型 | LPARDL模型 | NPARDL模型 | ||||||||
| 系数 | 标准差 | 系数 | 标准差 | 系数 | 标准差 | 系数 | 标准差 | ||||
| 短期结果 | |||||||||||
| ECTt-1 | -0.314*** | 0.103 | -0.206* | 0.107 | -0.278*** | 0.063 | -0.307*** | 0.071 | |||
| ΔLRGDP | 0.996 | 2.614 | 2.691 | 3.426 | -3.447** | 1.503 | -2.949 | 1.630 | |||
| ΔLRGDP2 | -0.025 | 0.123 | -0.105 | 0.163 | 0.183** | 0.077 | 0.157 | 0.084 | |||
| ΔLEPU | 0.009 | 0.019 | 0.019 | 0.022 | |||||||
| ΔLEPU + | 0.017 | 0.041 | -0.079** | 0.036 | |||||||
| ΔLEPU - | -0.021 | 0.047 | 0.097** | 0.043 | |||||||
| Constant | -4.874*** | 1.572 | -1.813** | 0.919 | -1.700*** | 0.378 | -2.218*** | 0.514 | |||
| 长期结果 | |||||||||||
| LRGDP | 3.684*** | 0.751 | 2.542*** | 0.859 | 2.300*** | 0.664 | 2.432*** | ||||
| LRGDP2 | -0.162*** | 0.035 | -0.115*** | 0.038 | -0.109*** | 0.033 | -0.114*** | 0.035 | |||
| LEPU | -0.001 | 0.014 | -0.073*** | 0.018 | |||||||
| LEPU + | 0.038 | 0.023 | -0.086*** | 0.031 | |||||||
| LEPU - | -0.045** | 0.022 | -0.080** | 0.033 | |||||||
| AIC | -560.509 | -594.818 | -807.654 | -853.769 | |||||||
| BIC | -536.214 | -565.189 | -778.986 | -818.675 | |||||||
| Log Likelihood | 288.254 | 307.409 | 411.827 | 436.885 | |||||||
表9 EPU正向冲击的中介效应模型估计结果Table 9 Estimation results of the mediation effect model for positive EPU shocks |
| 变量 | 基准回归 | 经济效应 | 政策效应 | ||||
|---|---|---|---|---|---|---|---|
| LC | LEU | LC | LER | LC | |||
| LEPU + | -0.018* | -0.011** | -0.006 | -0.045 | -0.017** | ||
| (0.009) | (0.005) | (0.006) | (0.041) | (0.009) | |||
| LEU | 1.087*** | ||||||
| (0.046) | |||||||
| LER | -0.060*** | ||||||
| (0.012) | |||||||
| Constant | -3.123** | 5.938*** | -9.577*** | -1.294 | -3.200** | ||
| (1.377) | (0.978) | (0.918) | (5.938) | (1.332) | |||
| 控制变量 | YES | YES | YES | YES | YES | ||
| 固定效应 | YES | YES | YES | YES | YES | ||
| R2 | 0.982 | 0.990 | 0.993 | 0.252 | 0.983 | ||
| Sobel检验 | Z=3.990***, p<0.01 | Z=1.211, p>0.1 | |||||
注:括号内为稳健标准误,下同。 |
表10 EPU负向冲击的中介效应模型估计结果Table 10 Estimation results of the mediation effect model for negative EPU shocks |
| 变量 | 基准回归 | 经济效应 | 政策效应 | ||||
|---|---|---|---|---|---|---|---|
| LC | LEU | LC | LER | LC | |||
| LEPU - | -0.010** | -0.008** | -0.006 | -0.063 | -0.014* | ||
| (0.005) | (0.003) | (0.006) | (0.039) | (0.008) | |||
| LEU | 1.066*** | ||||||
| (0.046) | |||||||
| LER | -0.061*** | ||||||
| (0.012) | |||||||
| Constant | -3.480*** | 5.639*** | -9.603*** | -1.761 | -3.588*** | ||
| (1.324) | (0.942) | (0.880) | (5.702) | (1.279) | |||
| 控制变量 | YES | YES | YES | YES | YES | ||
| 固定效应 | YES | YES | YES | YES | YES | ||
| R2 | 0.851 | 0.912 | 0.940 | 0.393 | 0.862 | ||
| Sobel检验 | Z=4.051***, p<0.01 | Z=1.169, p>0.1 | |||||
表11 稳健性检验结果Table 11 Results of robustness tests |
| LPARDL模型 | NPARDL模型 | ||||
|---|---|---|---|---|---|
| 系数 | 标准差 | 系数 | 标准差 | ||
| 短期结果 | |||||
| ECTt-1 | -0.167*** | 0.045 | -0.123** | 0.057 | |
| ΔLRGDP | -0.866 | 1.974 | -0.362 | 2.780 | |
| ΔLRGDP2 | 0.064 | 0.096 | 0.040 | 0.135 | |
| ΔLEPU | -0.048* | 0.026 | |||
| ΔLEPU+ | -0.045** | 0.021 | |||
| ΔLEPU- | -0.076 | 0.052 | |||
| Constant | -0.464*** | 0.124 | -0.543** | 0.228 | |
| 长期结果 | |||||
| LRGDP | 1.574*** | 0.542 | 1.885*** | 0.593 | |
| LRGDP2 | -0.072*** | 0.028 | -0.092*** | 0.032 | |
| LEPU | -0.097* | 0.057 | |||
| LEPU+ | -0.183*** | 0.060 | |||
| LEPU- | -0.364** | 0.154 | |||
| AIC | -1398.290 | -1431.001 | |||
| BIC | -1365.968 | -1391.339 | |||
| Log Likelihood | 707.145 | 725.500 | |||
| [1] |
张喜艳, 刘莹. 经济政策不确定性与消费升级[J]. 经济学家, 2020, (11): 82-92.
[
|
| [2] |
董莉. 经济政策不确定性、管理者自信与企业投资效率[J]. 统计与决策, 2021, 37(10): 165-169.
[
|
| [3] |
谭小芬, 张文婧. 经济政策不确定性影响企业投资的渠道分析[J]. 世界经济, 2017, 40(12): 3-26.
[
|
| [4] |
|
| [5] |
单东方. 经济政策不确定性对FDI影响研究[J]. 经济问题, 2020, (3): 42-49.
[
|
| [6] |
刘强, 陶士贵. 经济政策不确定性对人民币汇率的影响研究: 基于面板分位数模型的实证分析[J]. 华东经济管理, 2021, 35(2): 87-96.
[
|
| [7] |
|
| [8] |
姜伟, 徐放, 刘晓君. 经济政策不确定性、货币政策与经济增长[J]. 西安财经大学学报, 2021, 34(4): 40-53.
[
|
| [9] |
郑忠华, 李清彬. 从乐观预期到审慎预期: 基于经济政策不确定性对中国经济冲击的视角[J]. 宏观经济研究, 2020, (3): 5-18.
[
|
| [10] |
顾夏铭, 陈勇民, 潘士远. 经济政策不确定性与创新: 基于我国上市公司的实证分析[J]. 经济研究, 2018, 53(2): 109-123.
[
|
| [11] |
|
| [12] |
|
| [13] |
|
| [14] |
|
| [15] |
|
| [16] |
赵娜娜, 王志宝, 李鸿梅. 中国能耗模式演变及其对经济发展的影响[J]. 资源科学, 2021, 43(1): 122-133.
[
|
| [17] |
王悦, 李锋, 孙晓. 城市家庭消费碳排放研究进展[J]. 资源科学, 2019, 41(7): 1201-1212.
[
|
| [18] |
刘贯春, 段玉柱, 刘媛媛. 经济政策不确定性、资产可逆性与固定资产投资[J]. 经济研究, 2019, 54(8): 53-70.
[
|
| [19] |
王霞, 张丽君, 秦耀辰, 等. 中国高碳制造业碳排放时空演变及其驱动因素[J]. 资源科学, 2020, 42(2): 323-333.
[
|
| [20] |
徐博, 杨来科, 钱志权. 全球价值链分工地位对于碳排放水平的影响[J]. 资源科学, 2020, 42(3): 527-535.
[
|
| [21] |
|
| [22] |
|
| [23] |
|
| [24] |
|
| [25] |
|
| [26] |
|
| [27] |
蔡海静, 章慧敏, 吴扬帆. 经济政策不确定性对环保投资的影响研究[J]. 会计之友, 2020, (24): 112-117.
[
|
| [28] |
陈理, 黄珺, 曹丰, 等. 高管持股、经济政策不确定性与企业绿色投资[J]. 财经理论与实践, 2021, 42(3): 58-64.
[
|
| [29] |
|
| [30] |
|
| [31] |
|
| [32] |
|
| [33] |
|
| [34] |
张志新, 黄海蓉, 林立. 贸易开放、经济增长与碳排放关系分析: 基于“一带一路”沿线国家的实证研究[J]. 软科学, 2021, 35 (10): 44-48.
[
|
| [35] |
|
| [36] |
温忠麟, 张雷, 侯杰泰, 等. 中介效应检验程序及其应用[J]. 心理学报, 2004, (5): 614-620.
[
|
| [37] |
许涤龙, 沈春华. 国际金融危机对我国经济增长影响的时滞效应测度[J]. 统计研究, 2014, 31(7): 105-106.
[
|
| [38] |
干春晖, 郑若谷, 余典范. 中国产业结构变迁对经济增长和波动的影响[J]. 经济研究, 2011, 46(5): 4-16.
[
|
| [39] |
李成, 于海东. 经济政策不确定性对居民消费的影响效应及作用机制: 基于中国家庭调查(CFPS)数据[J]. 广东财经大学学报, 2021, 36(6): 31-50.
[
|
| [40] |
黄虹, 卢佳豪, 黄静. 经济政策不确定性对企业投资的影响: 基于投资者情绪的中介效应[J]. 中国软科学, 2021, (4): 120-128.
[
|
| [41] |
余粮红, 高堃, 高强. 环境规制对海水养殖绿色水平的影响及机制[J]. 资源科学, 2022, 44(1): 1-14.
[
|
/
| 〈 |
|
〉 |