
环境政策对畜禽养殖污染排放的影响及机制
|
刘丽,女,山东临沂人,助理研究员,研究方向为农业资源环境经济与政策。E-mail: liuli06@caas.cn |
收稿日期: 2021-10-25
修回日期: 2022-01-17
网络出版日期: 2022-07-25
基金资助
中央级公益性科研院所基本科研业务费专项资助项目(161005202110)
Impact and mechanism of environmental policies on pollution emissions from livestock and poultry breeding
Received date: 2021-10-25
Revised date: 2022-01-17
Online published: 2022-07-25
准确评估环境政策对畜禽养殖污染排放的影响,探寻政策影响机理是科学制定畜禽养殖环境政策的重要依据。为此,本文基于2006—2018年省级面板数据,运用双重差分和中介效应模型分析了环境政策对中国畜禽养殖污染排放的影响及机制。结果表明:①自2014年以来实施的一系列环境政策有助于减少畜禽养殖污染排放;②一系列环境政策对畜禽养殖污染排放的削弱作用存在主体异质性和地区异质性,环境政策在初始污染水平较高的省份、畜牧大省以及东部省份的影响效应较为明显,在初始污染水平较低的省份、非畜牧大省以及中西部省份的影响效应不明显;③环境政策实施使得养殖总体规模下降、规模化程度提升以及养殖结构调整,进而减少畜禽养殖污染排放,而环境政策虽然能够促进农业技术进步,但难以进一步起到减少养殖污染排放的作用。据此提出要提高中国畜禽养殖环境政策的政策效率,需要进一步以差异化政策促进区域畜禽养殖污染的协调防治,挖掘规模化养殖、技术进步在污染防治中的作用,此外要高度重视生猪养殖污染防治问题。本文不仅为畜禽养殖环境政策优化调整提供定量化参考,还为推进适度规模化养殖提供一定的理论和实证依据。
刘丽 , 孙炜琳 , 姜茜 , 黄圣男 . 环境政策对畜禽养殖污染排放的影响及机制[J]. 资源科学, 2022 , 44(5) : 1051 -1065 . DOI: 10.18402/resci.2022.05.14
Accurately evaluating the impact of environmental policies on pollution emissions and exploring the policy impact mechanism are an important basis for formulating environmental policies for livestock and poultry breeding. Based on the provincial panel data from 2006 to 2018, this study analyzed the impact of environmental policies on pollution emissions from livestock and poultry breeding in China and its mechanism by applying the difference-in-differences and mediation effect methods. The results show that: (1) A series of environmental policies implemented since 2014 helped to reduce pollution emissions from livestock and poultry breeding. (2) There exist agent heterogeneity and regional heterogeneity in the reduction effects of the environmental policies on pollution emissions. The effect of environmental policies is more obvious in the provinces with higher initial pollution level, higher livestock production value, and in the eastern provinces, but not in the provinces with lower initial pollution level, lower livestock production value, and in the central and western provinces. (3) The implementation of environmental policies can reduce the overall scale of breeding, increase the degree of scaling-up production, and adjust the breeding structure, thereby reducing pollution emissions from livestock and poultry breeding. Although environmental policies can promote the progress of agricultural technology, it is difficult to further reduce the emissions of livestock and poultry breeding pollution. Therefore, in order to improve the policy efficiency, the government should further promote the coordinated prevention and control of regional livestock and poultry pollution through differentiated policies, explore the advantages of large-scale breeding and technological progress, and attach great importance to the pollution prevention and control of pig breeding. This study provides not only a quantitative reference for the optimization and adjustment of environmental policies for livestock and poultry breeding, but also certain theoretical and empirical basis for promoting moderate scale breeding.
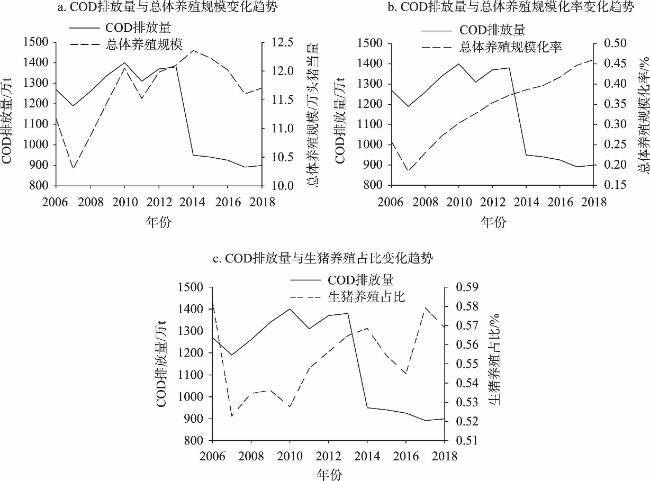
图1 2006—2018年中国畜禽养殖化学需氧量(COD)排放量与总体养殖规模、规模化率及生猪养殖占比的变化趋势注:化学需氧量(COD)排放量根据《第一次全国污染源普查数据集》和各省份公布的《第二次全国污染源普查公报》核算得到。 Figure 1 Changes in COD emissions from livestock and poultry breeding in China from 2006 to 2018 and the overall breeding scale, scaling-up rate, and proportion of pig breeding |
表1 变量的定义与描述统计Table 1 Variable definition and descriptive statistics |
| 变量名 | 变量代码 | 单位 | 均值 | 标准差 | 最小值 | 最大值 |
|---|---|---|---|---|---|---|
| 总体污染排放强度 | — | 0.231 | 0.460 | 0.000 | 2.764 | |
| 人均地区生产总值 | 万元/人 | 32904 | 22634 | 4679 | 116092 | |
| 城镇化率 | % | 0.511 | 0.189 | 0.013 | 0.929 | |
| 人均耕地面积 | 亩/人 | 1.715 | 1.375 | 0.116 | 6.299 | |
| 农业劳动力数量 | 万人 | 1006.000 | 656.100 | 36.300 | 3050.000 | |
| 平均受教育年限 | 年 | 7.519 | 0.592 | 5.477 | 8.807 | |
| 交通通达性 | km/km2 | 0.940 | 0.552 | 0.069 | 2.841 | |
| 工资性收入占比 | % | 0.387 | 0.133 | 0.093 | 0.776 | |
| 种植业结构 | % | 0.647 | 0.133 | 0.328 | 0.969 | |
| 总体养殖规模 | 猪当量 | 4312 | 2983 | 222.100 | 12163 | |
| 总体养殖规模化率 | % | 0.350 | 0.187 | 0.034 | 0.986 | |
| 农业技术进步 | — | 0.980 | 0.112 | 0.761 | 1.398 | |
| 养殖结构 | % | 0.552 | 0.202 | 0.064 | 0.853 |
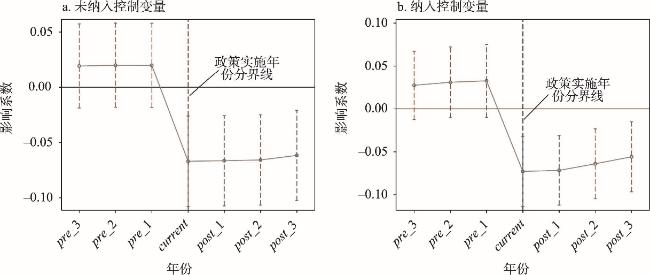
表2 平行趋势分析结果Table 2 Results of parallel trend analysis |
| (1) | (2) | |
|---|---|---|
| 未纳入控制变量 | 纳入控制变量 | |
| 0.019 | 0.027 | |
| (0.019) | (0.020) | |
| 0.020 | 0.031 | |
| (0.019) | (0.021) | |
| 0.020 | 0.033 | |
| (0.019) | (0.022) | |
| -0.067*** | -0.073*** | |
| (0.021) | (0.021) | |
| -0.066*** | -0.072*** | |
| (0.021) | (0.021) | |
| -0.066*** | -0.064*** | |
| (0.021) | (0.021) | |
| -0.062*** | -0.056*** | |
| (0.021) | (0.021) | |
| 0.174*** | 0.999* | |
| (0.005) | (0.573) | |
| 未纳入 | 纳入 | |
| Observations | 702 | 702 |
| R-squared | 0.13 | 0.76 |
注:括号内为系数的聚类稳健标准误,***、**和*分别代表在1%、5%和10%的水平上显著。下同。 |
表3 政策影响模型估计结果Table 3 Estimated results of the policy impact model |
| 变量 | (1) | (2) | (3) | (4) | (5) | (6) |
|---|---|---|---|---|---|---|
| Pooled OLS | RE | FE | ||||
| -0.083* | -0.085* | -0.087*** | -0.149*** | -0.369*** | -0.148*** | |
| (0.044) | (0.044) | (0.012) | (0.045) | (0.046) | (0.042) | |
| -0.073*** | -0.070** | -0.072* | -0.151 | -0.560*** | -0.307** | |
| (0.025) | (0.028) | (0.037) | (0.137) | (0.139) | (0.127) | |
| 0.458*** | 0.214 | 0.083 | -0.734 | 2.323*** | 0.490 | |
| (0.159) | (0.136) | (0.176) | (0.652) | (0.663) | (0.605) | |
| -0.150*** | -0.007 | -0.011 | 0.543*** | 0.322 | 0.499*** | |
| (0.056) | (0.043) | (0.055) | (0.202) | (0.205) | (0.187) | |
| 0.148*** | 0.089*** | 0.027 | 0.424** | 0.227 | 0.436** | |
| (0.030) | (0.024) | (0.050) | (0.186) | (0.189) | (0.172) | |
| 0.038 | 0.064** | 0.052** | 0.072 | 0.167** | 0.116 | |
| (0.041) | (0.026) | (0.022) | (0.080) | (0.081) | (0.074) | |
| 0.032 | 0.096** | 0.162** | 1.359*** | 0.995*** | 1.242*** | |
| (0.052) | (0.045) | (0.069) | (0.257) | (0.262) | (0.239) | |
| -0.560*** | -0.106 | -0.062 | -1.389*** | -0.997*** | -1.383*** | |
| (0.199) | (0.112) | (0.089) | (0.331) | (0.336) | (0.307) | |
| 0.294* | -0.147 | -0.178 | -0.721 | 1.789*** | -0.957** | |
| (0.148) | (0.284) | (0.125) | (0.463) | (0.470) | (0.429) | |
| -0.493 | -0.120 | 0.493 | 12.270*** | 9.342*** | 8.502*** | |
| (0.350) | (0.358) | (0.528) | (1.957) | (1.990) | (1.817) | |
| Observations | 702 | 702 | 702 | 702 | 702 | 702 |
| R-squared | 0.390 | 0.374 | 0.227 | 0.435 | 0.320 | 0.569 |
| Wald test | F=49.14 Prob > F = 0.000 | |||||
| LM test | =2440.48 Prob > = 0.000 | |||||
| Hausman test | =17.22 Prob > = 0.029 | |||||
表4 稳健性检验Table 4 Robustness test |
| (1) | (2) | (3) | (4) | |
|---|---|---|---|---|
| 2011年为政策实施时点 | 2010年为政策实施时点 | 聚类稳健标准误 | Bootstrap法的标准误 | |
| -0.063 | -0.056 | -0.087*** | -0.087*** | |
| (0.083) | (0.074) | (0.012) | (0.017) | |
| 纳入 | 纳入 | 纳入 | 纳入 | |
| -0.299 | -0.299 | 0.493 | 0.493 | |
| (0.773) | (0.773) | (0.528) | (0.427) | |
| Observations | 702 | 702 | 702 | 702 |
| R-squared | 0.462 | 0.462 | 0.128 | 0.128 |
注:列(1)、(2)括号内为系数的聚类稳健标准误,列(3)、(4)括号内为标题所示标准误,其中Bootstrap自助法是随机抽样1000次。 |
表5 异质性分析:污染水平Table 5 Heterogeneity analysis: Pollution level |
| (1) | (2) | (3) | (4) | (5) | |
|---|---|---|---|---|---|
| 0.0~0.2分位点 | 0.3~0.4分位点 | 0.5~0.6分位点 | 0.7~0.8分位点 | 0.9~1.0分位点 | |
| -0.002 | -0.005 | -0.005 | -0.044*** | -0.360*** | |
| (0.003) | (0.008) | (0.022) | (0.013) | (0.079) | |
| 纳入 | 纳入 | 纳入 | 纳入 | 纳入 | |
| 0.088 | 0.024 | -1.269 | 0.836*** | 2.911 | |
| (0.071) | (0.152) | (0.773) | (0.172) | (1.713) | |
| Observations | 130 | 135 | 151 | 135 | 151 |
| R-squared | 0.441 | 0.274 | 0.176 | 0.677 | 0.732 |
表6 异质性分析:畜牧产值与区域差异Table 6 Heterogeneity analysis: Livestock production value and regional differences |
| (1) | (2) | (3) | (4) | (5) | |
|---|---|---|---|---|---|
| 非畜牧大省 | 畜牧大省 | 东部 | 中部 | 西部 | |
| -0.020 | -0.202* | -0.194* | -0.051 | -0.015 | |
| (0.029) | (0.105) | (0.107) | (0.068) | (0.013) | |
| 纳入 | 纳入 | 纳入 | 纳入 | 纳入 | |
| -0.282 | 1.517 | 1.013 | 2.566** | -0.308 | |
| (0.521) | (1.155) | (1.616) | (1.108) | (0.357) | |
| Observations | 442 | 260 | 234 | 208 | 260 |
| R-squared | 0.168 | 0.266 | 0.287 | 0.213 | 0.208 |
表7 影响机制估计结果Table 7 Estimation of the impact mechanism |
| 变量 | 规模机制 | 技术进步机制 | 结构机制 | ||||||
|---|---|---|---|---|---|---|---|---|---|
| 总体养殖规模化率 | 总体养殖规模 | 技术进步指数 | 生猪养殖占比 | ||||||
| (1) | (2) | (3) | (4) | (5) | (6) | (7) | (8) | ||
| 0.028*** | -0.086*** | -0.021* | -0.084*** | 0.061*** | -0.087*** | 0.005 | -0.086*** | ||
| (0.008) | (0.012) | (0.013) | (0.012) | (0.015) | (0.012) | (0.005) | (0.012) | ||
| -0.022 | |||||||||
| (0.061) | |||||||||
| 0.106*** | |||||||||
| (0.038) | |||||||||
| 0.004 | |||||||||
| (0.032) | |||||||||
| -0.340* | |||||||||
| (0.085) | |||||||||
| 纳入 | 纳入 | 纳入 | 纳入 | 纳入 | 纳入 | 纳入 | 纳入 | ||
| -1.771*** | 0.384 | 5.755*** | -0.171 | 1.631*** | 0.427 | -0.368* | 0.168 | ||
| (0.179) | (0.546) | (0.541) | (0.565) | (0.654) | (0.526) | (0.215) | (0.288) | ||
| Observations | 702 | 702 | 702 | 702 | 702 | 702 | 702 | 702 | |
| R-squared | 0.623 | 0.114 | 0.274 | 0.124 | 0.161 | 0.114 | 0.171 | 0.524 | |
| Sobel检验 | |||||||||
| Bootstrap置信区间 | [0.003,0.017] | [0.024,0.090] | [-0.006,0.004] | [-0.136,-0.073] | |||||
| [1] |
王明利. 改革开放四十年我国畜牧业发展: 成就、经验及未来趋势[J]. 农业经济问题, 2018, (8): 60-70.
[
|
| [2] |
张园园, 吴强, 孙世民. 生猪养殖规模化程度的影响因素及其空间效应: 基于13个生猪养殖优势省份的研究[J]. 中国农村经济, 2019, (1): 62-78.
[
|
| [3] |
|
| [4] |
张诩, 乔娟, 沈鑫琪. 养殖废弃物治理经济绩效及其影响因素: 基于北京市养殖场(户)视角[J]. 资源科学, 2019, 41(7): 1250-1261.
[
|
| [5] |
石晓晓, 郑国砥, 高定, 等. 中国畜禽粪便养分资源总量及替代化肥潜力[J]. 资源科学, 2021, 43(2): 403-411.
[
|
| [6] |
胡钰, 林煜, 金书秦. 农业面源污染形势和“十四五”政策取向: 基于两次全国污染源普查公报的比较分析[J]. 环境保护, 2021, 49(1): 31-36.
[
|
| [7] |
周晶, 陈玉萍, 丁士军. “一揽子”补贴政策对中国生猪养殖规模化进程的影响: 基于双重差分方法的估计[J]. 中国农村经济, 2015, (4): 29-43.
[
|
| [8] |
金书秦, 韩冬梅, 吴娜伟. 中国畜禽养殖污染防治政策评估[J]. 农业经济问题, 2018, (3): 119-126.
[
|
| [9] |
孔凡斌, 张维平, 潘丹. 农户畜禽养殖污染无害化处理意愿与行为一致性分析: 以5省754户生猪养殖户为例[J]. 现代经济探讨, 2018, (4): 125-132.
[
|
| [10] |
司瑞石, 陆迁, 张强强, 等. 病死畜禽废弃物资源化利用研究: 基于中外立法脉络的视角[J]. 资源科学, 2018, 40(12): 2392-2400.
[
|
| [11] |
于婷, 于法稳. 环境规制政策情境下畜禽养殖废弃物资源化利用认知对养殖户参与意愿的影响分析[J]. 中国农村经济, 2019, (8): 91-108.
[
|
| [12] |
张晓岚, 吕文魁, 杨倩, 等. 荷兰畜禽养殖污染防治监管经验及启发[J]. 环境保护, 2014, 42(15): 71-73.
[
|
| [13] |
|
| [14] |
司瑞石, 陆迁, 张淑霞, 等. 畜禽禁养政策对替代生计策略与养殖户收入的影响[J]. 资源科学, 2019, 41(4): 643-654.
[
|
| [15] |
杨皓天, 马骥. 环境规制下养殖户的环境投入行为研究: 基于双栏模型的实证分析[J]. 中国农业资源与区划, 2020, 41(3): 94-102.
[
|
| [16] |
李晗, 赵敏娟, 陆迁. 畜禽禁养区政策降低了中国生猪产能吗? 基于县域面板数据的实证分析[J]. 农业经济问题, 2021, (8): 12-27.
[
|
| [17] |
谭莹, 胡洪涛. 环境规制、 生猪生产与区域转移效应[J]. 农业技术经济, 2021, (1): 93-104.
[
|
| [18] |
石华平, 易敏利. 环境规制、 非农兼业与农业面源污染: 以化肥施用为例[J]. 农村经济, 2020, (7): 127-136.
[
|
| [19] |
张利庠, 罗千峰, 韩磊. 构建中国生猪产业可持续发展的长效机制研究[J]. 农业经济问题, 2020, (12): 50-60.
[
|
| [20] |
唐莉, 王明利. 中国生猪产业发展、政策评价与现实约束: 基于政策与环境视角[J]. 世界农业, 2020, (11): 112-124.
[
|
| [21] |
|
| [22] |
张娟, 耿弘, 徐功文, 等. 环境规制对绿色技术创新的影响研究[J]. 中国人口·资源与环境, 2019, 29(1): 168-176.
[
|
| [23] |
郭进. 环境规制对绿色技术创新的影响: “波特效应”的中国证据[J]. 财贸经济, 2019, 40(3): 147-160.
[
|
| [24] |
|
| [25] |
杜晓丹, 朱晓春, 贾向春, 等. 规模化畜禽养殖废弃物资源化利用标准研究[J]. 中国标准化, 2021, (9): 218-221.
[
|
| [26] |
姚利, 郭洪海, 付龙云, 等. 山东省大中型沼气工程运行状况及对策建议[J]. 中国沼气, 2016, 34(5): 78-81.
[
|
| [27] |
|
| [28] |
刘晨峰, 赵兴征, 汪志锋, 等. 农业污染源氮磷排放特征与“十四五”时期的对策建议[J]. 环境保护, 2020, 48(18): 28-33.
[
|
| [29] |
周黎安, 陈烨. 中国农村税费改革的政策效果: 基于双重差分模型的估计[J]. 经济研究, 2005, (8): 44-53.
[
|
| [30] |
|
| [31] |
汪克亮, 庞素勤. “一带一路”倡议实施对中国沿线城市绿色转型的影响[J]. 资源科学, 2021, 43(12): 2475-2489.
[
|
| [32] |
周迪, 周丰年, 王雪芹. 低碳试点政策对城市碳排放绩效的影响评估及机制分析[J]. 资源科学, 2019, 41(3): 546-556.
[
|
| [33] |
高延雷, 张正岩, 魏素豪, 等. 城镇化对中国粮食安全的影响: 基于省区面板数据的实证分析[J]. 资源科学, 2019, 41(8): 1462-1474.
[
|
| [34] |
李煜阳, 陆迁, 贾彬, 等. 劳动力外出务工对农户水土保持技术采用的影响: 基于集体行动参与的中介效应[J]. 资源科学, 2021, 43(6): 1088-1098.
[
|
| [35] |
|
| [36] |
梁志会, 张露, 张俊飚. 土地整治与化肥减量: 来自中国高标准基本农田建设政策的准自然实验证据[J]. 中国农村经济, 2021, (4): 123-144.
[
|
| [37] |
温忠麟, 叶宝娟. 中介效应分析: 方法和模型发展[J]. 心理科学进展, 2014, 22(5): 731-745.
[
|
| [38] |
|
| [39] |
|
| [40] |
|
| [41] |
胡祎, 张正河. 农机服务对小麦生产技术效率有影响吗?[J]. 中国农村经济, 2018, (5): 68-83.
[
|
| [42] |
李雪松, 孙博文. 密度、 距离、分割与区域市场一体化: 来自长江经济带的实证[J]. 宏观经济研究, 2015, (6): 117-128.
[
|
| [43] |
马九杰, 杨晨, 崔恒瑜, 等. 农业保险的环境效应及影响机制: 从中国化肥面源污染视角的考察[J]. 保险研究, 2021, (9): 46-61.
[
|
| [44] |
崔姹, 王明利, 石自忠. 基于温室气体排放约束下的我国草食畜牧业全要素生产率分析[J]. 农业技术经济, 2018, (3): 66-78.
[
|
/
| 〈 |
|
〉 |