
广东省耕地非粮化的时空分异及其驱动机制
|
张颖诗,女,广东广州人,硕士研究生,从事乡村地理与土地资源利用研究。E-mail: yig2112@163.com |
收稿日期: 2021-07-30
修回日期: 2021-11-14
网络出版日期: 2022-05-25
基金资助
国家自然科学基金项目(42071262)
广州市哲学社会科学发展“十三五”规划项目(2020GZYB90)
广州大学科研立项项目(YK2020016)
Spatiotemporal differentiation and driving mechanism of cultivated land non-grain conversion in Guangdong Province
Received date: 2021-07-30
Revised date: 2021-11-14
Online published: 2022-05-25
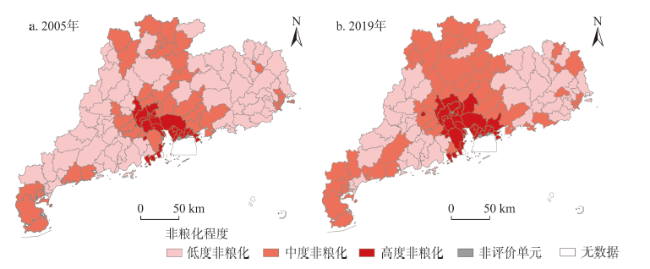
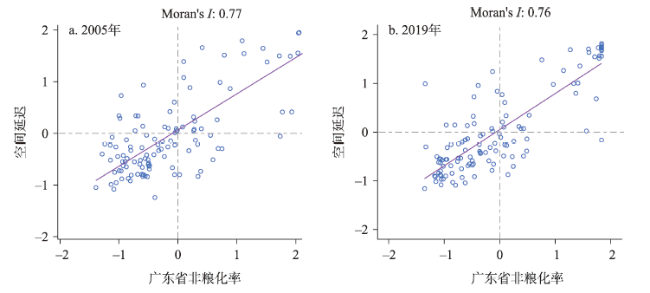
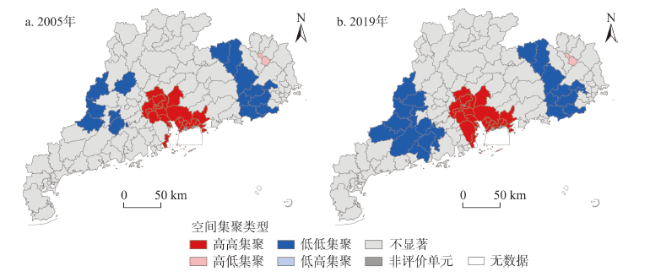
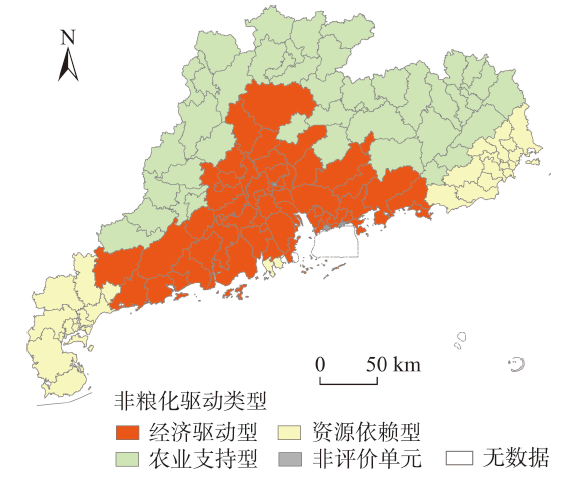
粮食安全是保障国家经济发展和社会稳定的基石,日益严峻的耕地非粮化问题加剧了粮食安全风险,直接影响中国社会经济的可持续发展。本文从食物性生产的非粮化角度,选取广东省为研究区域,以县域为评价单元,运用社会经济统计数据及地理空间数据,集成Theil指数、空间自相关模型、随机森林模型、主成分分析和聚类分析等方法,从全省四大区域角度探讨了广东省2005和2019年耕地非粮化的时空演变特征、影响因素及其驱动类型。结果表明:①广东省耕地非粮化率由2005年的48.47%上升至2019年的54.65%,耕地非粮化程度由低度为主转向中度为主,且耕地非粮化利用空间差异呈现缩小态势,以珠三角的演变差异最为显著。②耕地非粮化的空间分布保持稳定的集聚状态,并以珠三角的高高集聚和东翼、西翼、山区的低低集聚为主。③路网密度、地均GDP对耕地非粮化存在显著的推动作用,农村第一产业劳动力占比、各县到省会城市距离是抑制耕地非粮化的重要因素。④耕地非粮化驱动类型以经济驱动型为主(44.63%),主要分布在珠三角;其次是农业支持型(33.06%),大多分布在山区;资源依赖型占比最少(22.31%),集聚在东、西两翼。研究结果有利于精准识别广东省耕地非粮化的时空特征,提升当地耕地非粮化的风险管控水平,对于农业可持续发展以及保证地区的粮食安全具有重要的理论与现实意义。
张颖诗 , 冯艳芬 , 王芳 , 陈子龙 , 李晓航 . 广东省耕地非粮化的时空分异及其驱动机制[J]. 资源科学, 2022 , 44(3) : 480 -493 . DOI: 10.18402/resci.2022.03.05
Food security is the cornerstone of national economic development and social stability. The increasingly serious problem of cultivated land non-grain conversion intensifies the risk of food insecurity and directly affects the sustainable development of China's social and economic systems. From the perspective of non-grain production of food, this study selected Guangdong Province as the research area and county as the evaluation unit and based on socioeconomic statistics and geospatial data, using Theil index, spatial autocorrelation model, random forest model, principal component analysis, and cluster analysis to examine the spatiotemporal characteristics, influencing factors, and driving types of cultivated land non-grain conversion in 2005 and 2019. The results show that: (1) The non-grain rate of cultivated land in Guangdong Province increased from 48.47% in 2005 to 54.65% in 2019. The non-grain degree of cultivated land had changed from low to moderate, and the spatial differentiation of non-grain rate of cultivated land showed a decreasing trend, especially in the Pearl River Delta area. (2) The spatial distribution of non-grain cultivated land maintained a stable agglomeration state and showed high concentration in the Pearl River Delta area and low concentration in the east wing, west wing, and mountainous sub-regions of the province. (3) Road network density and GDP per square kilometer had significant promoting effects on cultivated land non-grain conversion, while the proportion of labor force in rural primary industry and distance between counties and provincial capital cities were important factors to restrain the cultivated land non-grain conversion. (4) The main driving type of cultivated land non-grain conversion was economy driven (44.63%), mainly distributed in the Pearl River Delta area. This was followed by agriculture supporting type (33.06%), mostly distributed in the mountainous areas. The resource dependency type was the least dominant (22.31%) and was concentrated in the east and west wing sub-regions. This research result is conducive to accurately identify the spatiotemporal characteristics of cultivated land non-grain conversion in Guangdong Province, improve the risk control level of local cultivated land non-grain conversion, and has important theoretical and practical significance for sustainable agricultural development and ensuring regional food security.
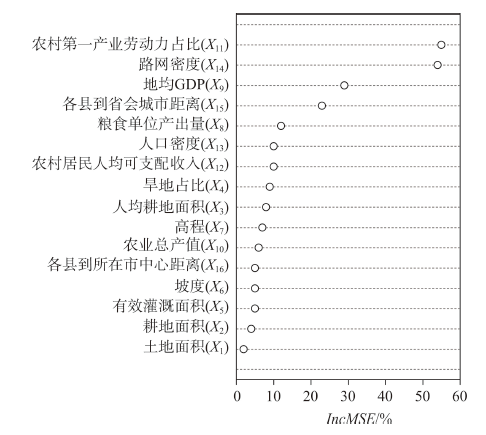
表1 广东省耕地非粮化的影响因素选择Table 1 Influencing factors of cultivated land non-grain conversion in Guangdong Province |
| 影响因子 | 指标释义 | 性质 |
|---|---|---|
| 土地面积(X1) | 研究区的土地总面积/km²,反映研究区的土地资源总量 | - |
| 耕地面积(X2) | 研究区的耕地总面积/hm²,反映耕地资源的丰缺程度 | - |
| 人均耕地面积(X3) | 耕地总面积与总人口之比/(亩/人),反映人均耕地资源的稀缺程度 | - |
| 旱地占比(X4) | 旱地面积占耕地总面积比例/%,反映耕地内部利用结构 | + |
| 有效灌溉面积(X5) | 在一般年景下当年能够进行正常灌溉的耕地面积/hm²,反映耕地抗旱能力,揭示耕地水源保证条件 | - |
| 坡度(X6) | 县域平均坡度/°,反映研究区地形的平均陡缓程度和耕作条件,利用DEM数据计算 | - |
| 高程(X7) | 县域平均海拔/m,反映研究区的海拔特征,利用DEM数据计算 | - |
| 粮食单位产出量(X8) | 耕地全年所生产的粮食总量与耕地总面积之比/(t/hm2),反映耕地单位生产能力 | + |
| 地均GDP(X9) | GDP与土地总面积之比/(亿元/km2),反映土地生产效益 | + |
| 农业总产值(X10) | 农、林、牧、渔业全部产品的总量/万元,反映农业生产总规模 | - |
| 农村第一产业劳动力占比(X11) | 乡村第一产业从业人数占总从业人数比例/%,反映乡村劳动力结构 | - |
| 农村居民人均可支配收入(X12) | 农村居民可用于自由支配的收入,包括消费支出和储蓄/元 | - |
| 人口密度(X13) | 人口总量与土地总面积之比(人/km²),反映人口密集程度 | + |
| 路网密度(X14) | 研究区内所有道路的总长度与区域总面积之比/(km/km²),反映交通便捷程度 | + |
| 各县到省会城市距离(X15) | 各县的几何中心到广州市越秀区几何中心的距离/km,反映省会城市的吸引能力 | - |
| 各县到所在市中心距离(X16) | 各县的几何中心到所在市中心城区几何中心的距离/km,反映研究区与所在市的连接程度 | - |
表2 2005年和2019年广东省非粮化率的基本情况 (%)Table 2 Basic situation of cultivated land non-grain rate in Guangdong Province, 2005 and 2019 (%) |
| 区域 | 最大值 | 最小值 | 平均值 | |||||
|---|---|---|---|---|---|---|---|---|
| 2005年 | 2019年 | 2005年 | 2019年 | 2005年 | 2019年 | |||
| 珠三角 | 100.00 | 100.00 | 20.56 | 21.42 | 65.43 | 73.54 | ||
| 东翼 | 65.14 | 65.23 | 17.13 | 25.96 | 35.49 | 39.05 | ||
| 西翼 | 66.70 | 67.79 | 22.83 | 28.21 | 41.64 | 45.68 | ||
| 山区 | 61.99 | 65.29 | 14.56 | 21.16 | 36.47 | 43.02 | ||
| 广东省 | 100.00 | 100.00 | 14.56 | 21.16 | 48.47 | 54.65 | ||
表3 2005年和2019年广东省耕地非粮化的Theil指数Table 3 Theil index of cultivated land non-grain conversion in Guangdong Province, 2005 and 2019 |
| 珠三角 | 东翼 | 西翼 | 山区 | 区域内 | 区域间 | 全省 | |
|---|---|---|---|---|---|---|---|
| 2005年 | 0.0286 | 0.0080 | 0.0050 | 0.0136 | 0.0552 | 0.0395 | 0.0947 |
| 2019年 | 0.0164 | 0.0041 | 0.0041 | 0.0105 | 0.0351 | 0.0376 | 0.0727 |
表4 主成分的特征值与贡献率Table 4 Eigenvalues and contribution rate of principal components |
| 主成分 | 特征值 | 贡献率/% | 累计贡献率/% |
|---|---|---|---|
| 1 | 3.85 | 24.06 | 24.06 |
| 2 | 3.62 | 22.60 | 46.66 |
| 3 | 3.51 | 21.92 | 68.58 |
| 4 | 1.42 | 8.89 | 77.47 |
表5 旋转成分矩阵Table 5 Rotating component matrix |
| 影响因子 | 第1主成分 | 第2主成分 | 第3主成分 | 第4主成分 |
|---|---|---|---|---|
| 土地面积(X1) | 0.739 | 0.234 | 0.475 | -0.099 |
| 耕地面积(X2) | 0.922 | 0.072 | 0.098 | 0.237 |
| 人均耕地面积(X3) | 0.425 | 0.073 | 0.636 | 0.310 |
| 旱地占比(X4) | -0.059 | 0.158 | 0.711 | 0.030 |
| 有效灌溉面积(X5) | 0.908 | 0.238 | 0.055 | 0.069 |
| 坡度(X6) | 0.017 | -0.147 | -0.877 | 0.218 |
| 高程(X7) | -0.020 | -0.176 | -0.901 | -0.124 |
| 粮食单位产出量(X8) | -0.210 | 0.150 | 0.624 | -0.106 |
| 地均GDP(X9) | 0.212 | 0.865 | 0.121 | 0.222 |
| 农业总产值(X10) | 0.868 | 0.216 | -0.187 | 0.015 |
| 农村第一产业劳动力占比(X11) | 0.408 | 0.407 | 0.498 | 0.351 |
| 农村居民人均可支配收入(X12) | 0.285 | 0.644 | -0.118 | -0.385 |
| 人口密度(X13) | 0.278 | 0.832 | 0.267 | 0.147 |
| 路网密度(X14) | 0.312 | 0.822 | 0.330 | 0.269 |
| 各县到省会城市距离(X15) | 0.140 | 0.236 | -0.062 | 0.863 |
| 各县到所在市中心距离(X16) | 0.400 | 0.079 | 0.142 | 0.694 |
图7 2019年广东省耕地非粮化驱动类型的空间分布注:基于自然资源部标准地图服务网站粤S(2019)068号的标准地图制作,底图边界无修改。 Figure 7 Spatial distribution of driving types of cultivated land non-grain conversion in Guangdong Province, 2019 |
表6 2019年广东省耕地非粮化的不同驱动类型指标均值Table 6 Average indicator values of different driving types of cultivated land non-grain conversion in Guangdong Province, 2019 |
| 要素 | 指标 | 经济驱动型 | 资源依赖型 | 农业支持型 |
|---|---|---|---|---|
| 非粮化程度 | 非粮化率/% | 66.66 | 46.87 | 43.69 |
| 低度占比/% | 22.22 | 33.33 | 52.50 | |
| 中度占比/% | 33.33 | 62.96 | 40.00 | |
| 高度占比/% | 44.45 | 3.71 | 7.50 | |
| 耕地资源 | 耕地面积占比/% | 10.00 | 19.24 | 11.03 |
| 水田占比/% | 57.50 | 61.03 | 69.24 | |
| 社会经济 | 地均GDP/(亿元/km²) | 4.32 | 1.04 | 0.13 |
| 乡村第一产业劳动力占比/% | 25.87 | 41.66 | 53.08 | |
| 交通区位 | 路网密度/(km/km²) | 2.65 | 1.26 | 0.39 |
| 各县到省会城市距离/km | 110.26 | 367.74 | 225.48 |
| [1] |
刘正佳, 钟会民, 李裕瑞, 等. 近20年中国粮食生产变化特征及其对区域粮食供需格局的影响[J]. 自然资源学报, 2021, 36(6): 1413-1425.
[
|
| [2] |
|
| [3] |
|
| [4] |
|
| [5] |
孔祥斌. 耕地“非粮化”问题、成因及对策[J]. 中国土地, 2020, (11): 17-19.
[
|
| [6] |
朱道林. 耕地“非粮化”的经济机制与治理路径[J]. 中国土地, 2021, (7): 9-11.
[
|
| [7] |
|
| [8] |
郝士横, 吴克宁, 董秀茹, 等. 耕地“非粮化”耕作层破坏诊断标准探讨[J]. 土壤通报, 2021, 52(5): 1028-1033.
[
|
| [9] |
赵小风, 李娅娅, 郑雨倩, 等. 产业结构、农民收入结构对耕地非粮化的影响[J]. 国土资源科技管理, 2019, 36(5): 66-77.
[
|
| [10] |
关小克, 王秀丽, 赵玉领. 黄河沿岸“非粮化”耕地形态特征识别与优化调控研究[J]. 农业机械学报, 2021, 52(10): 233-242.
[
|
| [11] |
张惠中, 宋文, 张文信, 等. 山东省耕地“非粮化”空间分异特征及其影响因素分析[J]. 中国土地科学, 2021, 35(10): 94-103.
[
|
| [12] |
刘余, 周应恒. 粮地租金变动对种粮行为调整的影响[J]. 华南农业大学学报(社会科学版), 2021, 20(3): 85-96.
[
|
| [13] |
闫梦露, 钟太洋. 外来职业农民和本地农户种植多样性差异及影响因素研究[J]. 资源科学, 2018, 40(9): 1752-1761.
|
| [14] |
王倩, 余劲. 农地流转背景下地块规模对农户种粮投入影响分析[J]. 中国人口·资源与环境, 2017, 27(5): 129-137.
[
|
| [15] |
刘航, 张莉琴. 农地流转会导致农地利用“非粮化”吗? 基于地块层面的实证分析[J]. 农村经济, 2020, (11): 45-53.
[
|
| [16] |
高晓燕, 赵宏倩. 工商资本下乡“非粮化”现象的诱因及长效对策[J]. 经济问题, 2021, (3): 92-99.
[
|
| [17] |
|
| [18] |
易小燕, 陈印军. 农户转入耕地及其“非粮化”种植行为与规模的影响因素分析: 基于浙江、河北两省的农户调查数据[J]. 中国农村观察, 2010, (6): 2-10.
[
|
| [19] |
赵丹丹, 周宏. 农户分化背景下种植结构变动研究: 来自全国31省农村固定观察点的证据[J]. 资源科学, 2018, 40(1): 64-73.
[
|
| [20] |
王嫚嫚, 刘颖, 蒯昊, 等. 土地细碎化、耕地地力对粮食生产效率的影响: 基于江汉平原354个水稻种植户的研究[J]. 资源科学, 2017, 39(8): 1488-1496.
[
|
| [21] |
|
| [22] |
宋戈, 白小艳, 高佳. 粮食产销平衡区耕地非粮化负外部效益空间分布特征[J]. 水土保持研究, 2018, 25(1): 349-355.
[
|
| [23] |
陈秧分, 王介勇. 对外开放背景下中国粮食安全形势研判与战略选择[J]. 自然资源学报, 2021, 36(6): 1616-1630.
[
|
| [24] |
梁鑫源, 金晓斌, 韩博, 等. 藏粮于地背景下国家耕地战略储备制度演进[J]. 资源科学, 2022, 44(1): 181-196.
[
|
| [25] |
戚渊, 李瑶瑶, 朱道林. 农地资本化视角下的耕地非粮化研究[J]. 中国土地科学, 2021, 35(8): 47-56.
[
|
| [26] |
匡远配, 刘洋. 农地流转过程中的“非农化”、“非粮化”辨析[J]. 农村经济, 2018, (4): 1-6.
[
|
| [27] |
常伟, 马诗雨. 农地规模流转中的“非粮化”问题研究[J]. 农业经济, 2020, (9): 3-5.
[
|
| [28] |
薛选登, 张一方. 产粮大县耕地“非粮化”现象及其防控[J]. 中州学刊, 2017, (8): 40-45.
[
|
| [29] |
陈浮, 刘俊娜, 常媛媛, 等. 中国耕地非粮化空间格局分异及驱动机制[J]. 中国土地科学, 2021, 35(9): 33-43.
[
|
| [30] |
|
| [31] |
朱丽娟, 王志伟. 黑龙江省种粮大户的技术效率及其影响因素[J]. 资源科学, 2018, 40(8): 1583-1594.
[
|
| [32] |
曾靖. 新时代湖北省农户粮食生产资源优化配置研究: 基于全省16个市州351个农户的实证分析[J]. 湖北社会科学, 2022, (1): 63-68.
[
|
| [33] |
李士梅, 高维龙. 要素集聚下我国粮食生产经营制约因素分析[J]. 农业技术经济, 2019, (6): 38-45.
[
|
| [34] |
刘影, 肖池伟, 李鹏, 等. 1978-2013年中国粮食主产区“粮-经”关系分析[J]. 资源科学, 2015, 37(10): 1891-1901.
[
|
| [35] |
曾雅婷, 吕亚荣, 蔡键. 农地流转是农业生产“非粮化”的诱因吗?[J]. 西北农林科技大学学报 (社会科学版), 2018, 18(3): 123-130.
[
|
| [36] |
何秀英, 周少川, 刘志霞, 等. 广东省农业科学院常规水稻育种60年: 成就与展望[J]. 广东农业科学, 2020, 47(11): 1-8.
|
| [37] |
陈印军, 易小燕, 方琳娜, 等. 中国耕地资源与粮食增产潜力分析[J]. 中国农业科学, 2016, 49(6): 1117-1131.
|
| [38] |
赵雪雁, 王伟军, 万文玉. 中国居民健康水平的区域差异: 2003-2013[J]. 地理学报, 2017, 72(4): 685-698.
[
|
| [39] |
王劲峰, 廖一兰, 刘鑫. 空间数据分析教程[M]. 北京: 科学出版社, 2010.
[
|
| [40] |
|
| [41] |
张文彤, 董伟. SPSS统计分析高级教程[M]. 北京: 高等教育出版社, 2004.
[
|
| [42] |
何晓群. 多元统计分析[M]. 4版. 北京: 中国人民大学出版社, 2015.
[
|
/
| 〈 |
|
〉 |