
金属资源产业对外直接投资对中国与东道国全球价值链地位的影响
|
李璇,女,辽宁大连人,博士生,研究方向为资源与产业经济。E-mail: gstslx@126.com |
收稿日期: 2020-12-24
要求修回日期: 2021-04-15
网络出版日期: 2021-12-25
基金资助
国家自然科学基金项目(72164021)
国家自然科学基金项目(72063020)
版权
Impacts of metal resource industry outward foreign direct investments on positions of China and the host countries in the global value chain
Received date: 2020-12-24
Request revised date: 2021-04-15
Online published: 2021-12-25
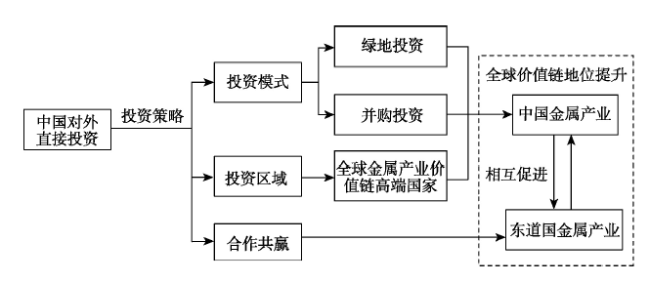
经济转型升级、提高国际竞争力离不开金属资源,其重要性不言而喻。在大国博弈下,中国在金属资源产业对外直接投资中如何突破价值链“低端锁定”,成为区域乃至全球经济的引领者,带动东道国金属产业加速发展,显得至关重要。本文借助2009—2018年中国金属资源产业对外直接投资数据,考察了直接投资对本国和东道国双边金属资源产业在全球价值链中地位的影响,以及选择不同投资模式、投资区域对中国金属资源产业价值链地位提升的影响。研究结果显示:①从总体上看,对外绿地投资显著促进中国金属资源产业价值链分工地位提升。②相对于发达国家,中国对位于价值链高端的发展中国家直接投资产生的溢出效应更大。③中国金属资源产业对外直接投资促进了东道国金属资源产业在全球价值链中的地位提升,且对发展中国家的促进更加显著,实现了合作共赢的局面。本文对金属资源产业价值链升级的研究有利于探寻中国全球治理和话语权提升的应对策略,对于政府更好地精准施策具有一定的参考意义。
李璇 , 倪旭 , 张海亮 . 金属资源产业对外直接投资对中国与东道国全球价值链地位的影响[J]. 资源科学, 2021 , 43(10) : 1976 -1989 . DOI: 10.18402/resci.2021.10.04
The economic transformation and upgrading and the improvement of international competitiveness are inseparable from metal resources, and their importance is self-evident. Under the great power game, it is very important for China to break through the “low-end lock” of value chain, become the leader of regional economy, and accelerate the development of metal industry of the host country in the metal resource industry outward foreign direct investment (OFDI). Based on country-specific data from 2009 to 2018, this study examined the impact of direct investment on the status of China and the host countries of metal resource industry OFDI in the global value chain (GVC), as well as the role of different investment modes and investment regions in improving the status of China’s metal resource industry in the GVCs. The results show that: (1) On the whole, greenfield investment in the metal resource industry significantly promoted the improvement of the division of labor in the value chain of metal minerals in China. (2) Compared with developed countries, China’s direct investment in underdeveloped countries at the high end of the value chain had a greater spillover effect. (3) China’s foreign direct investment in the metal resource industry can achieve win-win cooperation, which promotes the upgrading of the host countries’ metal resource industry in the global value chain, and has a more significant impact on underdeveloped countries. This research on the upgrading of the value chain in the metal resource industry is conducive to exploring strategies for promoting China’s role and power in global governance, and has certain reference significance for the government to better implement targeted policies.
表1 金属矿产资源产业链Table 1 Metal mineral resources chain |
| 产业链环节 | SITC编码 |
|---|---|
| 上游 | 274、278、281、282、283、284、285、286、287、288、289 |
| 中游 | 522、523、524、525 |
| 下游 | 671、672、673、674、675、676、677、678、679、681、682、683、684、685、686、687、689、691、692、693、694、695、696、697、699 |
表2 2018年样本国家金属矿产资源出口复杂度排名Table 2 Ranking of export complexity of metal mineral resources in sample countries, 2018 |
| 排名 | 国家 | 出口技术复杂度 | 排名 | 国家 | 出口技术复杂度 |
|---|---|---|---|---|---|
| 1 | 澳大利亚 | 29594.74 | 18 | 韩国 | 22444.43 |
| 2 | 挪威 | 29098.85 | 19 | 阿根廷 | 22065.69 |
| 3 | 以色列 | 27327.69 | 20 | 土耳其 | 21972.09 |
| 4 | 加拿大 | 25330.55 | 21 | 越南 | 21814.94 |
| 5 | 法国 | 25231.20 | 22 | 埃及 | 21652.49 |
| 6 | 英国 | 25221.95 | 23 | 墨西哥 | 20984.24 |
| 7 | 巴西 | 25192.77 | 24 | 俄罗斯 | 20334.22 |
| 8 | 美国 | 24682.38 | 25 | 南非 | 19467.37 |
| 9 | 德国 | 24672.76 | 26 | 巴基斯坦 | 18032.22 |
| 10 | 新加坡 | 24232.79 | 27 | 哈萨克斯坦 | 16530.51 |
| 11 | 沙特 | 24096.27 | 28 | 印度尼西亚 | 15607.31 |
| 12 | 意大利 | 23959.74 | 29 | 秘鲁 | 11992.32 |
| 13 | 中国 | 23897.45 | 30 | 智利 | 10470.58 |
| 14 | 泰国 | 23445.08 | 31 | 老挝 | 9734.23 |
| 15 | 马来西亚 | 23188.64 | 32 | 缅甸 | 9576.62 |
| 16 | 印度 | 23047.46 | 33 | 赞比亚 | 7806.40 |
| 17 | 日本 | 22922.92 | 34 | 津巴布韦 | 5435.91 |
表3 变量的描述性统计Table 3 Descriptive statistics of variables |
| 变量 | 变量符号 | 均值 | 中位数 | 标准差 | 最小值 | 最大值 |
|---|---|---|---|---|---|---|
| 东道国出口技术复杂度 | aexport | 19336.53 | 20996.19 | 5789.25 | 4898.31 | 30497.88 |
| 中国出口技术复杂度 | caexport | 22223.57 | 22413.17 | 1510.74 | 18465.53 | 23897.45 |
| 中国对外直接投资/亿美元 | ofdi | 21.02 | 2.46 | 105.0 | 1.14 | 1100.0 |
| 中国绿地投资/亿美元 | green | 20.08 | 2.19 | 0.104 | 1.14 | 1083.0 |
| 中国并购投资/亿美元 | ma | 6.87 | 0.09 | 20.43 | 0.00 | 207.45 |
| 东道国外商直接投资/亿美元 | fdi | 336.5 | 131.0 | 612.2 | 186.7 | 5091.0 |
| 东道国贸易开放度 | open | 0.13 | 0.06 | 0.22 | 0.01 | 1.60 |
| 东道国工业劳动力规模/百万人 | lab | 21.02 | 21.74 | 5.14 | 6.88 | 29.24 |
| 东道国矿产资源禀赋/亿美元 | res | 39.69 | 4.67 | 63.96 | 0.00 | 362.7 |
| 东道国金属行业研发投入 | rd | 0.32 | 0.81 | 0.31 | 0.00 | 1.64 |
| 中国外商直接投资/亿美元 | cfdi | 2274 | 2420 | 501.0 | 1311.0 | 2909.0 |
| 中国贸易开放度 | copen | 0.47 | 0.47 | 0.06 | 0.39 | 0.55 |
| 中国工业劳动力规模/百万人 | clab | 29.06 | 28.99 | 0.84 | 27.80 | 30.30 |
| 中国矿产资源禀赋/亿美元 | cres | 565.4 | 400.0 | 399.10 | 304.0 | 1591.0 |
| 中国金属行业研发投入 | crd | 1.83 | 0.21 | 1.82 | 1.49 | 2.15 |
表4 投资模式影响中国金属资源产业价值链地位的回归结果Table 4 Regression results of the influence of different investment modes on the value chain position of China’s metal resource industry |
| 一般面板模型 | GMM模型 | |||||
|---|---|---|---|---|---|---|
| (1) | (2) | (3) | (4) | (5) | (6) | |
| lnofdi | 0.011*** | 0.001* | ||||
| (4.41) | (1.50) | |||||
| lngreen | 0.011*** | 0.001* | ||||
| (4.63) | (1.40) | |||||
| lnma | 0.000 | 0.001 | ||||
| (0.45) | (0.48) | |||||
| lncfdi | 0.325*** | 0.325*** | 0.331*** | 0.352*** | 0.352*** | 0.319*** |
| (28.04) | (28.17) | (29.22) | (39.73) | (39.82) | (25.19) | |
| clab | -0.041*** | -1.845*** | -1.959*** | -0.0465*** | -0.0467*** | -0.0591*** |
| (-7.82) | (-22.07) | (-21.66) | (-10.90) | (-10.97) | (-12.94) | |
| copen | -1.843*** | -0.0414*** | -0.0551*** | -1.992*** | -1.995*** | -1.935*** |
| (-21.75) | (-8.04) | (-9.88) | (-37.76) | (-37.97) | (-22.79) | |
| lncrd | 0.713*** | 0.717*** | 0.888*** | 0.789*** | 0.791*** | 0.931*** |
| (19.93) | (20.65) | (23.28) | (21.81) | (21.96) | (14.74) | |
| lncres | 0.094*** | 0.095*** | 0.104*** | 0.098*** | 0.098*** | 0.107*** |
| (15.84) | (16.12) | (13.87) | (18.50) | (18.55) | (12.21) | |
| 常数项 | 5.609*** | 5.627*** | 6.931*** | 5.657*** | 5.660*** | 7.538*** |
| (16.12) | (16.22) | (16.24) | (14.67) | (14.69) | (12.94) | |
| R2 | 0.9058 | 0.9064 | 0.9018 | |||
| Hausman P | 0.0001 | 0.0001 | 0.1073 | |||
| Wald | 3404.99 | 3409.87 | 1686.75 | |||
注:*表示p<0.1,**表示p<0.05,***表示p<0.01,下同。 |
表5 投资模式影响中国金属资源产业价值链地位的分位数回归结果Table 5 Quantile regression results of the influence of different investment modes on the value chain status of China’s metal resource industry |
| 式(1) | 式(2) | |||||
|---|---|---|---|---|---|---|
| QREG(25) | QREG(50) | QREG(75) | QREG(25) | QREG(50) | QREG(75) | |
| lnofdi | 0.006* | 0.010*** | 0.015*** | |||
| (1.88) | (3.50) | (3.11) | ||||
| lngreen | 0.006** | 0.010*** | 0.015*** | |||
| (1.96) | (3.71) | (3.34) | ||||
| lncfdi | 0.345*** | 0.328*** | 0.306*** | 0.345*** | 0.327*** | 0.304*** |
| (21.46) | (23.96) | (13.46) | (21.93) | (24.75) | (13.93) | |
| clab | -0.033*** | -0.040*** | -0.048*** | -0.034*** | -0.040*** | -0.049*** |
| (-5.79) | (-8.26) | (-5.95) | (-6.04) | (-8.71) | (-6.30) | |
| copen | -2.204*** | -1.886*** | -1.477*** | -2.215*** | -1.896*** | -1.480*** |
| (-25.81) | (-20.27) | (-11.84) | (-26.71) | (-20.80) | (-12.37) | |
| lncrd | 0.803*** | 0.723*** | 0.621*** | 0.809*** | 0.730*** | 0.626*** |
| (15.96) | (16.17) | (8.69) | (16.64) | (17.06) | (9.23) | |
| lncres | 0.111*** | 0.0960*** | 0.0767*** | 0.112*** | 0.0973*** | 0.0778*** |
| (16.07) | (15.02) | (7.79) | (16.47) | (15.59) | (8.14) | |
注:QREG(25)、(50)、(75)分别表示在25%、50%、75%位置的四分位数,下同。本结果是在stata15.0软件中使用xtqreg命令得到的,软件没有报告方程的常数项和R2。 |
表6 投资区域影响中国金属资源产业价值链地位的分样本结果Table 6 Sub-sample analysis results of the impact of investment regions on the value chain position of China’s metal resource industry |
| 全样本 | 发达国家 | 发展中国家 | ||||
|---|---|---|---|---|---|---|
| (1) | (2) | (3) | (4) | (5) | (6) | |
| lnofdi | 0.014*** | 0.025*** | 0.021*** | |||
| (4.40) | (2.91) | (4.05) | ||||
| lngreen | 0.028*** | 0.023** | 0.044*** | |||
| (4.89) | (2.44) | (5.58) | ||||
| lnma | 0.003** | 0.003 | 0.001 | |||
| (2.29) | (1.33) | (0.97) | ||||
| High | 0.048 | 0.191*** | 0.110 | 0.157 | -0.190 | 0.125 |
| (1.42) | (2.64) | (1.12) | (1.22) | (-1.49) | (0.73) | |
| High×lnofdi | -0.004* | -0.010* | 0.016* | |||
| (-1.66) | (-1.33) | (1.52) | ||||
| High×lngreen | -0.014*** | -0.011* | -0.013 | |||
| (-3.11) | (-1.45) | (-1.10) | ||||
| High×lnma | 0.000 | -0.000 | 0.005* | |||
| (0.27) | (-0.17) | (1.32) | ||||
| Control | Yes | Yes | Yes | Yes | Yes | Yes |
| 常数项 | 5.547*** | 6.665*** | 5.350*** | 5.963*** | 5.546*** | 6.006*** |
| (15.92) | (11.17) | (6.66) | (6.66) | (9.40) | (6.81) | |
| R2 | 0.9071 | 0.9092 | 0.8379 | 0.8309 | 0.8304 | 0.8682 |
| Hausman P | 0.0004 | 0.0000 | 0.0085 | 0.0627 | 0.0011 | 0.0003 |
表7 投资区域影响中国金属资源产业价值链地位的分位数回归结果Table 7 Quantile regression results of the impact of investment regions on the value chain position of China’s metal resource industry |
| 式(4) | 式(6) | |||||
|---|---|---|---|---|---|---|
| QREG(25) | QREG(50) | QREG(75) | QREG(25) | QREG(50) | QREG(75) | |
| lngreen | 0.025** | 0.023*** | 0.021* | 0.044*** | 0.042*** | 0.041*** |
| (2.24) | (2.90) | (1.83) | (3.13) | (4.71) | (3.72) | |
| lnma | 0.003 | 0.003* | 0.003 | 0.001 | 0.002 | 0.002 |
| (1.30) | (1.69) | (1.08) | (0.70) | (1.43) | (1.41) | |
| High | 0.179 | 0.155 | 0.130 | 0.193 | 0.121 | 0.0563 |
| (1.11) | (1.37) | (0.82) | (0.75) | (0.73) | (0.28) | |
| High×lngreen | -0.014 | -0.011* | -0.008 | -0.018 | -0.013 | -0.009 |
| (-1.49) | (-1.65) | (-0.83) | (-0.98) | (-1.15) | (-0.66) | |
| High×lnma | 0.001 | -0.001 | -0.002 | 0.006* | 0.005** | 0.005* |
| (0.23) | (-0.21) | (-0.56) | (1.56) | (2.20) | (1.61) | |
| Control | Yes | Yes | Yes | Yes | Yes | Yes |
表8 中国对外直接投资对东道国金属资源产业价值链地位的影响Table 8 Influence of China’s outward foreign direct investment (OFDI) on the value chain status of the host country’s metal resource industry |
| 总样本 | 发达国家 | 发展中国家 | ||||
|---|---|---|---|---|---|---|
| (1) | (2) | (3) | (4) | (5) | (6) | |
| lnofdi | 0.012** | 0.032* | -0.002 | -0.002 | 0.030*** | 0.095*** |
| (2.11) | (1.65) | (-0.65) | (-0.29) | (3.10) | (5.01) | |
| lncaexport | 0.723*** | 0.451* | 0.716*** | 0.795*** | 0.556*** | -0.081 |
| (9.87) | (1.77) | (10.92) | (6.23) | (4.92) | (-0.33) | |
| lnfdi | 0.012** | 0.102*** | -0.002 | -0.015* | 0.015* | 0.096*** |
| (2.20) | (8.29) | (-0.46) | (-1.93) | (1.92) | (5.65) | |
| lab | 0.007* | 0.041*** | -0.018*** | -0.012*** | 0.009* | 0.046*** |
| (1.81) | (14.67) | (-3.60) | (-5.84) | (1.84) | (13.76) | |
| open | 0.023 | -0.295*** | 0.432* | -0.013 | -0.038 | -0.281** |
| (0.26) | (-2.58) | (1.48) | (-0.07) | (-0.37) | (-2.38) | |
| lnrd | -0.010 | 0.024* | -0.048 | -0.045* | -0.010 | -0.017 |
| (-1.35) | (1.91) | (-1.53) | (-1.87) | (-1.09) | (-1.20) | |
| lnres | 0.005 | -0.025*** | 0.001 | 0.004** | 0.022** | -0.051*** |
| (1.18) | (-5.23) | (0.38) | (2.22) | (2.01) | (-4.35) | |
| 常数项 | 1.855*** | 2.229 | 3.316*** | 2.664** | 2.737*** | 7.268*** |
| (2.73) | (0.89) | (5.03) | (2.04) | (2.76) | (2.96) | |
| R2 | 0.5950 | 0.8745 | 0.5660 | |||
| Hausman P | 0.0000 | 0.9317 | 0.0000 | |||
| Wald | 813.76 | 160.42 | 1896.30 | |||
表9 中国对外直接投资影响东道国金属资源产业价值链地位的分位数回归结果Table 9 Quantile regression results of the impact of China’s outward foreign direct investment (OFDI) on the metal resource industry value chain status of the host country |
| 式(1) | 式(5) | |||||
|---|---|---|---|---|---|---|
| QREG(25) | QREG(50) | QREG(75) | QREG(25) | QREG(50) | QREG(75) | |
| lnofdi | 0.008 | 0.012** | 0.015** | 0.024* | 0.030*** | 0.038*** |
| (1.18) | (2.41) | (2.30) | (1.75) | (2.92) | (2.70) | |
| lncaexport | 0.788*** | 0.715*** | 0.662*** | 0.629*** | 0.556*** | 0.476*** |
| (7.90) | (10.15) | (7.34) | (4.47) | (5.16) | (3.31) | |
| lnfdi | 0.0129 | 0.0120** | 0.0114 | 0.0138 | 0.0145* | 0.0152 |
| (1.57) | (2.08) | (1.53) | (1.41) | (1.95) | (1.52) | |
| lab | 0.011* | 0.007 | 0.004 | 0.014** | 0.009* | 0.004 |
| (1.72) | (1.51) | (0.65) | (2.12) | (1.87) | (0.67) | |
| open | -0.004 | 0.026 | 0.049 | -0.066 | -0.038 | -0.007 |
| (-0.03) | (0.26) | (0.38) | (-0.56) | (-0.42) | (-0.06) | |
| lnrd | -0.014 | -0.010 | -0.007 | -0.014 | -0.010 | -0.005 |
| (-0.88) | (-0.90) | (-0.50) | (-1.03) | (-0.91) | (-0.33) | |
| lnres | 0.005 | 0.005 | 0.005 | 0.024 | 0.022 | 0.018 |
| (0.92) | (1.20) | (0.87) | (1.35) | (1.57) | (1.00) | |
| [1] |
武轶, 李颖, 陈其慎, 等. 中国矿产资源海外供应安全形势浅析[J]. 中国矿业, 2016, 25(4):6-9.
[
|
| [2] |
尹伟华. 中国制造业产品全球价值链的分解分析: 基于世界投入产出表视角[J]. 世界经济研究, 2016, (1):66-75.
[
|
| [3] |
章韬, 卢晓菲, 沈玉良. 全球价值链嵌入位置、出口目的国与出口产品复杂度[J]. 世界经济研究, 2016, (9):29-47.
[
|
| [4] |
陆挺, 刘璇, 张艳飞, 等. 基于产业链分析的中国铟锗镓产业发展战略研究[J]. 资源科学, 2015, 37(5):1008-1017.
[
|
| [5] |
|
| [6] |
|
| [7] |
|
| [8] |
谢一青, 徐灏龙, 董星. 全球价值链下跨国直接投资对区域经济的影响: 以特斯拉超级工厂进入上海为例[J]. 世界经济文汇, 2020, (4):31-46.
[
|
| [9] |
|
| [10] |
|
| [11] |
|
| [12] |
|
| [13] |
唐晓华, 高鹏. 全球价值链视角下中国制造业企业海外并购的动因与趋势分析[J]. 经济问题探索, 2019, (3):92-98.
[
|
| [14] |
肖添. 中国对外直接投资与产业价值链攀升: 基于人民币汇率波动视角[J]. 经济体制改革, 2019, (9):195-200.
[
|
| [15] |
王安建, 高芯蕊. 中国能源与重要矿产资源需求展望[J]. 中国科学院院刊, 2020, 35(3):338-344.
[
|
| [16] |
郭娟, 崔荣国, 闫卫东, 等. 2019年中国矿产资源形势回顾与展望[J]. 中国矿业, 2020, 29(1):1-5.
[
|
| [17] |
朱学红, 彭婷, 谌金宇. 战略性关键金属贸易网络特征及其对产业结构升级的影响[J]. 资源科学, 2020, 42(8):1489-1503.
[
|
| [18] |
|
| [19] |
刘友金, 尹延钊, 曾小明. 中国向“一带一路”国家产业转移的互惠共生效应: 基于双边价值链升级视角的研究[J]. 经济地理, 2020, 40(10):136-146.
[
|
| [20] |
|
| [21] |
林柄全, 谷人旭, 王俊松. 集聚经济与基于价值链的企业区位选择: 重新发现内部集聚经济[J]. 经济地理, 2020, 40(4):56-64.
[
|
| [22] |
林莎, 雷井生, 杨航. 中国企业绿地投资与跨国并购的差异性研究: 来自 223 家国内企业的经验分析[J]. 管理评论, 2014, 26(9):139-148.
[
|
| [23] |
余鹏翼, 曾楚宏. 全球价值链重构与中国制造业海外连续并购战略转型研究[J]. 南京社会科学, 2016, (5):16-21.
[
|
| [24] |
|
| [25] |
|
| [26] |
张志原, 李论. “一带一路”倡议的扩散分析[J]. 国际政治科学, 2020, 5(1):130-160
[
|
| [27] |
刘乐. “一带一路”的安全保障[J]. 国际经济评论, 2021, (2):107-128.
[
|
| [28] |
|
| [29] |
刘爱兰, 王智烜, 黄梅波. 资源掠夺还是多因素驱动? 非正规经济视角下中国对非直接投资的动因研究[J]. 世界经济研究, 2017, (1):70-84, 136.
[
|
| [30] |
姚战琪, 夏杰长. 中国对外直接投资对“一带一路”沿线国家攀升全球价值链的影响[J]. 南京大学学报(哲学·人文科学·社会科学), 2018, 55(4):35-46.
[
|
| [31] |
彭澎, 李佳熠. OFDI与双边国家价值链地位的提升: 基于“一带一路”沿线国家的实证研究[J]. 产业经济研究, 2018, (6):75-88.
[
|
| [32] |
|
| [33] |
|
| [34] |
秦朵. 绿地投资、跨国并购与经济增长关系的实证研究[J]. 商业时代, 2012, (29):64-66.
[
|
| [35] |
叶娇, 王佳林. FDI对本土技术创新的影响研究: 基于江苏省面板数据的实证[J]. 国际贸易问题, 2014, (1):131-138.
[
|
| [36] |
韩亚峰, 冯雅倩. OFDI逆向技术溢出对制造业价值链升级的影响: 基于G20国家面板数据的研究[J]. 国际商务(对外经济贸易大学学报), 2018, (6):75-85.
[
|
| [37] |
马述忠, 陈亚平, 刘梦恒. 对外直接投资逆向技术溢出与全球农业价值链地位提升: 基于G20国家的经验研究[J]. 国际商务研究, 2017, 38(3):5-17.
[
|
| [38] |
吕越, 娄承蓉. 引领构建一带一路区域价值链[N/OL]. (2018-04-04) [2020-12-24]. http://www.cssn.cn/zx/bwyc/201804/t2018040 4_3897537.shtml
[
|
/
| 〈 |
|
〉 |