
全球供应链视角下的中国碳排放责任与形象
|
刘宏笪,男,江苏南通人,硕士,研究方向为绿色发展。E-mail: liuhoda@163.com |
收稿日期: 2020-09-24
要求修回日期: 2021-01-02
网络出版日期: 2021-06-25
基金资助
国家自然科学基金面上项目(71673117)
版权
China’s carbon emission responsibility and image from the perspective of global supply chain
Received date: 2020-09-24
Request revised date: 2021-01-02
Online published: 2021-06-25
Copyright
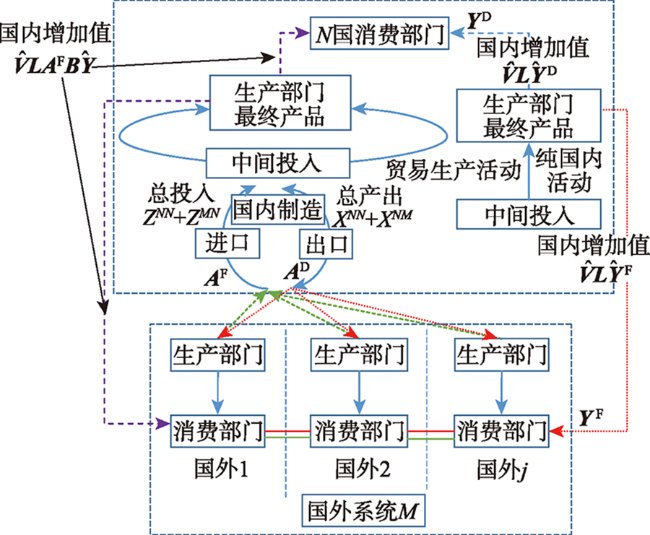
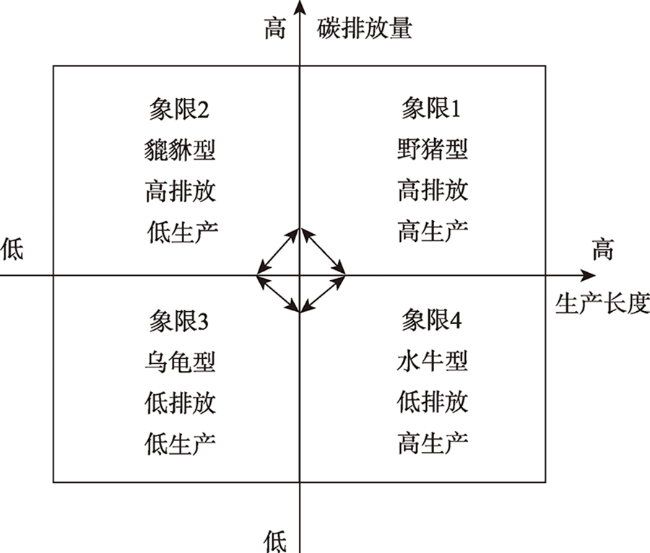
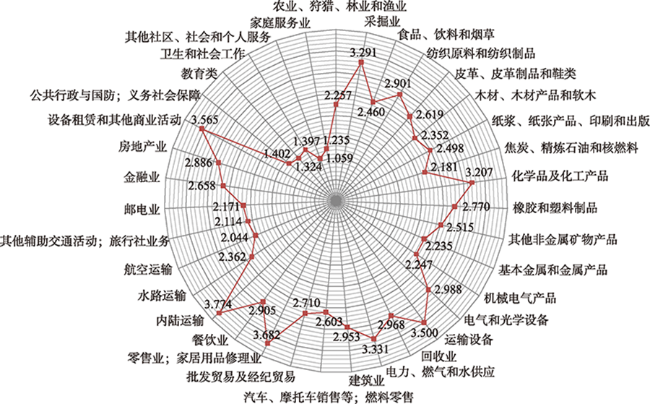
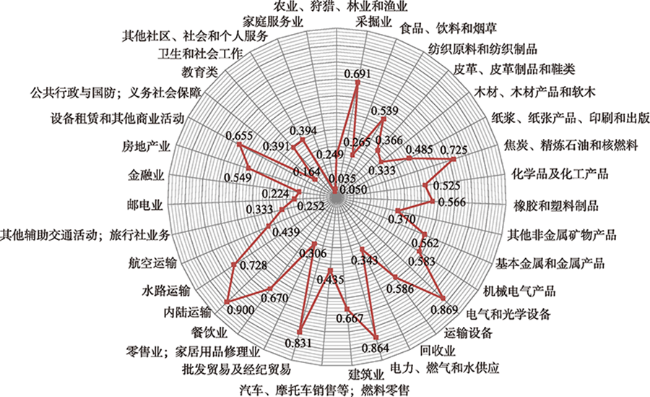
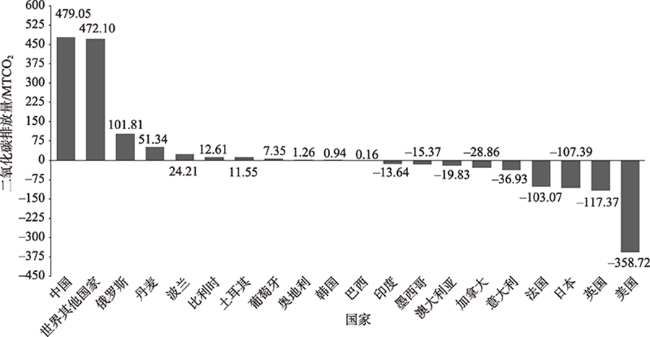
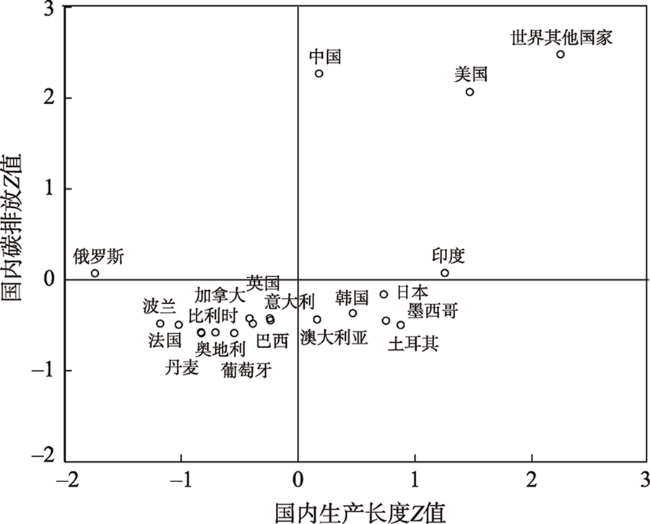
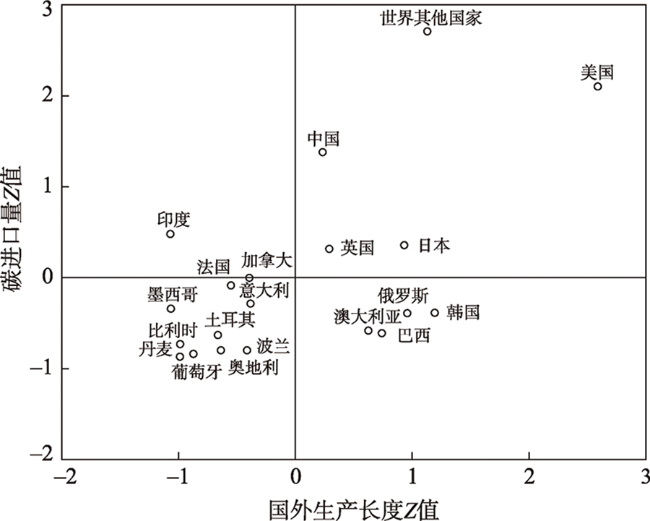
碳中和目标下,基于供应链调整各国间的碳排放关系,明确中国碳排放责任与形象,对于中国深化绿色发展、实现低碳转型具有重要意义。基于全球供应链视角,引入生产与贸易中的碳排放问题,并构建碳供应链测度分析模型。本文基于2008—2014年世界投入产出数据库(WIOD)数据,首先,明确中国在碳供应链生产端的国内生产长度、国外生产长度,以及中国在碳供应链贸易端的碳出口、碳进口规模;其次,测算并总结中国、美国等19个世界主要国家碳净出口与国内碳排放情况,对比分析上述国家碳泄漏与碳减排情况,从而剖析并刻画中国碳排放责任与形象;最后,基于19个世界主要国家碳供应链生产、贸易端的情况,总结得出各国碳供应链国内、国外情况,进一步探究中国在全球供应链视角下的碳排放责任与形象调整方向。结果表明:①中国国内生产长度呈现二、三、一产业梯次化衰减特征,国外生产长度明显趋短,且能源、电气等关键产业陷入低端锁定困局;②中国年均碳出口、碳进口分别达880.375 MT、401.328 MT,碳规模位居世界前列;③中国贡献了41.21%的碳净出口份额,美英日法则形成686.511 MT的碳泄漏缺口,中国以全球最大的碳净出口国家身份,在全球供应链体系中承担积极的碳排放责任;中美俄国内碳排放达到1000 MT以上,但中国碳减排率达3.79%,显著高于美国2.07%、俄罗斯-1.05%,中国以较高的碳利用率呈现碳减排形象;④中国国内、国外碳供应链均处于“野猪型”状态,碳供应链质量有待提升;发达国家国内碳供应链多以“水牛型”状态出现,萎缩的经济降低了生产能力与碳排放量;国外碳供应链中,发达国家多呈现“乌龟型”特征,碳减排乏力且碳排放责任推诿。因此,中国须针对生产环节调整产业结构,摆脱产业依赖,继续秉持大国碳减排责任、呈现积极的碳排放形象。
刘宏笪 , 张济建 , 张茜 . 全球供应链视角下的中国碳排放责任与形象[J]. 资源科学, 2021 , 43(4) : 652 -668 . DOI: 10.18402/resci.2021.04.02
Under the goal of carbon neutrality, adjusting the carbon emission relationship between countries based on the supply chain and clarifying China’s carbon emission responsibilities and image is of great significance for China to deepen green development and realize low-carbon transformation. Based on the perspective of global supply chain, introduce carbon emission issues in production and trade, and build a carbon supply chain measurement and analysis model. Based on the data of 43 countries in the WIOD database from 2008 to 2014, this paper first clarifies China’s domestic production length and foreign production length at the production end of the carbon supply chain, as well as China’s carbon export and carbon import scale at the trade end of the carbon supply chain; second, summary It also measures the net carbon exports and domestic carbon emissions of 19 major countries in the world, including China and the United States, and compares and analyzes the carbon leakage and carbon emission reductions of the above-mentioned countries, so as to analyze and characterize China’s carbon emissions responsibility and image. Finally, based on the production and trade end of the carbon supply chains of 19 major countries in the world, we summarize the domestic and foreign conditions of the carbon supply chains of each country, and further explore China’s carbon emission responsibility and image adjustment direction from the perspective of the global supply chain. The results show that: (1) China’s domestic production length presents the characteristics of secondary, tertiary, and first industrial cascading attenuation, and foreign production lengths are obviously decreasing, and key industries such as energy and electrical are in a low-end lock-in dilemma; (2) China’s annual average carbon exports and carbon imports are respectively The carbon scale reached 880.375 MT and 401.328 MT, ranking the top in the world; (3) China contributed 41.21% of the net carbon export share, and the US, Britain and Japan rules formed a carbon leakage gap of 686.511 MT. China is the world’s largest net carbon exporter in the world. The supply chain system assumes active carbon emission responsibilities; The carbon emissions in China, the United States and Russia have reached more than 1000 MT, but China’s carbon emission reduction rate has reached 3.79%, which is significantly higher than the United States’ 2.07% and Russia’s -1.05%. Utilization rate presents the image of carbon emission reduction; (4) China’s domestic and foreign carbon supply chains are in a state of “wild boar”, and the quality of carbon supply chains needs to be improved; developed countries mostly appear in the state of “buffalo” in domestic carbon supply chains, with a shrinking economy Reduced production capacity and carbon emissions; in foreign carbon supply chains, most developed countries have a “turtle-like” characteristic, with weak carbon emission reductions and shirk responsibility for carbon emissions. Therefore, China must adjust its industrial structure for production links, get rid of industrial dependence, continue to uphold the responsibility of a major country in reducing carbon emissions, and present a positive image of carbon emissions.
表1 投入产出表结构Table 1 Input-output table structure |
| 国家与产业 | 中间投入 | 最终使用/需求 | 总产 出 | ||||||||||||||||||||||
|---|---|---|---|---|---|---|---|---|---|---|---|---|---|---|---|---|---|---|---|---|---|---|---|---|---|
| 国家1 | ... | 国家N | 国家1 | ... | 国家N | ||||||||||||||||||||
| 产业1 | ... | 产业j | ... | 产业1 | ... | 产业j | 家庭 最终 消费 | 政府 最终 消费 | 非营利组织消费 | 固定 资本 形成 | 存货变动 | ... | 家庭 最终 消费 | 政府最终消费 | 非营利组织消费 | 固定 资本 形成 | 存货变动 | ||||||||
| 国家1 | 产业1 | Z 1111 | ... | Z 111j | ... | Z 1N11 | ... | Z 1N1j | Y 1111 | Y 1112 | Y 1113 | Y 1114 | Y 1115 | ... | Y 1N11 | Y 1N12 | Y 1N13 | Y 1N14 | Y 1N15 | X 11 | |||||
| ... | ... | ... | ... | ... | ... | ... | ... | ... | ... | ... | ... | ... | ... | ... | ... | ... | ... | ... | ... | ||||||
| 产业j | Z 11j1 | ... | Z 11jj | ... | Z 1Nj1 | ... | Z 1Njj | Y 11j1 | Y 11j2 | Y 11j3 | Y 11j4 | Y 11j5 | ... | Y 1Nj1 | Y 1Nj2 | Y 1Nj3 | Y 1Nj4 | Y 1Nj5 | X 1j | ||||||
| ... | ... | ... | ... | ... | ... | ... | ... | ... | ... | ... | ... | ... | ... | ... | ... | ... | ... | ... | ... | ... | |||||
| 国家N | 产业1 | Z N111 | ... | Z N11j | ... | Z NN11 | ... | Z NN1j | Y N111 | Y N112 | Y N113 | Y N114 | Y N115 | ... | Y NN11 | Y NN12 | Y NN13 | Y NN14 | Y NN15 | X N1 | |||||
| ... | ... | ... | ... | ... | ... | ... | ... | ... | ... | ... | ... | ... | ... | ... | ... | ... | ... | ... | ... | ||||||
| 产业j | Z N1j1 | ... | Z N1jj | ... | Z NNj1 | ... | Z NNjj | Y N1j1 | Y N1j2 | Y N1j3 | Y N1j4 | Y N1j5 | ... | Y NNj1 | YNNj2 | YNNj3 | YNNj4 | YNNj5 | XNj | ||||||
| 增加值 | ... | ... | ... | ||||||||||||||||||||||
| 总产出 | (X 11)’ | ... | (X 1j)’ | ... | (X N1)’ | ... | (X Nj)’ | ||||||||||||||||||
表2 2008—2014年中国各产业部门碳出口量Table 2 China’s carbon exports by industrial sectors, 2008-2014 (MTCO2) |
| 产业 | 2008年 | 2009年 | 2010年 | 2011年 | 2012年 | 2013年 | 2014年 | 均值 |
|---|---|---|---|---|---|---|---|---|
| 农业、狩猎、林业和渔业 | 6.163 | 5.962 | 6.943 | 6.150 | 5.092 | 5.034 | 4.883 | 5.747 |
| 采掘业 | 17.642 | 10.207 | 10.097 | 10.491 | 9.976 | 9.221 | 8.583 | 10.888 |
| 食品、饮料和烟草 | 13.568 | 11.152 | 8.936 | 8.331 | 7.007 | 6.619 | 6.438 | 8.864 |
| 纺织原料和纺织制品 | 73.034 | 53.143 | 53.788 | 53.087 | 46.505 | 45.832 | 45.184 | 52.939 |
| 皮革、皮革制品和鞋类 | 3.006 | 1.948 | 2.265 | 2.320 | 2.275 | 2.092 | 2.190 | 2.299 |
| 纸浆、纸张产品、印刷和出版 | 4.767 | 4.679 | 5.950 | 7.896 | 9.491 | 10.113 | 10.768 | 7.666 |
| 焦炭、精炼石油和核燃料 | 13.489 | 9.803 | 12.250 | 13.188 | 13.140 | 14.459 | 14.927 | 13.037 |
| 化学品及化工产品 | 117.753 | 76.218 | 81.108 | 82.458 | 69.351 | 66.302 | 70.248 | 80.491 |
| 橡胶和塑料制品 | 14.934 | 10.079 | 9.064 | 8.909 | 8.773 | 8.273 | 7.970 | 9.714 |
| 其他非金属矿物产品 | 157.067 | 112.661 | 139.015 | 142.453 | 158.118 | 159.423 | 160.015 | 146.964 |
| 基本金属和金属产品 | 159.277 | 96.101 | 116.852 | 130.627 | 122.908 | 120.251 | 134.995 | 125.859 |
| 机械电气产品 | 29.194 | 20.369 | 17.868 | 17.929 | 15.782 | 14.759 | 14.698 | 18.657 |
| 电气和光学设备 | 39.343 | 37.546 | 26.178 | 24.111 | 23.445 | 22.355 | 22.429 | 27.915 |
| 运输设备 | 26.703 | 21.720 | 19.174 | 18.580 | 17.115 | 13.945 | 13.150 | 18.627 |
| 回收业 | 13.608 | 10.958 | 7.106 | 6.355 | 5.937 | 4.837 | 4.169 | 7.567 |
| 电力、燃气和水供应 | 45.821 | 38.121 | 46.091 | 48.886 | 50.486 | 47.787 | 49.484 | 46.668 |
| 建筑业 | 1.528 | 1.344 | 1.436 | 1.637 | 1.648 | 2.007 | 1.694 | 1.613 |
| 批发贸易及经纪贸易 | 4.216 | 4.232 | 2.597 | 2.247 | 1.717 | 0.979 | 0.553 | 2.363 |
| 零售业;家居用品修理业 | 3.806 | 3.809 | 3.851 | 4.170 | 4.205 | 3.467 | 3.430 | 3.820 |
| 内陆运输 | 21.882 | 18.821 | 24.515 | 27.280 | 28.435 | 25.899 | 23.422 | 24.322 |
| 水路运输 | 129.639 | 117.313 | 164.950 | 156.325 | 138.571 | 127.932 | 117.140 | 135.981 |
| 航空运输 | 98.668 | 130.384 | 110.483 | 106.431 | 95.914 | 88.436 | 80.881 | 101.600 |
| 其他辅助交通活动;旅行社业务 | 3.643 | 3.154 | 3.966 | 4.340 | 4.436 | 4.137 | 3.823 | 3.928 |
| 餐饮业 | 3.387 | 3.069 | 2.192 | 1.855 | 1.560 | 1.520 | 1.454 | 2.148 |
| 邮电业 | 0.246 | 0.198 | 0.235 | 0.260 | 0.224 | 0.189 | 0.153 | 0.215 |
| 金融业 | 0.020 | 0.023 | 0.029 | 0.038 | 0.046 | 0.036 | 0.032 | 0.032 |
| 设备租赁和其他商业活动 | 22.036 | 19.492 | 16.000 | 15.678 | 13.594 | 11.445 | 11.398 | 15.663 |
| 公共行政与国防;义务社会保障 | 0.193 | 0.166 | 0.164 | 0.163 | 0.158 | 0.172 | 0.137 | 0.165 |
| 教育类 | 0.142 | 0.117 | 0.095 | 0.085 | 0.079 | 0.082 | 0.063 | 0.095 |
| 卫生和社会工作 | 0.271 | 0.225 | 0.158 | 0.132 | 0.113 | 0.125 | 0.101 | 0.161 |
| 其他社区、社会和个人服务 | 6.910 | 5.032 | 4.406 | 3.959 | 3.841 | 3.553 | 2.868 | 4.367 |
| 总值 | 1031.959 | 828.043 | 897.758 | 906.368 | 859.942 | 821.281 | 817.277 | - |
表3 2008—2014年中国各产业部门碳进口量Table 3 China’s carbon imports by industrial sectors, 2008-2014 (MTCO2) |
| 产业 | 2008年 | 2009年 | 2010年 | 2011年 | 2012年 | 2013年 | 2014年 | 均值 |
|---|---|---|---|---|---|---|---|---|
| 农业、狩猎、林业和渔业 | 3.791 | 3.577 | 4.306 | 4.679 | 4.542 | 4.438 | 4.737 | 4.296 |
| 采掘业 | 16.925 | 16.331 | 17.679 | 19.350 | 28.473 | 28.703 | 29.352 | 22.402 |
| 食品、饮料和烟草 | 3.863 | 3.352 | 4.440 | 5.301 | 5.776 | 5.929 | 6.284 | 4.992 |
| 纺织原料和纺织制品 | 4.085 | 3.507 | 4.314 | 4.569 | 4.188 | 4.342 | 4.514 | 4.217 |
| 皮革、皮革制品和鞋类 | 0.850 | 0.938 | 1.043 | 1.207 | 1.103 | 1.208 | 1.598 | 1.136 |
| 纸浆、纸张产品、印刷和出版 | 2.678 | 2.564 | 3.415 | 3.993 | 3.211 | 3.423 | 4.535 | 3.403 |
| 焦炭、精炼石油和核燃料 | 14.026 | 15.175 | 19.945 | 22.759 | 22.612 | 19.793 | 20.011 | 19.189 |
| 化学品及化工产品 | 34.791 | 33.952 | 45.552 | 47.807 | 47.567 | 48.180 | 52.224 | 44.296 |
| 橡胶和塑料制品 | 4.546 | 4.900 | 5.881 | 6.236 | 5.869 | 5.678 | 5.846 | 5.565 |
| 其他非金属矿物产品 | 16.493 | 16.920 | 17.447 | 18.343 | 18.203 | 18.846 | 19.429 | 17.955 |
| 基本金属和金属产品 | 27.737 | 26.139 | 31.220 | 36.836 | 35.899 | 41.928 | 44.470 | 34.890 |
| 机械电气产品 | 13.407 | 14.581 | 15.236 | 16.130 | 16.958 | 18.997 | 18.551 | 16.266 |
| 电气和光学设备 | 66.877 | 66.318 | 74.042 | 77.643 | 87.842 | 82.344 | 87.434 | 77.500 |
| 运输设备 | 1.137 | 1.506 | 2.041 | 2.350 | 2.335 | 2.638 | 2.388 | 2.056 |
| 回收业 | 11.653 | 11.375 | 21.596 | 31.919 | 35.678 | 42.036 | 52.612 | 29.553 |
| 电力、燃气和水供应 | 18.094 | 18.099 | 18.420 | 18.836 | 18.678 | 18.496 | 18.992 | 18.516 |
| 建筑业 | 11.758 | 13.597 | 18.492 | 21.474 | 21.880 | 25.638 | 25.986 | 19.832 |
| 汽车、摩托车销售等;燃料零售 | 22.455 | 23.245 | 24.844 | 25.843 | 35.852 | 36.867 | 36.559 | 29.381 |
| 批发贸易及经纪贸易 | 2.761 | 2.114 | 2.948 | 3.697 | 3.720 | 4.065 | 4.367 | 3.382 |
| 零售业、家居用品修理业 | 0.571 | 0.437 | 0.610 | 0.765 | 0.770 | 0.841 | 0.903 | 0.700 |
| 内陆运输 | 1.230 | 1.047 | 1.128 | 1.344 | 1.319 | 1.350 | 1.430 | 1.264 |
| 水路运输 | 0.668 | 0.542 | 0.516 | 0.658 | 0.730 | 0.797 | 0.823 | 0.676 |
| 航空运输 | 2.107 | 1.893 | 2.780 | 3.893 | 4.552 | 4.831 | 5.076 | 3.590 |
| 其他辅助交通活动;旅行社业务 | 3.899 | 3.895 | 4.325 | 4.830 | 6.036 | 7.188 | 8.335 | 5.501 |
| 餐饮业 | 1.787 | 1.624 | 1.765 | 1.834 | 1.793 | 2.790 | 3.055 | 2.093 |
| 邮电业 | 1.669 | 1.322 | 1.621 | 1.845 | 1.840 | 1.951 | 2.021 | 1.753 |
| 房地产业 | 0.478 | 0.433 | 0.663 | 0.879 | 0.840 | 0.925 | 1.035 | 0.750 |
| 金融业 | 1.407 | 1.159 | 1.798 | 2.392 | 2.121 | 2.476 | 3.252 | 2.086 |
| 设备租赁和其他商业活动 | 3.183 | 2.836 | 4.089 | 5.427 | 5.510 | 6.105 | 7.259 | 4.916 |
| 公共行政与国防;义务社会保障 | 6.484 | 5.756 | 8.496 | 10.819 | 11.049 | 12.167 | 13.419 | 9.741 |
| 教育类 | 3.020 | 2.851 | 4.581 | 6.491 | 6.824 | 7.539 | 8.351 | 5.666 |
| 卫生和社会工作 | 0.651 | 0.532 | 0.707 | 0.861 | 0.853 | 0.917 | 1.052 | 0.796 |
| 其他社区、社会和个人服务 | 2.039 | 1.894 | 2.628 | 3.387 | 3.187 | 3.464 | 4.198 | 2.971 |
| 总值 | 307.122 | 304.409 | 368.568 | 414.399 | 447.811 | 466.890 | 500.100 | - |
表4 2008—2014年世界主要国家国内碳排放量及碳减排情况Table 4 Domestic carbon emissions and carbon emission reductions of major countries in the world, 2008-2014 (MTCO2) |
| 国家 | 2008年 | 2009年 | 2010年 | 2011年 | 2012年 | 2013年 | 2014年 | GDP增速/% | 国内碳排 放增速/% | 碳减排率/% |
|---|---|---|---|---|---|---|---|---|---|---|
| 印度 | 1283.159 | 1417.592 | 1319.415 | 1312.425 | 1373.814 | 1322.495 | 1360.648 | 7.41 | 1.14 | 6.27 |
| 土耳其 | 208.164 | 203.267 | 200.965 | 204.467 | 210.483 | 214.411 | 205.224 | 5.17 | -0.20 | 5.37 |
| 波兰 | 253.089 | 237.298 | 240.207 | 249.257 | 236.644 | 219.192 | 234.468 | 3.32 | -1.12 | 4.44 |
| 中国 | 5165.275 | 5506.374 | 5284.847 | 5550.309 | 5829.530 | 6106.810 | 6375.425 | 7.42 | 3.63 | 3.79 |
| 墨西哥 | 313.087 | 309.963 | 300.788 | 301.497 | 295.841 | 285.423 | 300.997 | 2.80 | -0.61 | 3.41 |
| 葡萄牙 | 43.835 | 43.558 | 46.405 | 45.944 | 45.436 | 50.667 | 35.951 | 0.79 | -2.29 | 3.08 |
| 世界其他国家 | 6173.991 | 6044.129 | 6101.103 | 6010.432 | 6096.440 | 6173.339 | 6155.046 | 2.85 | -0.04 | 2.89 |
| 英国 | 360.793 | 346.520 | 335.556 | 348.759 | 351.563 | 361.517 | 365.716 | 2.61 | 0.27 | 2.34 |
| 美国 | 5323.996 | 4988.039 | 5242.480 | 5360.025 | 5275.860 | 5384.156 | 5426.799 | 2.45 | 0.38 | 2.07 |
| 澳大利亚 | 324.037 | 320.727 | 323.525 | 317.998 | 324.419 | 339.993 | 345.036 | 2.53 | 1.07 | 1.46 |
| 奥地利 | 33.219 | 31.502 | 31.796 | 32.183 | 31.329 | 31.868 | 32.148 | 0.66 | -0.51 | 1.17 |
| 丹麦 | 29.049 | 28.853 | 27.363 | 27.826 | 28.603 | 30.119 | 29.981 | 1.62 | 0.58 | 1.04 |
| 巴西 | 243.621 | 225.564 | 230.677 | 233.004 | 239.953 | 249.144 | 235.803 | 0.50 | -0.45 | 0.95 |
| 韩国 | 432.609 | 450.027 | 475.112 | 462.047 | 458.915 | 474.084 | 493.905 | 3.20 | 2.28 | 0.92 |
| 日本 | 897.050 | 847.848 | 854.219 | 865.151 | 873.940 | 895.630 | 884.914 | 0.37 | -0.19 | 0.56 |
| 意大利 | 329.202 | 288.639 | 308.922 | 297.052 | 309.822 | 308.260 | 323.684 | 0.11 | -0.06 | 0.17 |
| 加拿大 | 311.292 | 333.413 | 345.449 | 354.544 | 363.880 | 376.791 | 374.504 | 2.87 | 3.15 | -0.28 |
| 法国 | 203.602 | 198.221 | 207.691 | 211.126 | 214.808 | 223.073 | 226.180 | 0.96 | 1.80 | -0.84 |
| 俄罗斯 | 1269.456 | 1208.848 | 1305.973 | 1354.86 | 1379.658 | 1411.789 | 1406.224 | 0.74 | 1.79 | -1.05 |
| 比利时 | 44.755 | 46.704 | 48.419 | 51.426 | 50.586 | 54.947 | 52.572 | 1.25 | 2.82 | -1.57 |
| [1] |
佘群芝, 吴肖丽, 潘安. 气候资金对受援国碳排放的影响[J]. 资源科学, 2020,42(6):1015-1026.
[
|
| [2] |
李晖, 姜文磊, 唐志鹏. 全球贸易隐含碳净流动网络构建及社团发现分析[J]. 资源科学, 2020,42(6):1027-1039.
[
|
| [3] |
杨曦, 彭水军. 碳关税可以有效解决碳泄漏和竞争力问题吗? 基于异质性企业贸易模型的分析[J]. 经济研究, 2017,52(5):60-74.
[
|
| [4] |
|
| [5] |
|
| [6] |
|
| [7] |
|
| [8] |
|
| [9] |
马丽, 张琳. 国际制造业转移与碳转移的时空耦合效应[J]. 资源科学, 2017,39(12):2408-2419.
[
|
| [10] |
孟凡鑫, 苏美蓉, 胡元超, 等. 中国及“一带一路”沿线典型国家贸易隐含碳转移研究[J]. 中国人口·资源与环境, 2019,29(4):18-26.
[
|
| [11] |
|
| [12] |
邸玉娜. 欧盟对中国碳泄漏的测度与影响: 基于世界投入产出表的分析[J]. 资源科学, 2016,38(12):2307-2315.
[
|
| [13] |
|
| [14] |
张云, 刘枚莲, 王向进. 中国工业部门贸易开放与碳泄漏效应研究: 高低碳行业分类实证对比[J]. 华东师范大学学报(哲学社会科学版), 2019,51(6):151-161.
[
|
| [15] |
|
| [16] |
谭秀杰, 齐绍洲. 气候政策是否影响了国际投资和国际贸易: 京都承诺期碳泄漏实证研究[J]. 世界经济研究, 2014, ( 8):54-59.
[
|
| [17] |
|
| [18] |
高雪, 李惠民, 齐晔. 中美贸易的经济溢出效应及碳泄漏研究[J]. 中国人口·资源与环境, 2015,25(5):28-34.
[
|
| [19] |
孟国碧. 碳泄漏: 发达国家与发展中国家的规则博弈与战略思考[J]. 当代法学, 2017,31(4):38-49.
[
|
| [20] |
|
| [21] |
|
| [22] |
|
| [23] |
吕越, 包雅楠. 国内价值链长度与制造业企业创新: 兼论中国制造的“低端锁定”破局[J]. 中南财经政法大学学报, 2019, ( 3):118-127.
[
|
| [24] |
沈国兵, 于欢. 中国企业参与垂直分工会促进其技术创新吗?[J]. 数量经济技术经济研究, 2017,34(12):76-92.
[
|
| [25] |
张灿. 碳减排与汇率波动下的全球供应链采购策略研究[J]. 系统工程, 2019,37(2):58-69.
[
|
| [26] |
徐丽群. 低碳供应链构建中的碳减排责任划分与成本分摊[J]. 软科学, 2013,27(12):104-108.
[
|
| [27] |
|
| [28] |
|
| [29] |
|
| [30] |
|
| [31] |
邸玉娜. 中国碳密集型产业的出口战略研究: 基于欧盟碳泄漏的视角[J]. 软科学, 2016,30(11):29-33.
[
|
| [32] |
|
| [33] |
|
| [34] |
马风涛, 李俊. 中国制造业产品国内增加值分解及其生产长度研究[J]. 国际经济合作, 2019, ( 4):95-107.
[
|
| [35] |
赵凌云, 杨来科. 价值链生产长度与中国制造业的碳排放[J]. 技术经济, 2020,39(5):156-162.
[
|
| [36] |
张沁, 李继峰, 张亚雄. “十二五”时期我国面临的国际环境壁垒及应对策略: 征收碳出口税的可行性分析[J]. 国际贸易, 2010, ( 11):21-24.
[
|
| [37] |
陈滨霞, 周东海, 蒋远营. 我国经济增长与运输业的联动关系研究: 基于贝叶斯VAR方法[J]. 数理统计与管理, 2020,39(6):951-963.
[
|
| [38] |
高志军, 张萌, 邵晴晴 . 第三方物流嵌入全球供应链的系统协同演化机理[J/OL]. 系统科学学报, ( 2020 -11-24) [2021-01-02].https://kns.cnki.net/kcms/detail/14.1333.N.20201123.1340.042.html .
[
|
| [39] |
张慧芳, 艾天霞. 供需双侧结构性改革要素分析: 四大引擎与三驾马车协同发力[J]. 社会科学辑刊, 2017, ( 2):29-37.
[
|
| [40] |
孙耀华. 能源资源禀赋对碳排放的影响与传导机制: 基于空间计量模型的实证分析[J]. 商业研究, 2020, ( 6):65-74.
[
|
| [41] |
王帅. 中国能源使用绿色化、碳排放与经济增长的关系研究[J]. 软科学, 2020,34(10):7-11.
[
|
| [42] |
沈子荣. 中国单位GDP碳减排率的计算与比较[J]. 国际经济合作, 2011, ( 4):70-73.
[
|
/
| 〈 |
|
〉 |