
多情景视角下的中国碳达峰路径模拟——基于RICE-LEAP模型
|
洪竞科,男,四川成都人,教授,主要从事城市资源管理与政策研究。E-mail: hongjingke@cqu.edu.cn |
收稿日期: 2020-09-15
要求修回日期: 2021-01-31
网络出版日期: 2021-06-25
基金资助
国家自然科学基金项目(71801023)
重庆市青年拔尖人才特殊支持计划项目(T04010013)
版权
Simulating China's carbon emission peak path under different scenarios based on RICE-LEAP model
Received date: 2020-09-15
Request revised date: 2021-01-31
Online published: 2021-06-25
Copyright
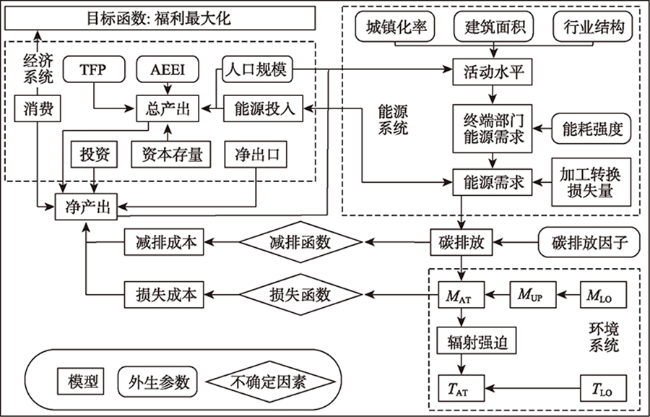
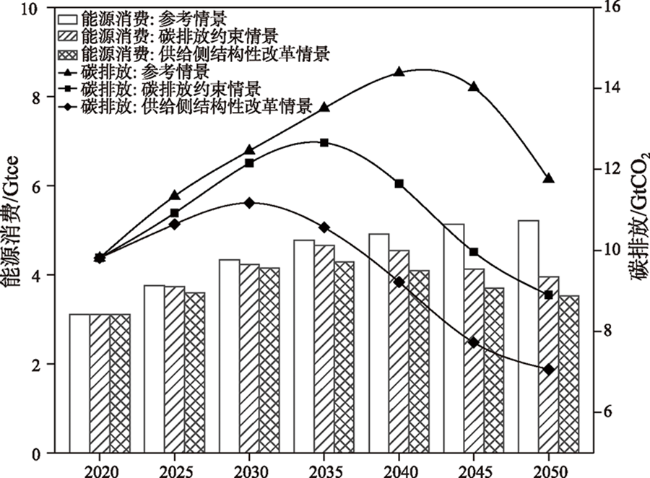
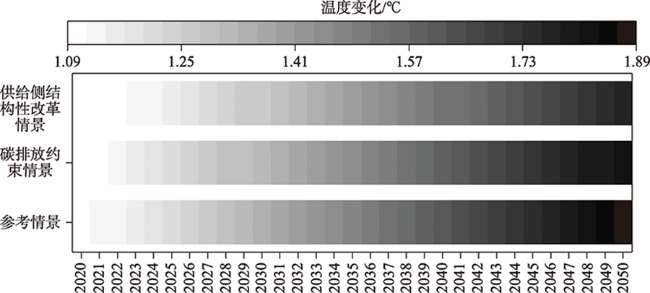
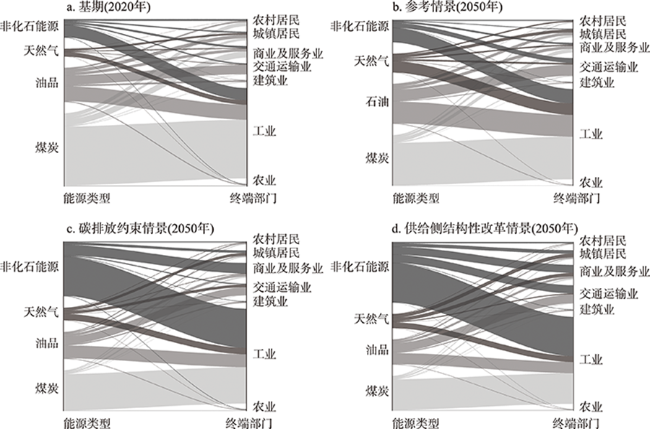
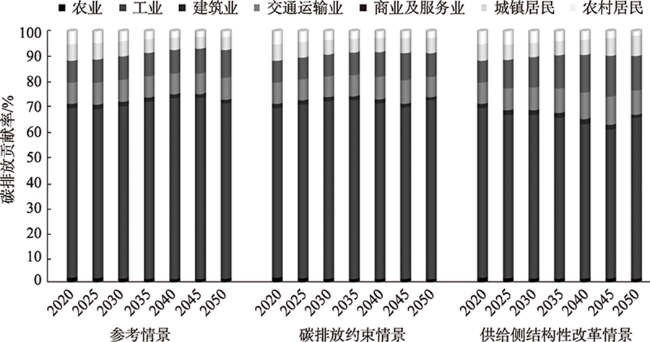
作为世界最大的碳排放国家与全球第二大经济体,实现CO2排放峰值是中国应对全球气候变化的挑战。本文通过耦合自上而下式模型和自下而上式模型,创新性地构建了包含中国终端部门的新型综合评估模型——RICE-LEAP模型,并通过设置参考情景、碳排放约束情景和供给侧结构性改革情景,动态模拟了2020—2050年的中国碳达峰路径及全球气候变化趋势。研究结果表明:①中国碳排放轨迹在3个动态情景中均呈“倒U型”曲线,其中,供给侧结构性改革情景下,中国碳排放峰值水平最低,并将于2029年最早达峰;②中国碳排放主要集中在工业和交通运输业等终端部门,其碳排放贡献可达80.00%,并保持相对稳定。此外,考察期内工业和交通运输业等终端部门的碳强度下降幅度相对较小;③供给侧结构性改革情景下,能源消费结构将迈入中高级形态。该情景下的所有终端部门非化石能源的消费占比均有所提高,商业及服务业部门和城镇居民部门等终端部门将形成以天然气和非化石能源为主的能源消费结构。因此,为实现中国碳排放尽早达峰,应强化政策导向,落实能源消费总量和强度“双控”目标,推动产业结构调整和能源结构优化的互进共驱。
洪竞科 , 李沅潮 , 蔡伟光 . 多情景视角下的中国碳达峰路径模拟——基于RICE-LEAP模型[J]. 资源科学, 2021 , 43(4) : 639 -651 . DOI: 10.18402/resci.2021.04.01
As the world's largest carbon emitter and second largest economy, achieving the carbon emission peak is urgent for China to combat with global climate change. By coupling the Regional Integrated model of Climate and the Economy (RICE) and Long-range Energy Alternative Planning (LEAP) model, this study established a new energy-economy-environment integrated assessment model covering end-use economic sectors. Under the business-as-usual, carbon-constraint, and supply-side structural reform scenarios, China's carbon emission peak path and global climate change trend from 2020 to 2050 were systematically investigated. The results reveal that: (1) China's energy-related carbon emission trajectory presents an inverted U shape under the three dynamic scenarios. Under the supply-side structural reform scenario, carbon emissions peak earliest, with the lowest carbon emission peak in comparison to other scenarios. (2) China's energy-related carbon emissions mainly concentrate in end-use sectors such as industry and transportation, where carbon emissions contribute approximately 80% in a stable manner during the whole investigated period. In addition, carbon intensity in these carbon-intensive sectors drops relatively slowly. (3) Energy structure becomes more optimized and advanced under the supply-side structural reform scenario, where the proportion of non-fossil energy consumption has increased in all end-use sectors, with natural gas and non-fossil energy dominating in the commerce and service industry and households. Therefore, in order to achieve China's carbon emission peak the soonest, the central government should adopt policy-oriented “dual control” goals for the total energy consumption and energy intensity, and make great efforts to adjust industrial structure and optimize energy structure by taking the supply-side structural reform as the main line.
表1 典型的面向中国治理水平的综合评估模型Table 1 Typical integrated assessment models for China's climate governance level |
| 模型名称 | 类型 | 特征 | 文献 |
|---|---|---|---|
| CE3METL | 自上而下 | 引入logistic技术模型,对能源技术的发展特征、相互替代行为及其内生机制的描述较为详尽。 | [21] |
| China TIMES | 自下而上 | 依托传统的能源系统优化模型向,能源需求预测模块和碳排放路径模拟模块扩展,以实现多部门局部均衡。 | [22] |
| PECE-LIU | 自下而上 | 以LEAP框架为基础,遵守能流过程,能够对能源的开采、加工、运输和最终使用的全过程进行系统仿真。 | [23] |
| EMRICES | 混合型 | 嵌入CGE模块以替代传统最优化模型中的柯布道格拉斯生产函数,从产业视角评估碳排放的相关政策及其减排效果。 | [24] |
| C3IAM | 混合型 | 耦合全球CGE模型和最优经济增长模型以扩展经济系统,同时实现了社会经济系统和地球系统之间的硬连接。 | [25] |
| IPAC | 混合型 | 是一个多模型框架,通过不同的建模方法或不同模型间的软连接,以关注不同的政策问题。 | [26] |
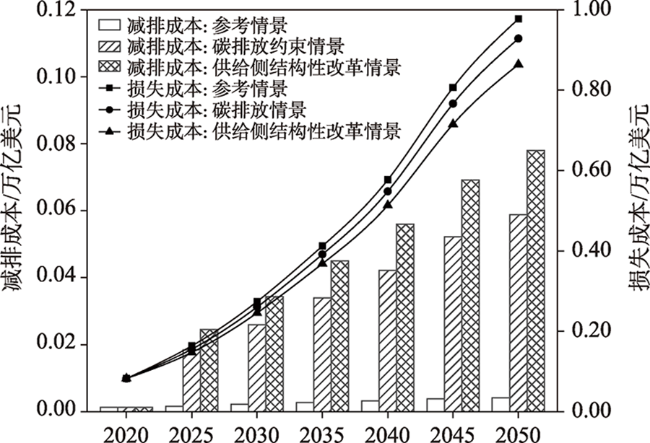
图2 不同情景下能源消费量及CO2排放量Figure 2 Energy consumption and carbon emissions under different scenarios |
表2 主要的宏观经济与技术参数Table 2 Major macroeconomic and technical parameters |
| 参数名称 | 数值 | 参数来源与说明 |
|---|---|---|
| 消费的边际弹性 | 1.450 | [34] |
| 初始的时间偏好率 | 0.015 | [34] |
| 年资本折旧率 | 0.050 | [34] |
| 资本份额 | 0.310 | [35] |
| 资本-劳动与能源间的替代弹性 | 0.400 | [35] |
| 初始的能源技术进步率 | 0.070 | [35] |
| 大气到表层海洋的碳流通系数 | 0.019 | [31] |
| 表层海洋到深层海洋的碳流通系数 | 0.0054 | [31] |
| 表层海洋到大气的碳流通系数 | 0.010 | [31] |
| 深层海洋到表层海洋的碳流通系数 | 0.00034 | [31] |
| 温度变化参数 | 0.037 | [31] |
| 大气温度降低速率 | 0.047 | [31] |
| 大气到海洋的热传导系数 | 0.010 | [31] |
| 海洋到大气的热传导系数 | 0.00048 | [31] |
表3 不同情景下的能源系统参数Table 3 Parameters of energy system under different scenarios |
| 参数 | 基准年 | 参考情景 | 碳排放约束情景 | 供给侧结构性改革情景 | |||||||||
|---|---|---|---|---|---|---|---|---|---|---|---|---|---|
| 2020年 | 2030年 | 2050年 | 2030年 | 2050年 | 2030年 | 2050年 | |||||||
| 产业结构/% | 农业 | 6.94 | 5.20 | 5.00 | 5.20 | 5.00 | 5.20 | 5.00 | |||||
| 工业 | 31.80 | 30.86 | 22.05 | 30.86 | 22.05 | 26.30 | 18.40 | ||||||
| 建筑业 | 7.34 | 9.74 | 7.05 | 9.74 | 7.05 | 8.50 | 6.30 | ||||||
| 交通运输业 | 4.20 | 4.20 | 4.00 | 4.20 | 4.00 | 4.40 | 3.50 | ||||||
| 商业及服务业 | 49.72 | 50.00 | 61.90 | 50.00 | 61.90 | 55.60 | 66.80 | ||||||
| 城镇化率/% | 62.00 | 70.00 | 80.00 | 70.00 | 80.00 | 67.00 | 75.00 | ||||||
| 人均居住面积/(m2/人) | 城镇居民 | 35.19 | 36.10 | 40.00 | 36.10 | 40.00 | 34.10 | 36.10 | |||||
| 农村居民 | 45.57 | 50.00 | 52.80 | 50.00 | 52.80 | 46.10 | 47.30 | ||||||
| 能源强度年均增长率/%a | 农业 | 0.81 | -1.89 | -4.15 | -3.77 | -4.15 | -3.77 | -4.15 | |||||
| 工业 | 6.57 | -1.03 | -3.58 | -2.05 | -2.33 | -2.05 | -2.33 | ||||||
| 建筑业 | 0.81 | -2.30 | -5.05 | -4.59 | -5.05 | -4.59 | -5.05 | ||||||
| 交通运输业 | 6.76 | -1.66 | -3.69 | -3.32 | -3.69 | -3.32 | -3.69 | ||||||
| 商业及服务业 | 0.55 | -1.93 | -4.24 | -3.85 | -4.24 | -3.85 | -4.24 | ||||||
| 城镇居民 | 11.46 | -0.03 | -0.02 | -0.09 | -0.05 | -0.09 | -0.05 | ||||||
| 农村居民 | 9.58 | 0.21 | 0.06 | 0.08 | 0.04 | 0.08 | 0.04 | ||||||
注: a. 基准年中,农业、工业、建筑业、交通运输业和商业及服务业等终端部门能源强度单位为tce/万美元;而城镇居民和农村居民等终端部门的能源强度单位为kgce/m2。 |
表4 不同情景下中国不同终端部门碳强度(tC/万美元)Table 4 Carbon intensity of China's end-use sectors under different scenarios (tC/104USD) |
| 终端部门 | 基准年 | 参考情景 | 碳排放约束情景 | 供给侧结构性改革情景 | ||||||||
|---|---|---|---|---|---|---|---|---|---|---|---|---|
| 2020年 | 2030年 | 2050年 | 2030年 | 2050年 | 2030年 | 2050年 | ||||||
| 农业 | 0.44 | 0.33 | 0.21 | 0.32 | 0.14 | 0.29 | 0.13 | |||||
| 工业 | 3.69 | 2.55 | 1.70 | 2.40 | 1.31 | 2.24 | 0.98 | |||||
| 建筑业 | 0.45 | 0.32 | 0.17 | 0.30 | 0.10 | 0.33 | 0.10 | |||||
| 交通业 | 3.63 | 2.74 | 1.93 | 2.65 | 1.34 | 2.55 | 1.23 | |||||
| 商业及服务业 | 0.29 | 0.18 | 0.08 | 0.17 | 0.05 | 0.17 | 0.05 | |||||
| [1] |
国际能源署. 世界能源展望2019[R/OL].(2019-11-13) [2020-09-15]. https://www.iea.org/reports/world-energy-outlook-2019.
[
|
| [2] |
中国政府网. 中美气候变化联合声明[EB/OL]. ( 2014- 11- 125) [2020-09-15]. http://politics.people.com.cn/n/2014/1112/c70731-26010508.html.
[China Government Website. Joint U.S.-China Statement on Climate Change[EB/OL]. (2013-04-13) [2020-09-15].http://politics.people.com.cn/n/2014/1112/c70731-26010508.html .]
|
| [3] |
国家发改委. 强化应对气候变化行动: 中国国家自主贡献 [N/OL]. ( 2015- 11- 18) [2018-04-07].
[National Development Reform Commission. Strengthening Climate Change Adaptation: China's National Determined Contributions [N/OL]. (2015-11-18) [2018-04-07]. http://www.scio.gov.cn/xwfbh/xwbfbh/wqfbh/2015/20151119/xgbd33811/Document/1455864/-1455864.htm .]
|
| [4] |
国务院. “十三五”控制温室气体排放工作方案[EB/OL]. ( 2016- 10- 27) [2020-09-15].
[The State Council. 13th Five Year Plan for Controlling Greenhouse Gas Emissions[EB/OL]. (2016-10-27) [ 2020-09-15]. http://www.gov.cn/zhengce/content/2016-11/04/content_5128619.htm .]
|
| [5] |
|
| [6] |
|
| [7] |
|
| [8] |
|
| [9] |
|
| [10] |
|
| [11] |
|
| [12] |
|
| [13] |
|
| [14] |
|
| [15] |
|
| [16] |
|
| [17] |
|
| [18] |
|
| [19] |
|
| [20] |
王勇, 王恩东, 毕莹. 不同情景下碳排放达峰对中国经济的影响: 基于CGE模型的分析[J]. 资源科学, 2017,39(10):1896-1908.
[
|
| [21] |
莫建雷, 段宏波, 范英, 等. 《巴黎协定》中我国能源和气候政策目标:综合评估与政策选择[J]. 经济研究, 2018,53(9):168-181.
[
|
| [22] |
马丁, 陈文颖. 基于中国TIMES模型的碳排放达峰路径[J]. 清华大学学报(自然科学版), 2017,57(10):1070-1075.
[
|
| [23] |
刘俊伶, 项启昕, 王克, 等. 中国建筑部门中长期低碳发展路径[J]. 资源科学, 2019,41(3):509-520.
[
|
| [24] |
刘昌新, 王铮, 黄蕊. EMRICES: 气候变化经济学集成评估平台[M]. 北京: 科学出版社, 2016.
[
|
| [25] |
|
| [26] |
|
| [27] |
佘群芝, 吴肖丽, 潘安. 气候资金对受援国碳排放的影响[J]. 资源科学, 2020,42(6):1015-1026.
[
|
| [28] |
段宏波, 朱磊, 范英. 中国碳捕获与封存技术的成本演化和技术扩散分析: 基于中国能源经济内生技术综合模型[J]. 系统工程理论与实践, 2015,35(2):333-341.
[
|
| [29] |
王铮, 吴静, 刘昌新, 等. 气候变化经济学集成评估模型[M]. 北京: 科学出版社, 2015.
[
|
| [30] |
|
| [31] |
|
| [32] |
|
| [33] |
龚瑶, 严婷. 技术冲击、碳排放与气候环境: 基于DICE模型框架的模拟[J]. 中国管理科学, 2014,22:801-809.
[
|
| [34] |
|
| [35] |
|
| [36] |
|
| [37] |
国际能源署. 世界能源展望: 中国特别报告[R/OL].(2017-12-08) [2020-11-15]. https://www.iea.org/reports/world-energy-outlook-2017 .
[
|
| [38] |
马丁, 陈文颖. 中国2030年碳排放峰值水平及达峰路径研究[J]. 中国人口·资源与环境, 2016,26(5):1-4.
[
|
| [39] |
中国石油经济技术研究院. 2050 年世界与中国能源展望(2019版)[R/OL]. (2019-08-22) [2020-09-15]. https://mp.weixin.qq.com/s/SMYndf-G9ZKNiy9UjrxyTw .
[China Petroleum Institute of Economics and Technology. Energy Outlook of the World and China in 2050(2019)[R/OL].(2019-08-22) [2020-09-15].https://mp.weixin.qq.com/s/SMYndf-G9ZKNiy9UjrxyTw .
|
/
| 〈 |
|
〉 |