
中国城乡差距对农地违法非农化的影响
|
王青,女,江苏仪征人,博士,副教授,研究方向为资源管理与公共政策。E-mail: wangqing@njupt.edu.cn |
收稿日期: 2019-05-21
要求修回日期: 2019-08-11
网络出版日期: 2019-12-25
基金资助
教育部人文社会科学研究青年基金项目(16YJC630122)
国家自然科学基金项目(41671171)
版权
Impact of urban-rural gap on illegal farmland conversion in China
Received date: 2019-05-21
Request revised date: 2019-08-11
Online published: 2019-12-25
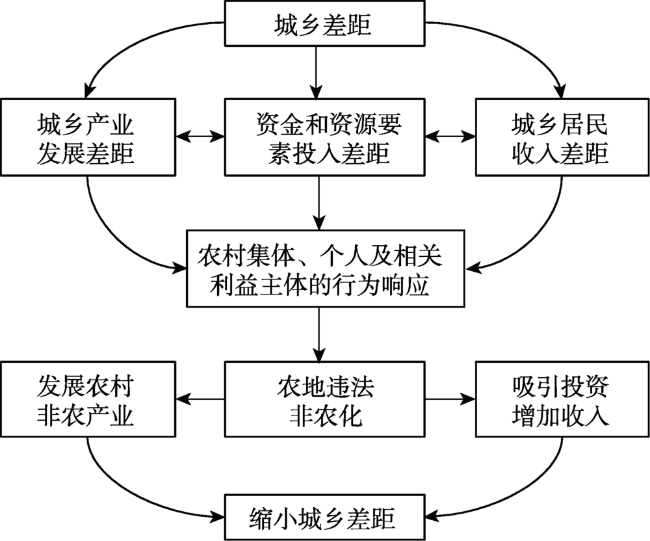
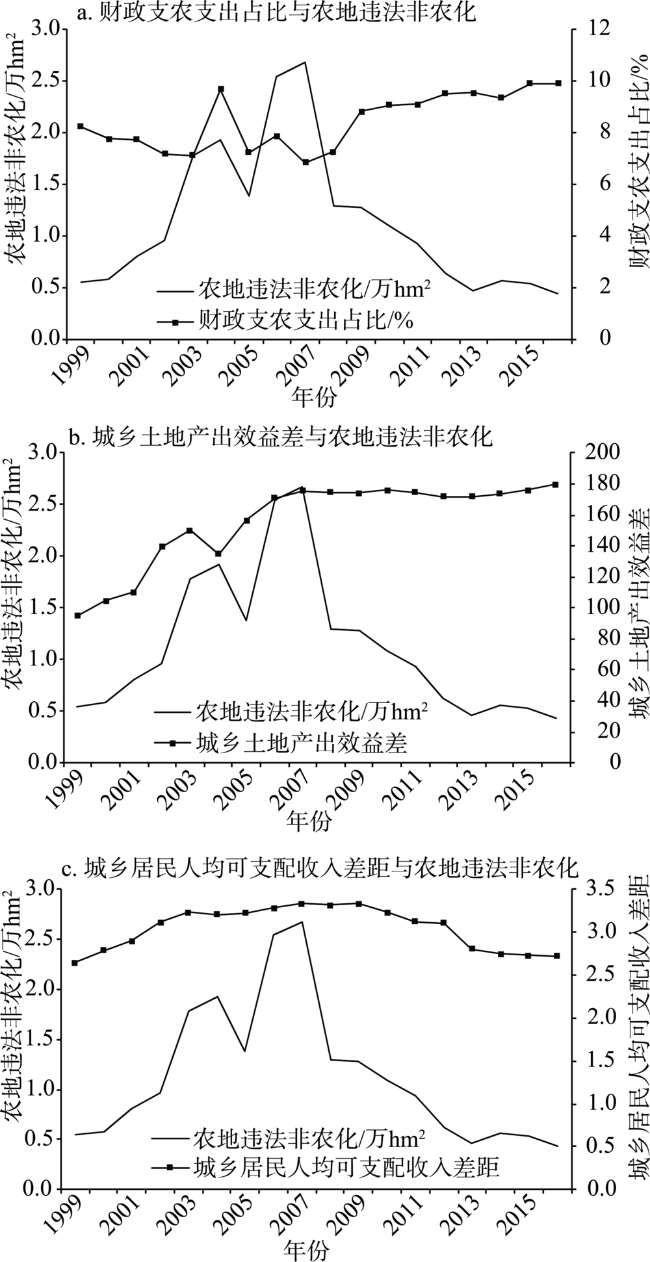
城乡差距对于农村土地利用特别是农地违法非农化有着不可忽视的影响。本文首先从理论层面探讨了城乡差距对农地违法非农化的影响机理;在此基础上通过构建计量模型,并运用1999—2016年中国大陆31个省(市、区)的面板数据,进行了系统的实证检验。结果显示:城乡差距扩大会导致农地违法非农化规模显著增长,尤其是随着财政支农支出占比的下降和城乡居民人均可支配收入差距的扩大,农地违法非农化规模增幅明显。具体地,在省级层面,财政支农支出占比每下降一个百分点,农地违法非农化规模会增加近25 hm 2;城乡居民人均可支配收入差距每扩大10%,农地违法非农化规模也会增加约15 hm 2;而城乡土地产出效益差的扩大对农地违法非农化的影响则小得多。此外,在不同经济发展地区(或不同经济发展阶段),城乡差距变化对农地违法非农化的影响存在显著差异。最后从有效遏制农地违法非农化的角度,针对性地提出了缩小城乡差距的相关路径和建议。
王青 , 陈志刚 . 中国城乡差距对农地违法非农化的影响[J]. 资源科学, 2019 , 41(12) : 2274 -2283 . DOI: 10.18402/resci.2019.12.11
Urban-rural gap has a wide and far-reaching impact on China’s economic and social development. This study first explored the influencing mechanisms of urban-rural gap on illegal farmland conversion in theory, then an econometric model was built to test the impacts of China’s urban-rural gap change on illegal farmland conversion using the panel data of China’s mainland during 1999 to 2016. The results show that the widening gap between urban and rural areas led to a significant increase in the scale of illegal farmland conversion. Especially with the decrease of the proportion of financial support for agriculture and rural development, and the widening gap of per capita disposable income between urban and rural residents, the scale of illegal farmland conversion increased significantly. At the provincial level, for every 1% reduction in the proportion of financial support for agriculture and rural development, the scale of illegal farmland conversion increased by nearly 25 hm 2. For every 10% increase in the per capita disposable income gap between urban and rural residents, the scale of illegal farmland conversion increased by nearly 15 hm 2. The widening gap between urban and rural land output has a much smaller impact on illegal farmland conversion. Furthermore, in different areas (or stages) of economic development, there are significant differences in the impact of urban-rural gap changes on illegal farmland conversion. At the end of this article, from the perspective of effectively curbing the illegal conversion of farmland, we put forward some relevant approaches and suggestions to narrow the urban-rural gap.
表1 模型中各变量的描述统计值Table 1 Descriptive statistics of variables in the model |
| 变量 | 样本量 | 平均值 | 标准差 | 最小值 | 最大值 |
|---|---|---|---|---|---|
| IFC | 558 | 365.976 | 602.516 | 0.000 | 5561.240 |
| INV | 558 | 7223.037 | 8733.038 | 53.557 | 53322.938 |
| DPEO | 558 | 26.348 | 111.936 | -859.000 | 1372.000 |
| LAND | 558 | 1678.517 | 1004.334 | 82.421 | 4436.117 |
| PLC | 558 | 0.556 | 0.497 | 0.000 | 1.000 |
| AOF | 558 | 9.180 | 3.368 | 2.133 | 18.966 |
| DLE | 558 | 300.732 | 861.046 | 14.280 | 6369.370 |
| DUR | 558 | 2.936 | 0.636 | 1.845 | 5.605 |
表2 全国范围模型估计结果Table 2 Estimated results of the nationwide model |
| IFC | 模型1 | 模型2 | 模型3 | 模型4 | 模型5 | 模型6 |
|---|---|---|---|---|---|---|
| C | -367.213 (261.276) | -268.495 (243.622) | -359.419 (261.832) | 1193.541*** (338.435) | -319.962 (278.789) | 1011.746*** (343.499) |
| INV | — | 0.022*** (0.007) | — | — | — | 0.025*** (0.009) |
| INV 2 | — | -1.14e-06*** (1.79e-07) | — | — | — | -1.08e-06*** (1.93e-07) |
| DPEO | — | — | -0.108 (0.196) | — | — | -0.095 (0.178) |
| LAND | — | — | — | -11.157*** (1.627) | — | -8.599*** (1.645) |
| PLC | — | — | — | — | 33.308 (68.194) | 56.368 (75.060) |
| AOF | -26.069*** (8.746) | -18.485* (10.744) | -26.081*** (8.752) | -13.042 (8.598) | -31.457** (14.083) | -24.395* (12.891) |
| DLE | 0.219*** (0.093) | 0.168** (0.087) | 0.218** (0.093) | 0.134 (0.090) | 0.214** (0.093) | 0.108 (0.087) |
| DUR | 308.816*** (74.460) | 252.216*** (69.983) | 307.244*** (74.564) | 170.406** (74.188) | 303.760*** (75.230) | 149.617** (72.187) |
| N | 558 | 558 | 558 | 558 | 558 | 558 |
| R2 | 0.063 | 0.190 | 0.064 | 0.140 | 0.063 | 0.233 |
| F | 11.73 | 24.56 | 8.86 | 21.33 | 8.84 | 19.69 |
注:均为固定效应模型估计结果。括号中数据是标准差,*、**、***分别表示10%、5%和1%的显著性水平。 |
表3 不同经济发展地区模型估计结果Table 3 Estimated results of the models in different areas of economic development |
| IFC | 发达地区 | 欠发达地区 | |||
|---|---|---|---|---|---|
| 估计系数 | 标准差 | 估计系数 | 标准差 | ||
| C | 1065.230** | 539.474 | 770.128* | 469.130 | |
| INV | 0.047*** | 0.015 | 0.024* | 0.013 | |
| INV 2 | -1.37e-06*** | 2.81e-07 | -1.25e-06*** | 3.89e-07 | |
| DPEO | -0.074 | 0.239 | -0.043 | 0.280 | |
| LAND | -8.455*** | 2.143 | -8.375*** | 2.802 | |
| PLC | 33.110 | 120.522 | 42.321 | 95.916 | |
| AOF | -82.786*** | 25.276 | -6.171 | 14.577 | |
| DLE | -0.276 | 0.597 | 0.065 | 0.080 | |
| DUR | 358.938** | 153.069 | 102.483 | 78.485 | |
| N | 270 | 288 | |||
| R2 | 0.299 | 0.173 | |||
| F | 13.15 | 6.90 | |||
注:均为固定效应模型估计结果。 |
| [1] |
国土资源部. 中国国土资源年鉴2000-2004[M]. 北京: 中华人民共和国国土资源部, 2000- 2004.
[ Resources. China Land & Resources Almanac 2000-2004[M]. Beijing: Ministry of Land and Resources of China, 2000- 2004.]
|
| [2] |
国土资源部. 中国国土资源统计年鉴2005-2017[M]. 北京: 地质出版社, 2006- 2018.
[ Ministry of Land and Resources. China Land & Resources Statistical Yearbook 2005-2017[M]. Beijing: Geological Publishing House, 2006- 2018.]
|
| [3] |
国土资源部执法监察局. 国土资源违法行为查处工作规程[M]. 北京: 地质出版社, 2014.
[ Bureau of Law Enforcement and Supervision of Ministry of Land and Resources of China. Working Rules for Investigating and Punishing Illegal Behaviors of Land and Resources Use[M]. Beijing: Geological Publishing House, 2014.]
|
| [4] |
徐红新, 高国忠, 王楚琛 . 农村土地违法行为: 现状、原因与对策[J]. 河北大学学报(哲学社会科学版), 2012,37(4):127-131.
[
|
| [5] |
王良健, 龚星文, 朱石牛 . 土地违法现象的省际差异及其动态分析[J]. 资源科学, 2014,36(7):1336-1346.
[
|
| [6] |
严金海, 李鹏程, 章国宝 . 地方政府土地违法的基本特征与行为逻辑[J]. 天津商业大学学报, 2017,37(2):15-20.
[
|
| [7] |
范建双, 任逸蓉 . 违法用地对土地可持续集约利用的影响机制及效应研究[J]. 中国土地科学, 2018,32(3):52-58.
[
|
| [8] |
|
| [9] |
龙开胜, 陈利根 . 中国土地违法现象的影响因素分析: 基于1999年-2008年省际面板数据[J]. 资源科学, 2011,33(6):1171-1177.
[
|
| [10] |
镇风华, 舒帮荣, 李永乐 , 等. 20世纪90年代以来不同时段经济增长与土地违法关系再审视: 基于省级面板数据的格兰杰因果检验[J]. 华中农业大学学报(社会科学版), 2016, ( 5):116-124.
[
|
| [11] |
王青, 陈志刚 . 区域经济发展不平衡与土地违法: 基于地方政府经济增长激励的视角[J]. 中国土地科学, 2019,33(1):32-39.
[
|
| [12] |
张绍阳, 刘琼, 欧名豪 . 地方政府土地违法: 财政激励还是引资激励?[J]. 中国人口·资源与环境, 2017,27(8):115-121.
[
|
| [13] |
|
| [14] |
廖宏斌 . 土地违法:一个政府行为的组织制度分析[J]. 华中师范大学学报(人文社会科学版), 2017,56(4):11-17.
[
|
| [15] |
张耀宇, 陈会广, 林奕冉 . 土地违法行为是一种“堤内损失堤外补”的策略吗? 基于审批约束与效率损失的研究视角[J]. 上海财经大学学报, 2017,19(6):60-71.
[
|
| [16] |
唐鹏, 石晓平, 曲福田 . 政府管制、土地违法与土地财政[J]. 中国土地科学, 2018,32(7):15-21.
[
|
| [17] |
龙开胜, 杜薇 . 中央和地方政府农地转用审批动力机制及其差异[J]. 资源科学, 2017,39(2):188-197.
[
|
| [18] |
|
| [19] |
王德文, 何宇鹏 . 城乡差距的本质、多面性与政策含义[J]. 中国农村观察, 2005, ( 3):25-37.
[
|
| [20] |
国家统计局. 中国统计年鉴2000-2017[M]. 北京: 中国统计出版社, 2001- 2018.
[ National Bureau of Statistics of China. China Statistical Yearbook 2000-2017[M]. Beijing: China Statistics Press, 2001- 2018.]
|
| [21] |
徐振宇, 赵天宇, 朱鹤 . 居民基本权利差异对城乡差距的影响: 来自中国省级面板数据的实证证据[J]. 财贸经济, 2015, ( 1):90-104.
[
|
| [22] |
|
| [23] |
|
| [24] |
|
| [25] |
陆铭, 陈钊, 杨真真 . 平等与增长携手并进: 收益递增、策略性行为和分工的效率损失[J]. 经济学(季刊), 2007,6(2):443-468.
[
|
| [26] |
|
| [27] |
胡联合, 胡鞍钢, 徐绍刚 . 贫富差距对违法犯罪活动影响的实证分析[J]. 管理世界, 2005, ( 6):34-44.
[
|
| [28] |
马潇萌 . 中国城乡差距对城乡居民健康不平等的影响[J]. 城市问题, 2016, ( 11):4-12.
[
|
| [29] |
冯婧, 陈志鸿 . 城乡差距对城乡居民主观幸福感影响的实证研究[J]. 中国人口·资源与环境, 2015,25(11):150-153.
[
|
| [30] |
理查德·威尔金森, 凯特·皮克特 . 不平等的痛苦: 收入差距如何导致社会问题[M]. 安鹏, 译. 北京: 新华出版社, 2010.
[
|
| [31] |
卢建新, 赵渊, 张道阳 . 土地违法的政治周期效应[J]. 海南大学学报(人文社会科学版), 2017,35(2):85-92.
[
|
| [32] |
张彩萍, 周国锋, 黎秋阳 , 等. 土地三级动态巡查对土地违法行为遏制效果评价: 以常州市为例[J]. 南京师大学报(自然科学版), 2017,40(3):144-150.
[
|
| [33] |
|
/
| 〈 |
|
〉 |