
市域人口老龄化空间特征与养老资源匹配关系研究——以东北三省为例
作者简介:赵东霞,女,黑龙江哈尔滨人,博士,副教授,硕士生导师,主要从事人口地理与区域可持续发展研究。E-mail:zhaodx99@126.com
收稿日期: 2017-09-15
要求修回日期: 2018-07-03
网络出版日期: 2018-09-14
基金资助
国家自然科学基金青年科学基金项目(41601136)
Study on the relationship between the spatial feature of urban population aging and the pension resources matching ——take the three provinces of the Northeast China as an example
Received date: 2017-09-15
Request revised date: 2018-07-03
Online published: 2018-09-14
Copyright
当老龄化先于经济发展时,老年人口养老资源配置问题会不断凸显。东北三省属于中度老龄化区,研究老年人口空间分布特征与养老资源优化配置将具有国家战略意义和示范效应。通过选取34个地级市和2个行政区作为研究对象,根据老年人口统计数据,基于空间自相关模型分析3个年份的市域人口老龄化时空演变特征,运用综合指数模型评价2015年36个对象的养老资源配置,依据地理集中度表示36个对象老年人口与养老资源的空间匹配关系。研究结果表明:2005年、2010年和2015年市域人口老龄化程度正逐渐加深,高密度地区范围扩大并由西南部向东北部推进,空间关联性特征仍在加强,高集聚区由南向北扩大,东北未来人口老龄化“稀释”面临严峻挑战;区域中心城市和政策扶持型城市的养老资源比区位边缘城市的丰富;老年人口和养老资源空间分布有明显的关联性,老年人口集中度和养老资源集中度都自南向北降低,其中辽宁省全境既是老年人口集中地区又是养老资源集中地区;匹配关系具有南北梯度差异,“辽中南”城市群发展水平明显高于“哈长”城市群;大多数城市仍面临养老资源浪费或供给不足的两级问题。
赵东霞 , 韩增林 , 任启龙 , 刘万波 , 裴倩 . 市域人口老龄化空间特征与养老资源匹配关系研究——以东北三省为例[J]. 资源科学, 2018 , 40(9) : 1773 -1786 . DOI: 10.18402/resci.2018.09.08
With the population aging being ahead of economic development, the problem of pension resources configuration among aging population will stand out continually. The three provinces in the northeast of China are the moderate districts of aging. It is noted that there are national strategic meanings and demonstration effects to study the spatial distribution feature of aging population and the optimal configuration of pension resources. Taking 34 prefecture level cities and 2 administrative areas as the research objects, the spatial evolution features of population aging in the administrative regions in the 3 major years were characterized, based on the spatial autocorrelation analysis according to the statistical data of aging population. The pension resources configuration of 36 objects in 2015 were evaluated by using comprehensive index model and the spatial matching relationship between 36 groups’ aged people and pension resources was identified on the basis of geographic concentration. The results demonstrated that the degree of population aging in the administrative regions in 2005, 2010, and 2015 were deepening gradually. The high density areas were expanding from the southwest to the northeast and the spatial correlation features are enhancing; the high agglomeration areas were widening from the south to the north; and the “dilution” of population aging in the northeast in the future will face severe challenges. The pension resources in regional center cities and the cities with the government’s supports are richer than the peripheral cities. There is an obvious correlation of spatial distribution between aging population and pension resources. The concentration of aging population and pension resources is reduced from the south to the north. Among them, the whole area of Liaoning Province is both a concentrated area of aging population and pension resources. There is a diverse matching relationship between the south and the north, and the development level of the ‘Liaozhongnan’ urban agglomeration is significantly higher than that of the ‘Ha-Chang’ urban agglomeration. The most cities still face the two extreme problem, i. e. , a waste of and a short of pension resources.
Table 1 Type of pension resources and the corresponding indicators表1 养老资源类别及相应指标 |
| 资源类别 | 相应指标 | 资源类别 | 相应指标 |
|---|---|---|---|
| 生活服务 | 每万人拥有社区养老服务设施数 | 文体活动 | 每万人拥有老年大学数 |
| 每万人拥有社会养老机构床位数 | 每万人拥有文体机构数 | ||
| 每万人拥有服务业人员数 | 每万人拥有文体服务人员数 | ||
| 基本养老保险参保人数 | |||
| 医疗保健 | 每万人拥有卫生机构数 | 居住环境 | 人均享有清扫保洁面积 |
| 每万人拥有医院床位数 | 人均公共绿地面积 | ||
| 每万人拥有卫生技术人员数 | 人均公园绿地面积 | ||
| 基本医疗保险参保人数 |
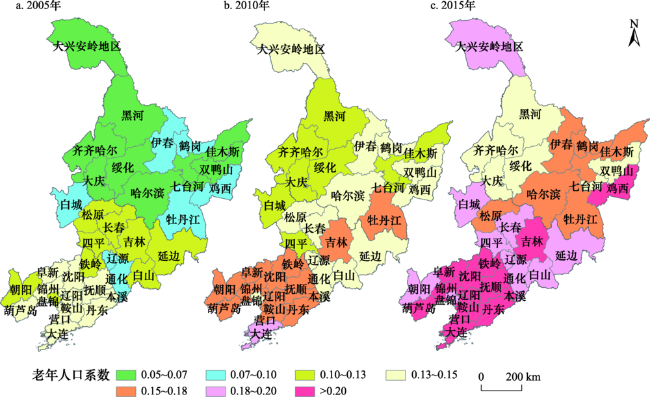
Figure 1 Characteristics of aging in cities of the three provinces in Northeast China,in 2005,2010 and 2015图1 2005年、2010年、2015年东北三省各城市老龄化特征 |
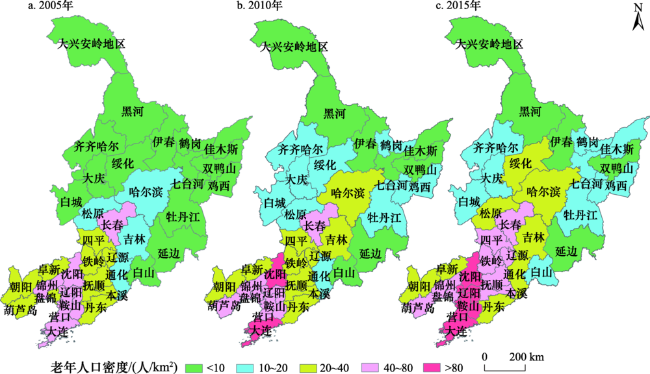
Figure 2 Density distribution of elderly population in cities of the three provinces in Northeast China,in 2005,2010 and 2015图2 2005年、2010年、2015年东北三省各城市老年人口密度分布 |
Table 2 Global Moran´s I estimates of urban aging in three provinces in Northeast China表2 东北三省城市老龄化的全局Moran´s I估计值 |
| Moran´s I | Z(I) | P值 | |
|---|---|---|---|
| 2005年 | 0.614 | 11.562 | < 0.000 |
| 2010年 | 0.441 | 8.500 | < 0.000 |
| 2015年 | 0.569 | 10.823 | < 0.000 |
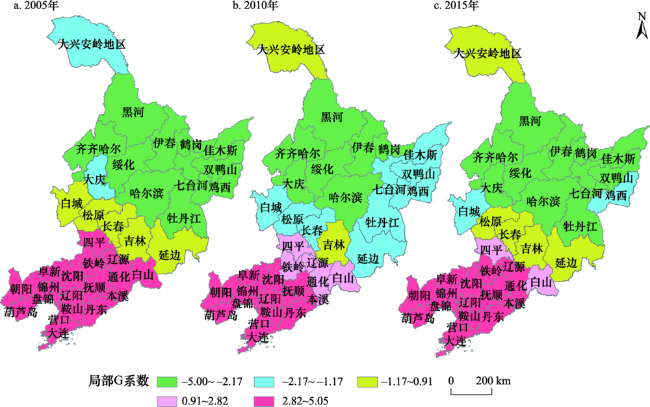
Figure 3 Evolution of spatial pattern of urbanization aging in cities of the three provinces in Northeast China,in 2005,2010 and 2015图3 2005年、2010年、2015年东北三省各城市老龄化空间格局演变 |
Table 3 Composite index and classification of endowment resources of various cities of the three provinces in Northeast China ,in 2015 (Household registration population) (指数(排名))表3 2015年东北三省各城市养老资源综合指数及分类排名(户籍人口) |
| 城市 | 生活服务 | 医疗保健 | 文体活动 | 居住环境 | 养老资源综合 |
|---|---|---|---|---|---|
| 沈阳 | 0.225(7) | 0.628(1) | 0.336(14) | 0.368(6) | 0.390(4) |
| 大连 | 0.126(13) | 0.561(3) | 0.352(13) | 0.228(17) | 0.317(8) |
| 鞍山 | 0.436(3) | 0.415(11) | 0.148(30) | 0.254(14) | 0.313(9) |
| 铁岭 | 0.104(18) | 0.222(31) | 0.039(36) | 0.126(26) | 0.123(33) |
| 阜新 | 0.300 (5) | 0.326(19) | 0.266(19) | 0.145(25) | 0.259(20) |
| 抚顺 | 0.212(9) | 0.270(28) | 0.277(17) | 0.169(21) | 0.232(22) |
| 本溪 | 0.066(23) | 0.309(23) | 0.167(28) | 0.416(5) | 0.239(21) |
| 丹东 | 0.060(25) | 0.256(30) | 0.144(31) | 0.103(30) | 0.141(32) |
| 辽阳 | 0.440(2) | 0.336(17) | 0.186(27) | 0.152(24) | 0.278(13) |
| 营口 | 0.106(17) | 0.313(22) | 0.235(23) | 0.094(31) | 0.187(28) |
| 盘锦 | 0.069(22) | 0.479(8) | 0.549(5) | 0.233(16) | 0.332(7) |
| 葫芦岛 | 0.222(8) | 0.319(21) | 0.130(32) | 0.204(19) | 0.218(24) |
| 锦州 | 0.515(1) | 0.154(35) | 0.266(18) | 0.168(22) | 0.276(14) |
| 朝阳 | 0.112(16) | 0.417(9) | 0.096(34) | 0.035(34) | 0.165(29) |
| 长春 | 0.117(14) | 0.482(7) | 0.754(2) | 0.261(13) | 0.403(3) |
| 吉林 | 0.045(28) | 0.385(14) | 0.188(26) | 0.160(23) | 0.194(25) |
| 延边地区 | 0.172(12) | 0.385(15) | 0.439(8) | 0.222(18) | 0.304(10) |
| 白山 | 0.039(31) | 0.529(6) | 0.431(9) | 0.074(32) | 0.268(16) |
| 四平 | 0.018(35) | 0.218(32) | 0.092(35) | 0.017(35) | 0.086(35) |
| 松原 | 0.085(21) | 0.26(29) | 0.295(16) | 0.279(11) | 0.230(23) |
| 白城 | 0.057(26) | 0.179(34) | 0.215(24) | 0.125(27) | 0.144(31) |
| 通化 | 0.040(30) | 0.306(25) | 0.305(15) | 0.105(29) | 0.189(27) |
| 辽源 | 0.038(32) | 0.208(33) | 0.111(33) | 0.068(33) | 0.106(34) |
| 哈尔滨 | 0.103(19) | 0.565 (2) | 0.690 (3) | 0.310 (10) | 0.417 (2) |
| 大兴安岭地区 | 0.116(15) | 0.405(12) | 0.667(4) | 无数据 | 无数据 |
| 黑河 | 0.012(36) | 0.297(26) | 0.411(10) | 0.447 (4) | 0.292(12) |
| 鹤岗 | 0.193(10) | 0.548 (4) | 0.406(12) | 0.318 (8) | 0.366 (6) |
| 双鸭山 | 0.096(20) | 0.416(10) | 0.242(21) | 0.313 (9) | 0.267(17) |
| 七台河 | 0.036(33) | 0.331(18) | 0.532(6) | 0.273(12) | 0.293(11) |
| 鸡西 | 0.284(6) | 0.326(20) | 0.252(20) | 0.187(20) | 0.262(19) |
| 牡丹江 | 0.050(27) | 0.403(13) | 0.237(22) | 0.365 (7) | 0.263(18) |
| 佳木斯 | 0.183(11) | 0.285(27) | 0.159(29) | 0.450 (3) | 0.269(15) |
| 伊春 | 0.042(29) | 0.348(16) | 0.526(7) | 0.603 (2) | 0.380 (5) |
| 绥化 | 0.066(24) | 0.033(36) | 0.408(11) | 0.109(28) | 0.154(30) |
| 齐齐哈尔 | 0.033(34) | 0.308(24) | 0.198(25) | 0.239(15) | 0.194(26) |
| 大庆 | 0.320(4) | 0.540 (5) | 0.771(1) | 0.822 (1) | 0.613 (1) |
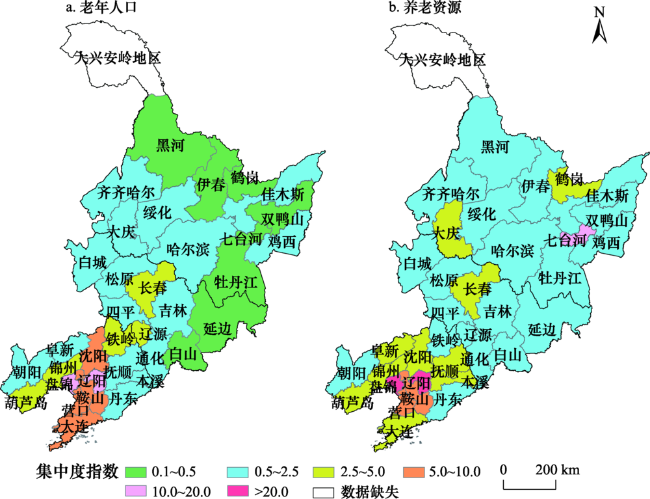
Figure 4 Distribution of concentration of elderly population and concentration of pension resources of the three provinces in Northeast China,in 2015图4 2015年东北三省老年人口集中度与养老资源集中度分布 |
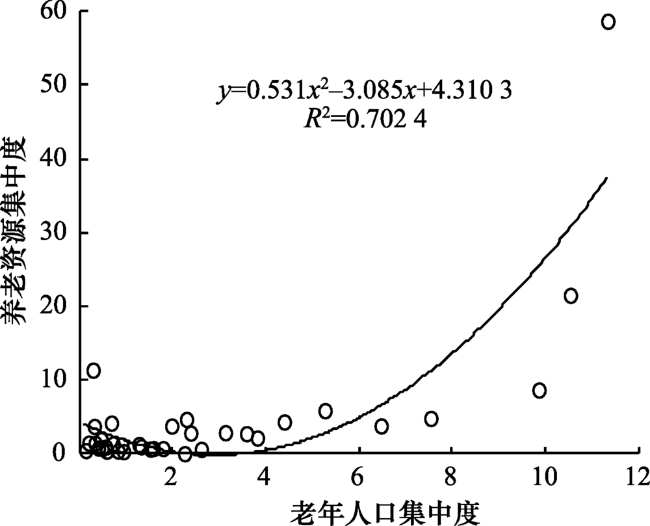
Figure 5 Fit on the elderly population and pension resources of the three provinces in Northeast China ,in 2015图5 2015年东北三省老年人口、养老资源拟合 |
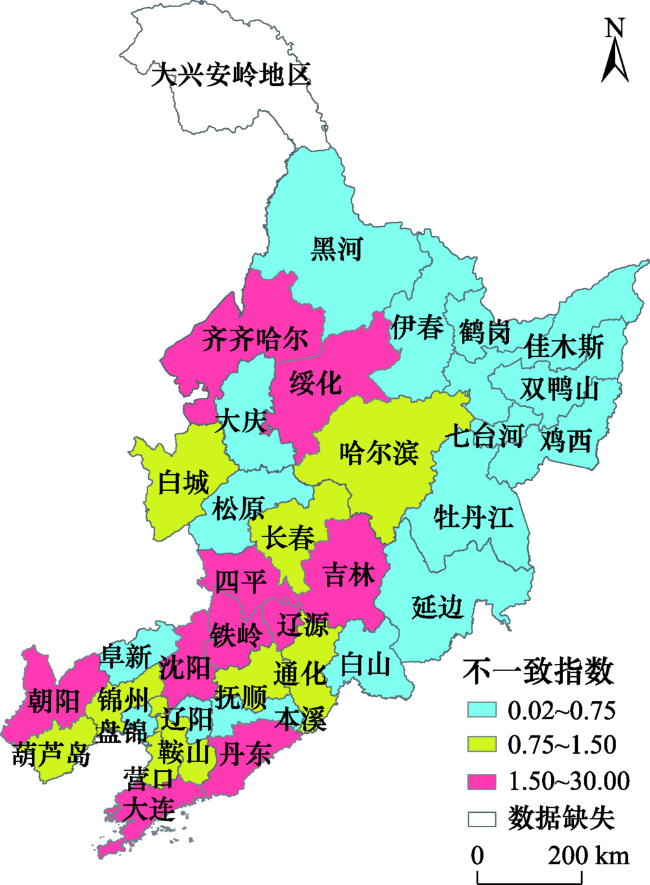
Figure 6 Matching relation between elderly population and endowment resources of the three provinces in Northeast China,in 2015图6 2015年东北三省老年人口与养老资源匹配关系 |
The authors have declared that no competing interests exist.
| [1] |
[
|
| [2] |
中国社会科学院. 中国财政政策报告2013, 2014[EB/OL]. (2013-02-14)[2017-08-09].
[Chinese Academy of Social Sciences. Report on China’s Fiscal Policy[EB/OL]. (2013-02-14)[2017-08-09].
|
| [3] |
Organisation for Economic Cooperation and Development (OECD). OECD Economic Surveys, China[R]. Paris: OECD, 2005.
|
| [4] |
|
| [5] |
[ [
|
| [6] |
[
|
| [7] |
[
|
| [8] |
[
|
| [9] |
戴维·L·德克尔. 老年社会学[M]. 天津: 天津人民出版社, 1986.
[
|
| [10] |
[
|
| [11] |
[
|
| [12] |
|
| [13] |
|
| [14] |
|
| [15] |
|
| [16] |
|
| [17] |
|
| [18] |
|
| [19] |
|
| [20] |
|
| [21] |
|
| [22] |
|
| [23] |
|
| [24] |
|
| [25] |
[
|
| [26] |
[
|
| [27] |
[
|
| [28] |
[
|
| [29] |
[
|
| [30] |
[
|
| [31] |
[
|
| [32] |
[
|
| [33] |
[
|
| [34] |
[
|
| [35] |
黑龙江省统计局. 黑龙江统计年鉴(2005, 2010, 2015) [M]. 北京: 中国统计出版社, 2006, 2011, 2016.
[Heilongjia Provincial Bureau of Statistics. Heilongjiang Statistical Yearbook(2005, 2010, 2015)[M]. Beijing: China Statistics Press, 2006, 2011, 2016. ]
|
| [36] |
吉林省统计局. 吉林统计年鉴(2005, 2010, 2015) [M]. 北京: 中国统计出版社, 2006, 2011, 2016.
[Jilin Provincial Bureau of Statistics. Jilin Statistical Yearbook(2005, 2010, 2015) [M]. Beijing: China Statistics Press, 2006, 2011, 2016. ]
|
| [37] |
辽宁省统计局. 辽宁统计年鉴(2005, 2010, 2015) [M]. 北京: 中国统计出版社, 2006, 2011, 2016.
[Liaoning Provincial Bureau of Statistics. Liaoning Statistical Yearbook(2005, 2010, 2015) [M]. Beijing: China Statistics Press, 2006, 2011, 2016. ]
|
| [38] |
|
| [39] |
[
|
| [40] |
[
|
| [41] |
[
|
| [42] |
[
|
| [43] |
[
|
| [44] |
[
|
/
| 〈 |
|
〉 |