
基于物质流和生命周期分析的石油行业碳排放
作者简介:吴明,男,辽宁抚顺人,教授,博士生导师,主要研究方向为油气管道输送技术。E-mail: lnpu2015@163.com
收稿日期: 2017-12-17
要求修回日期: 2018-03-09
网络出版日期: 2018-06-22
基金资助
国家自然科学基金项目(71373003)
辽宁省教育厅高等学校科学研究一般项目(L2014146)
Carbon emissions from the petroleum industry based on the analysis of material flow and life cycle
Received date: 2017-12-17
Request revised date: 2018-03-09
Online published: 2018-06-22
Copyright
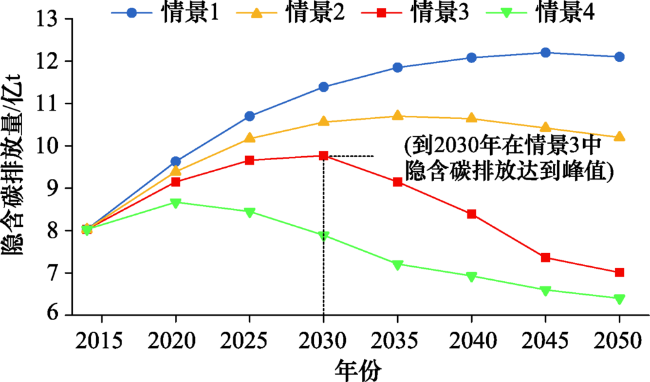
国内关于石油生命周期内的碳排放的研究主要集中在石油制品的消费环节,不能真实地反映石油流动生命周期内的碳排放。为了探寻石油生命周期内真实碳排放以及未来发展趋势,本文结合了物质流分析(Material flow analysis,MFA)和生命周期评估(Life Cycle Assessment,LCA)方法,建立了石油生命周期内碳元素流动模型。以国内某大型炼化企业为例,计算了各个环节的隐含碳排放和石油燃烧碳排放量,分析了影响隐含碳排放的关键影响因素,同时,设计了四种不同的情景,分别预测了2015—2050年间中国石油生命周期内的隐含碳排放发展和变化趋势。研究结果表明:①在石油生命周期内,每吨石油在生命周期总碳排放量约为670kg(约折合CO2 排放量为2457kg),其中隐含碳占总碳排放量的23%;②开采环节和炼化环节隐含碳排放分别占隐含碳总量的46%和54%,其中开采环节主要隐含碳排放来自天然气消耗和电力的消耗,分别占总量的47%和30%,炼化环节的隐含碳排放主要来自焦炭燃烧,占总量的46%;③在消费环节中,汽油、柴油和煤油在交通运输业中的消耗量最大,分别占各自总量的42%、53%和80%。提高石油行业能源利用效率和优化能源消费结构是实现国家2030年碳排放达到峰值目标的有效途径。
吴明 , 姜国强 , 贾冯睿 , 刘广鑫 , 岳强 . 基于物质流和生命周期分析的石油行业碳排放[J]. 资源科学, 2018 , 40(6) : 1287 -1296 . DOI: 10.18402/resci.2018.06.18
Research in China on carbon emissions throughout the petroleum life cycle has mainly focused on the consumption of petroleum products, which cannot truly reflect carbon emissions. In order to explore development trends of carbon emissions in the petroleum life cycle, we establish the carbon flow model throughout the petroleum life cycle combining material flow analysis (MFA) and life cycle assessment (LCA). Taking a large-scale domestic refining and petrochemical enterprise as an example, hidden carbon emissions and carbon emissions from petroleum combustion are calculated, and factors influencing embodied carbon emissions are analyzed. Four scenarios were developed to predict the hidden carbon emission trend for China’s petroleum sectors from 2015-2050. The results show that the total carbon emission per ton of oil is about 670 kg (equal to CO2 emission of 2457 kg) in the petroleum life cycle, of which hidden carbon accounts for 23% of total carbon emissions. Exploitation and refining processes account for 46% and 54% of the total hidden carbon, respectively. In the exploitation processes, embodied carbon emissions mainly come from natural gas consumption and electricity consumption, accounting for 47% and 30% of the total, respectively. The embodied carbon emissions of refining processes are mainly from coke combustion, accounting for 46% of the total. In the consumption processes, the consumption of gasoline, diesel and kerosene in the transportation industry is the largest, accounting for 42%, 53% and 80% of the total, respectively. Improving the energy efficiency of the petroleum sector and optimizing energy consumption structure is an effective way to achieve a national carbon emission peak by 2030.
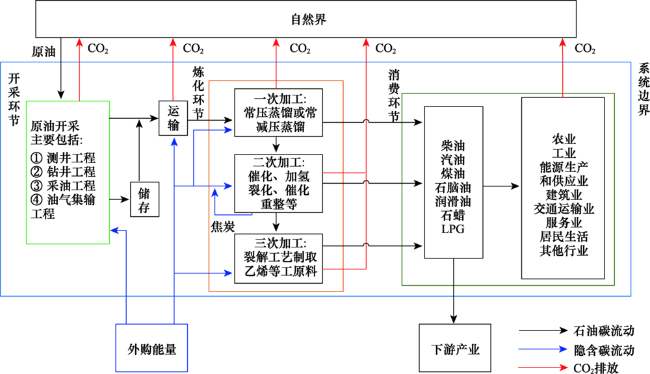
Figure 1 Material flow in the whole life cycle of petroleum图1 石油生命周期内物质流动 |
Table 1 Carbon emission correlation coefficient of different energy materials表1 各种能源物质碳排放计算相关系数 |
| 能源类型 | 折标准煤系数 /(kgec/kg) | 净发热量 /(TJ/Gg) | 碳排放因子 /(kg/GJ) | 碳排放系数 /(kgC/kg) |
|---|---|---|---|---|
| 原油 | 1.428 6 | 41.816 6 | 20.0 | 0.836 3 |
| 汽油 | 1.471 4 | 43.069 3 | 19.1 | 0.822 6 |
| 煤油 | 1.471 4 | 43.069 3 | 19.6 | 0.844 2 |
| 柴油 | 1.457 1 | 42.650 8 | 20.2 | 0.861 5 |
| 液化石油气 | 1.714 3 | 50.179 3 | 17.2 | 0.863 1 |
| 其他石油制品 | 1.200 0 | 35.125 2 | 20.0 | 0.702 5 |
| 3.5MPa蒸汽 | 0.125 7 | 3.679 4 | - | - |
| 1.0MPa蒸汽 | 0.108 6 | 3.178 8 | - | - |
| 燃料油 | 1.428 6 | 41.816 6 | 21.1 | 0.882 3 |
| 凝结水 | 0.010 9 | 0.319 1 | - | - |
Table 2 Embodied carbon emission coefficient growth rate in mining process at different time periods from 2015 to 2050 (%)表2 2015—2050年间不同时间段石油开采环节隐含碳排放系数增长率 |
| 2015—2020年 | 2020—2025年 | 2025—2030年 | 2030—2035年 | 2035—2040年 | 2040—2045年 | 2045—2050年 | |
|---|---|---|---|---|---|---|---|
| 情景1 | 0 | 0 | 0 | 0 | 0 | 0 | 0 |
| 情景2 | 2.5 | 2.5 | 2.5 | 2.5 | 2.5 | 2.5 | 2.5 |
| 情景3 | 5 | 5 | 5 | 5 | 5 | 5 | 5 |
| 情景4 | 10 | 10 | 10 | 10 | 10 | 10 | 10 |
Table 3 Embodied carbon emission coefficient growth rate in refining process at different time periods from 2015 to 2050 (%)表3 2015—2050年间不同时间段石油炼化环节隐含碳排放系数增长率 |
| 2015—2020年 | 2020—2025年 | 2025—2030年 | 2030—2035年 | 2035—2040年 | 2040—2045年 | 2045—2050年 | |
|---|---|---|---|---|---|---|---|
| 情景1 | 0 | 0 | 0 | 0 | 0 | 0 | 0 |
| 情景2 | 3 | 3 | 3 | 3 | 3 | 3 | 3 |
| 情景3 | 6 | 6 | 6 | 6 | 6 | 6 | 6 |
| 情景4 | 9 | 9 | 9 | 9 | 9 | 9 | 9 |
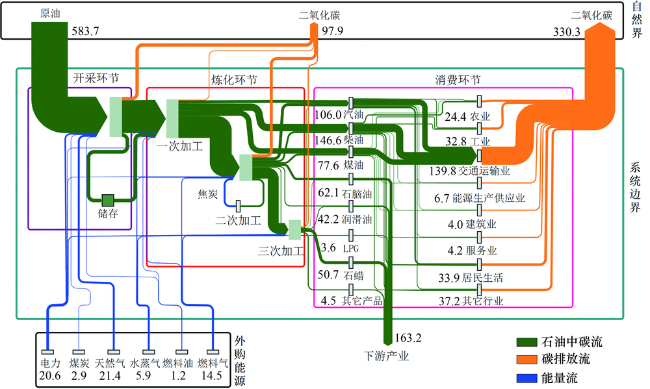
Figure 2 The carbon of petroleum flow and embodied carbon flow in a refinery in 2015图2 2015年某炼化企业石油中碳和隐含碳流动 |
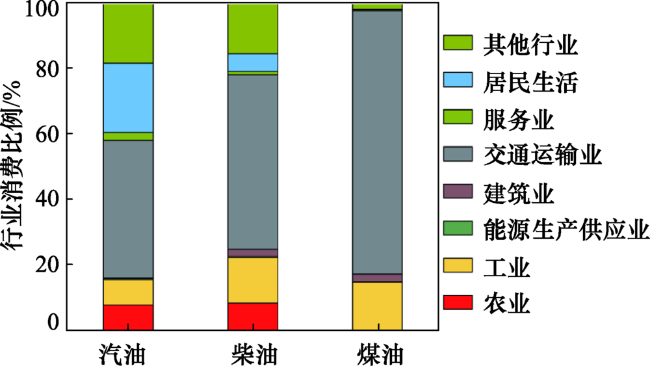
Table 4 Consumption of refined petroleum in various industries of 2015 (万t)表 4 成品油在2015年各行业消费量 |
| 行业类别 | 汽油 | 煤油 | 柴油 |
|---|---|---|---|
| 农业 | 9.51 | 0.10 | 14.87 |
| 工业 | 8.98 | 13.49 | 23.86 |
| 能源生产供应业 | 0.45 | 0.12 | 0.73 |
| 建筑业 | 0.12 | 2.09 | 3.85 |
| 交通运输业 | 49.03 | 71.80 | 90.76 |
| 服务业 | 2.67 | 0.30 | 1.54 |
| 其他行业 | 21.67 | 1.24 | 26.12 |
| 居民生活 | 24.64 | 0.06 | 9.36 |
| 总计 | 117.07 | 89.20 | 171.09 |
注:表中数据为炼厂实地调研经计算整理后获得。 |
Figure 3 Consumption ratio of refined petroleum in various industries in 2015图3 2015年成品油各行业的消费比例 |
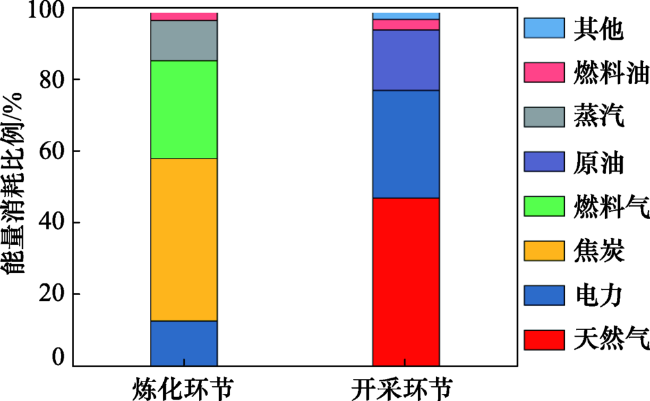
Figure 4 Carbon emissions from mining and refining processes图4 开采和炼化环节隐含碳排放 |
Figure 5 Embodied carbon emissions in China's petroleum industry from 2015 to 2050图5 2015—2050年中国石油行业隐含碳排放量 |
Table 5 Summary of optimization technology in petroleum industry表5 石油行业优化技术总结 |
| 优化技术 | 备注 | |
|---|---|---|
| 开采环节 | 聚合物驱油技术 | 适合聚合物驱的条件通常是油层温度在45~70℃,地层水矿化度为(1 603~30 435)mg/L,其中二价阳离子质量浓度为(7~738)mg/L。原油黏度为10~100mPa·s时,聚合物驱油采收率提高幅度较大。一般来说,聚合物驱油技术适用于非均质砂岩油田。 |
| 三元复合体系驱油技术 | 三元复合体系驱油是指在注入水中加入低浓度的表面活性剂、碱和聚合物的复合体系驱油的一种提高原油采收率的方法。矿场试验表明,三元复合驱油技术可比水驱油技术提高20%以上的原油采收率。 | |
| 炼化环节 | 板式空冷技术 | 适用于催化裂化、气体分馏、常减压蒸馏等多套装置,尤其适用于设备使用时间较长,设备落后老化,系统压降较大的情况。与湿冷、空冷相比,该技术可降低电耗量65%左右,同时降低软化水耗量近90%,是技术水平处于国内领先地位的专利技术。 |
| 装置间热联合与热供料技术 | 适用于炼化企业的上下游两套装置(比如催化裂化和气体分离装置),或者多套装置作为一个整体(比如在常减压、催化、加氢、延迟焦化、溶脱装置之间实行热联合和热供料)。炼油装置热联合及热供料投用后,实际降低炼油能耗1.85kgec/t。 |
The authors have declared that no competing interests exist.
| [1] |
BP Group. Statistical Review of World Energy [EB/OL]. (2017-06-01)[2017-11-07].
|
| [2] |
中华人民共和国国家统计局. 中国统计年鉴2016[M]. 北京: 中国统计出版社, 2016.
[National Bureau of Statistics of China. China Statistical Yearbook 2016[M]. Beijing: China Statistics Press, 2016. ]
|
| [3] |
|
| [4] |
[
|
| [5] |
[
|
| [6] |
[
|
| [7] |
[
|
| [8] |
|
| [9] |
[
|
| [10] |
[
|
| [11] |
|
| [12] |
|
| [13] |
|
| [14] |
|
| [15] |
|
| [16] |
|
| [17] |
|
| [18] |
|
| [19] |
|
| [20] |
|
| [21] |
|
| [22] |
[
|
| [23] |
[
|
| [24] |
|
| [25] |
国家标准化管理委员会. GB/T 2589-2008 综合能耗计算通则[S]. 北京: 中国标准出版社, 2008.
[Standardization Administration of the People’s Republic of China. GB/T 2589-2008 General Principles for Calculation of the Comprehensive Energy Consumption[S]. Beijing: Standards Press of China, 2008. ]
|
| [26] |
中华人民共和国国家发展和改革委员会. GB/T 30251-2013 炼油单位产品能耗限额[S]. 北京: 中国标准出版社, 2013.
[National Development and Reform Commission. GB/T 30251-2013 the Norm of Energy Consumption Per Unit Product for Petroleum Refining [S]. Beijing: Standards Press of China, 2013. ]
|
| [27] |
中华人民共和国国家发展和改革委员会. 2016年中国区域电网基准线排放因子[EB/OL]. (2017-04-14)[2017-11-07].
[National Development and Reform Commission. China's regional grid base line emission factors in 2016[EB/OL]. (2017-04-14)[2017-11-07].
|
| [28] |
中华人民共和国国家发展和改革委员会. 中国石油化工企业温室气体排放核算方法与报告指南[EB/OL]. (2014-12-03)[2017-11-07]
[National Development and Reform Commission. Accounting Method and Report Guide for Greenhouse Gas Emissions of Chinese Petrochemical Enterprises [EB/OL]. (2014-11-03)[2017-11-07].
|
| [29] |
[
|
| [30] |
[
|
| [31] |
[
|
| [32] |
[
|
| [33] |
[
|
/
| 〈 |
|
〉 |