
国际期铜价格波动中的金融因素分析
作者简介:程慧,女,贵州都匀人,博士,讲师,硕士生导师,主要研究方向为资源经济与管理。E-mail:chenghui326@qq.com
收稿日期: 2017-08-31
要求修回日期: 2018-02-07
网络出版日期: 2018-03-10
基金资助
国家自然科学基金项目(71403298)
教育部人文社会科学基金项目(15YJCZH019)
教育部人文社会科学基金项目(14YJCZH045)
Financial factors in international copper futures price volatility
Received date: 2017-08-31
Request revised date: 2018-02-07
Online published: 2018-03-10
Copyright
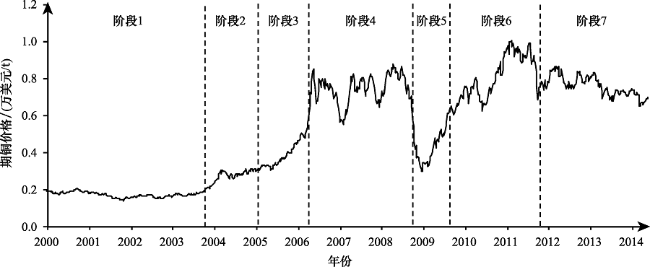
近年来,以期货市场为定价基础的金属价格呈现频繁而剧烈的波动,直接影响中国工业经济系统的稳定。而金融属性凸显被认为是国际铜价短期剧烈波动的主要原因。在这一背景下,从金融化视角出发探究金融因素是否影响国际期铜价格的波动,对维护中国工业系统稳定运行和保障国家资源安全具有重要意义。本文首先基于ICSS方法将2000—2014年LME期铜价格分为七个阶段,继而采用PLS方法实证检验了六种主要金融因素在不同阶段内对国际期铜价格波动的影响。研究发现,美元指数对期铜价格波动的解释力最大;黄金价格在铜价“大幅上涨”时期对铜价变化的解释作用最强,但反映的是市场对美元价值变化的信息;标准普尔500指数对期铜价格上涨具有明显支撑作用,反映出国际期铜市场金融化特征明显;投机行为虽在一定程度上导致期铜价格剧烈波动,但并未改变期货市场内在功能的发挥。基于以上结论,本文建议可借力人民币国际化抑制美元计价影响;应构建矿业金融战略体系,防范过度金融化下的价格波动风险;需理性对待投机,防范价格异常波动。
程慧 , 徐琼 , 郭尧琦 , 陈伟勋 . 国际期铜价格波动中的金融因素分析[J]. 资源科学, 2018 , 40(3) : 634 -644 . DOI: 10.18402/resci.2018.03.17
In recent years, the prices of metals based on the future market have frequently and drastically fluctuated, directly affecting the stability of China’s industrial economic system. Financial attributes are considered the main reason for drastic fluctuations in international copper prices in the short term. Under this background, exploring whether financial factors affect the volatility of international copper prices from the perspective of financialization is of great significance to safeguarding the stable operation of China's industrial system and national resource security. We divided LME copper prices from 2000 to 2014 into seven stages based on the ICSS method, and used the PLS method to test the impact of six major financial factors on international copper price fluctuations at different stages. We found that the dollar index has the largest explanatory power over fluctuation of copper prices. The explanation for the change in the price of copper is strongest for the price of gold in the period when the price of copper rises sharply, but it reflects market information in the change in the value of the dollar. The S&P500 Index for copper prices has an obvious supportive role, reflecting the financialization characteristic of international copper markets. At a certain level, speculative behavior leads to dramatic fluctuations in international copper prices, but does not change the intrinsic function of the futures market. We suggest that internationalization of the Chinese Yuan should be used to restrain the impact of the US Dollar; a mining financial strategy should be constructed to prevent the risk of price volatility under over-financialization; and speculation should be treated rationally to prevent abnormal fluctuation.
Table 1 Structural breakpoints of copper futures prices return series表1 期铜价格收益率序列的结构断点 |
| 结构断点 | 位置 | 对应日期 | 检验统计量 |
|---|---|---|---|
| 1 | 196 | 2003年10月07日 | 0.000 452 |
| 2 | 263 | 2005年01月18日 | 0.001 339 |
| 3 | 327 | 2006年04月11日 | 0.000 536 |
| 4 | 456 | 2008年09月30日 | 0.001 896 |
| 5 | 501 | 2009年08月11日 | 0.004 394 |
| 6 | 615 | 2011年10月18日 | 0.001 428 |
Figure 1 Copper futures prices and structural breakpoints图1 期铜价格与结构断点 |
Table 2 Precision analysis of PLS model regression at each stage表2 各阶段PLS模型回归的精度分析 |
| 成分 | RdX | RdX(cum) | RdY | RdY(cum) | Q2 | Q2(cum) | |
|---|---|---|---|---|---|---|---|
| 全样本 | t1 | 0.530 | 0.530 | 0.843 | 0.843 | 0.843 | 0.843 |
| t2 | 0.126 | 0.655 | 0.082 | 0.925 | 0.520 | 0.925 | |
| t3 | 0.112 | 0.768 | 0.015 | 0.940 | 0.199 | 0.940 | |
| 阶段1 | t1 | 0.358 | 0.358 | 0.637 | 0.637 | 0.636 | 0.636 |
| t2 | 0.385 | 0.743 | 0.041 | 0.678 | 0.109 | 0.675 | |
| t3 | 0.138 | 0.881 | 0.037 | 0.715 | 0.110 | 0.711 | |
| t4 | 0.078 | 0.959 | 0.021 | 0.736 | 0.068 | 0.731 | |
| t5 | 0.011 | 0.970 | 0.025 | 0.760 | 0.072 | 0.750 | |
| 阶段2 | t1 | 0.588 | 0.588 | 0.654 | 0.654 | 0.646 | 0.646 |
| t2 | 0.200 | 0.788 | 0.051 | 0.706 | 0.088 | 0.677 | |
| t3 | 0.077 | 0.865 | 0.059 | 0.764 | 0.136 | 0.721 | |
| t4 | 0.027 | 0.892 | 0.077 | 0.841 | 0.201 | 0.777 | |
| 阶段3 | t1 | 0.564 | 0.564 | 0.930 | 0.930 | 0.927 | 0.927 |
| t2 | 0.166 | 0.730 | 0.030 | 0.960 | 0.371 | 0.954 | |
| 阶段4 | t1 | 0.466 | 0.466 | 0.404 | 0.404 | 0.399 | 0.399 |
| t2 | 0.153 | 0.619 | 0.171 | 0.575 | 0.267 | 0.560 | |
| t3 | 0.251 | 0.870 | 0.020 | 0.595 | 0.035 | 0.575 | |
| 阶段5 | t1 | 0.339 | 0.339 | 0.656 | 0.656 | 0.649 | 0.649 |
| t2 | 0.437 | 0.776 | 0.055 | 0.712 | 0.140 | 0.698 | |
| t3 | 0.102 | 0.878 | 0.087 | 0.798 | 0.209 | 0.761 | |
| t4 | 0.051 | 0.929 | 0.046 | 0.845 | 0.137 | 0.794 | |
| t5 | 0.022 | 0.951 | 0.032 | 0.877 | 0.105 | 0.816 | |
| 阶段6 | t1 | 0.598 | 0.598 | 0.844 | 0.844 | 0.841 | 0.841 |
| t2 | 0.163 | 0.761 | 0.082 | 0.926 | 0.500 | 0.920 | |
| t3 | 0.072 | 0.834 | 0.011 | 0.937 | 0.075 | 0.926 | |
| 阶段7 | t1 | 0.556 | 0.556 | 0.788 | 0.788 | 0.786 | 0.786 |
| t2 | 0.165 | 0.720 | 0.037 | 0.825 | 0.159 | 0.820 |
注:RdX表示成分对自变量的解释力度;RdY表示成分对因变量的解释力度;cum表示累计解释力度。 |
Table 3 Independent variable projection importance index table at each stage表3 各阶段自变量的投影重要性指标 |
| VIP排序 | 全样本 | VIP | 阶段1 | VIP | 阶段2 | VIP | 阶段3 | VIP |
|---|---|---|---|---|---|---|---|---|
| 1 | USDX | 1.407 | USDX.L1 | 1.314 | SP500.L1 | 1.342 | GP | 1.337 |
| 2 | USDX.L1 | 1.402 | USDX | 1.291 | SP500 | 1.192 | FFR.L1 | 1.287 |
| 3 | GP | 1.303 | SP500.L1 | 1.162 | FFR | 1.009 | GP.L1 | 1.283 |
| 4 | GP.L1 | 1.302 | SP500 | 1.156 | FFR.L1 | 0.974 | FFR | 1.274 |
| 5 | FFR | 0.841 | FFR | 1.087 | USDX | 0.947 | SP500 | 1.186 |
| 6 | FFR.L1 | 0.840 | FFR.L1 | 1.054 | RNC.L1 | 0.939 | SP500.L1 | 1.171 |
| 7 | RNC.L1 | 0.773 | PNLNC.L1 | 0.929 | RNC | 0.930 | RNC.L1 | 0.870 |
| 8 | RNC | 0.768 | PNLNC | 0.917 | USDX.L1 | 0.926 | RNC | 0.784 |
| 9 | SP500 | 0.734 | RNC.L1 | 0.861 | PNLNC.L1 | 0.921 | PNLNC | 0.649 |
| 10 | SP500.L1 | 0.729 | RNC | 0.843 | GP | 0.919 | PNLNC.L1 | 0.626 |
| 11 | PNLNC.L1 | 0.707 | GP | 0.492 | PNLNC | 0.906 | USDX.L1 | 0.427 |
| 12 | PNLNC | 0.702 | GP.L1 | 0.481 | GP.L1 | 0.894 | USDX | 0.375 |
| VIP排序 | 阶段4 | VIP | 阶段5 | VIP | 阶段6 | VIP | 阶段7 | VIP |
| 1 | PNLNC | 1.508 | USDX.L1 | 1.409 | SP500 | 1.272 | USDX | 1.254 |
| 2 | PNLNC.L1 | 1.398 | USDX | 1.376 | SP500.L1 | 1.251 | GP | 1.225 |
| 3 | USDX | 1.063 | SP500 | 1.201 | USDX | 1.144 | USDX.L1 | 1.209 |
| 4 | USDX.L1 | 1.057 | SP500.L1 | 1.160 | USDX.L1 | 1.113 | GP.L1 | 1.202 |
| 5 | GP.L1 | 1.047 | GP.L1 | 0.970 | GP | 1.045 | SP500.L1 | 1.071 |
| 6 | GP | 1.045 | FFR | 0.874 | PNLNC.L1 | 1.044 | SP500 | 1.060 |
| 7 | FFR | 0.947 | FFR.L1 | 0.872 | PNLNC | 1.040 | RNC | 0.993 |
| 8 | FFR.L1 | 0.924 | RNC | 0.832 | GP.L1 | 1.027 | RNC.L1 | 0.975 |
| 9 | RNC.L1 | 0.867 | PNLNC | 0.814 | RNC.L1 | 0.751 | FFR | 0.767 |
| 10 | RNC | 0.656 | PNLNC.L1 | 0.780 | RNC | 0.693 | FFR.L1 | 0.714 |
| 11 | SP500.L1 | 0.471 | GP | 0.765 | FFR | 0.693 | PNLNC | 0.651 |
| 12 | SP500 | 0.431 | RNC.L1 | 0.568 | FFR.L1 | 0.654 | PNLNC.L1 | 0.542 |
注:变量后缀名L1表示变量的一阶滞后项。 |
Table 4 Regression coefficients of independent variables estimated by PLS model at each stage表4 各阶段PLS模型估计的自变量回归系数 |
| 全样本 | 阶段1 | 阶段2 | 阶段3 | 阶段4 | 阶段5 | 阶段6 | 阶段7 | |
|---|---|---|---|---|---|---|---|---|
| 对应方程 | M1 | M2 | M3 | M4 | M5 | M6 | M7 | M8 |
| 成分个数 | 3 | 5 | 4 | 2 | 3 | 5 | 3 | 2 |
| 常数项 | 12.711 | 88.409 | 57.423 | 47.358 | 84.475 | 40.814 | 58.412 | 129.030 |
| (0.000) | (0.000) | (0.000) | (0.000) | (0.000) | (0.000) | (0.000) | (0.000) | |
| GP | 0.208 | 0.298 | 0.358 | 0.192 | 0.010 | 0.116 | 0.164 | 0.125 |
| (0.002) | (0.081) | (0.622) | (0.021) | (0.033) | (0.460) | (0.038) | (0.011) | |
| USDX | -0.290 | -0.031 | 0.545 | -0.046 | -0.060 | -0.208 | -0.152 | -0.155 |
| (0.002) | (0.095) | (0.507) | (0.035) | (0.041) | (0.301) | (0.043) | (0.022) | |
| FFR | 0.046 | 0.480 | 0.201 | 0.138 | -0.029 | 0.106 | 0.120 | 0.085 |
| (0.005) | (0.157) | (0.378) | (0.008) | (0.031) | (0.271) | (0.099) | (0.034) | |
| SP500 | 0.031 | 0.156 | 0.332 | 0.143 | -0.093 | 0.262 | 0.221 | -0.068 |
| (0.008) | (0.133) | (0.185) | (0.012) | (0.119) | (0.398) | (0.020) | (0.019) | |
| RNC | -0.030 | 0.038 | 0.081 | 0.050 | -0.143 | -0.703 | 0.015 | -0.114 |
| (0.008) | (0.216) | (0.478) | (0.027) | (0.101) | (0.374) | (0.084) | (0.017) | |
| PNLNC | -0.069 | 0.397 | 0.019 | -0.050 | 0.358 | 0.442 | 0.143 | 0.139 |
| (0.008) | (0.143) | (0.436) | (0.052) | (0.090) | (0.310) | (0.042) | (0.037) | |
| GP.L1 | 0.206 | 0.292 | 0.146 | 0.184 | 0.006 | 0.584 | 0.151 | 0.114 |
| (0.002) | (0.111) | (0.215) | (0.025) | (0.032) | (0.503) | (0.041) | (0.012) | |
| USDX.L1 | -0.284 | -0.037 | 0.436 | -0.028 | -0.042 | 0.051 | -0.108 | -0.134 |
| (0.002) | (0.098) | (0.602) | (0.038) | (0.036) | (0.491) | (0.029) | (0.022) | |
| FFR.L1 | 0.044 | 0.437 | 0.201 | 0.139 | -0.045 | 0.013 | 0.095 | 0.071 |
| (0.004) | (0.151) | (0.384) | (0.007) | (0.037) | (0.412) | (0.064) | (0.021) | |
| SP500.L1 | 0.028 | 0.106 | 0.652 | 0.147 | -0.116 | -0.137 | 0.184 | -0.076 |
| (0.010) | (0.156) | (0.388) | (0.015) | (0.103) | (0.290) | (0.019) | (0.017) | |
| RNC.L1 | -0.041 | 0.077 | -0.276 | 0.054 | -0.218 | -0.215 | -0.003 | -0.106 |
| (0.008) | (0.190) | (0.520) | (0.026) | (0.115) | (0.262) | (0.075) | (0.021) | |
| PNLNC.L1 | -0.074 | 0.085 | 0.197 | -0.044 | 0.320 | 0.147 | 0.087 | 0.116 |
| (0.008) | (0.152) | (0.284) | (0.051) | (0.036) | (0.344) | (0.040) | (0.024) |
注:变量后缀名L1表示变量的一阶滞后项;圆括号内表示对应变量的估计标准差;Mi, i=1, 2, ..., 8表示各阶段对应的PLS回归方程。 |
The authors have declared that no competing interests exist.
| [1] |
[
|
| [2] |
|
| [3] |
[
|
| [4] |
|
| [5] |
|
| [6] |
|
| [7] |
|
| [8] |
|
| [9] |
|
| [10] |
|
| [11] |
|
| [12] |
|
| [13] |
|
| [14] |
|
| [15] |
[
|
| [16] |
[
|
| [17] |
[
|
| [18] |
[
|
| [19] |
[
|
| [20] |
[
|
| [21] |
[
|
| [22] |
万得资讯. 万得数据库[EB/OL]. (2014-08-20)[2018-02-07].
[Wind Information. Wind [EB/OL]. (2014-08-20)[2018-02-07].
|
| [23] |
[
|
/
| 〈 |
|
〉 |