
基于地理加权回归的石漠化影响因子分布研究
作者简介:许尔琪,男,广东汕头人,博士,主要从事土地利用及空间格局、生态环境效应研究。E-mail:xueq@igsnrr.ac.cn
收稿日期: 2017-08-23
要求修回日期: 2017-09-14
网络出版日期: 2017-10-20
基金资助
国家自然科学基金项目(41601095)
国家重点基础研究发展计划项目(973 计划)(2015CB452702)
Spatial variation in drivers of karst rocky desertification based on geographically weighted regression model
Received date: 2017-08-23
Request revised date: 2017-09-14
Online published: 2017-10-20
Copyright
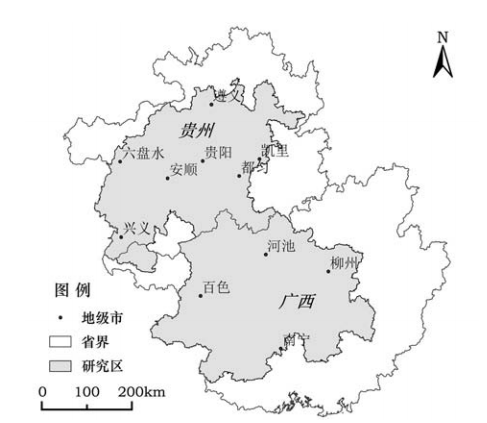
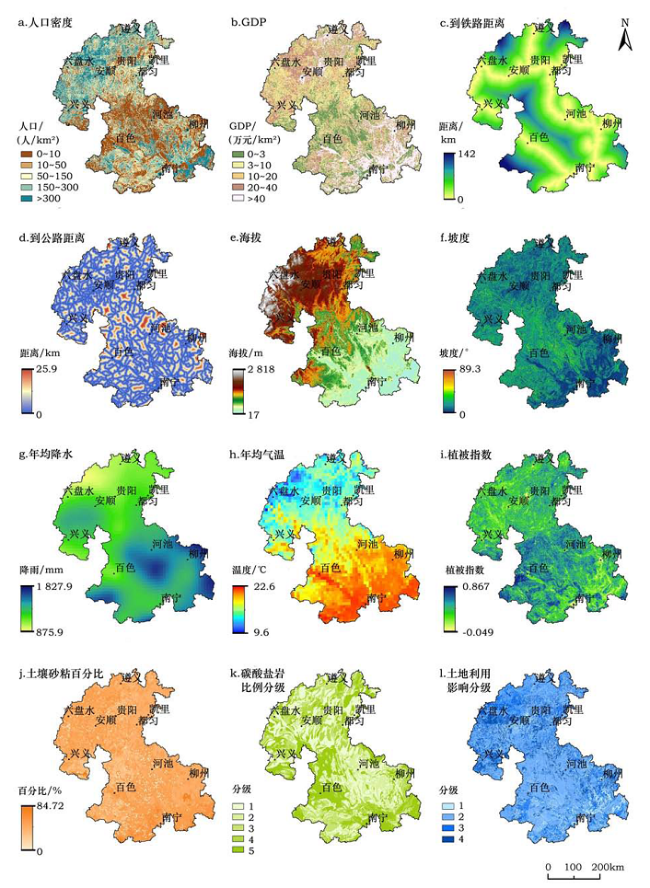
分析和识别石漠化的关键影响因子,有助于有效治理和恢复石漠化。以往研究对影响因子的空间局部差异关注较少,本文以黔桂喀斯特山地为研究区,选取自然及社会经济等12个影响因子,利用地理加权回归(GWR)模型,在普通线性回归的基础上嵌入空间因素,分析石漠化影响因子的空间分异。结果表明:①黔桂喀斯特山地的石漠化Moran’s I大于正态函数在99%显著水平,存在明显空间聚集现象;②GWR模型R2(0.508)明显高于传统统计模型的R2(0.156),回归模型拟合效果显著提高;③12个影响因子与石漠化关系呈现不同数值大小、正负效应和线性组合关系的空间分布差异;④人类活动叠加在喀斯特特殊的岩性、土壤和植被组合上,显著影响石漠化分布;同时,局部区域高强度人类活动导致石漠化的急剧变化。GWR模型可揭示石漠化影响因子的空间分异规律和局部的关键影响因子,刻画多因子组合作用对石漠化的影响,有助于差别化的小流域石漠化治理。
许尔琪 . 基于地理加权回归的石漠化影响因子分布研究[J]. 资源科学, 2017 , 39(10) : 1975 -1988 . DOI: 10.18402/resci.2017.10.16
Analysis and identification of key drivers of karst rocky desertification (KRD)can contribute to effective management and restoration. Ignoring heterogeneity leads to statistical bias and influences the specificity of desertification control planning. Taking Guizhou and Guangxi Karst Mountainous Regions as the study area,this paper chose twelve factors,including socioeconomic,spatial distance,topography,climate,soil,lithology and land use,as drivers of KRD. Geographically Weighted Regression modeling (GWR)and embedding spatial factors to the traditional ordinary linear regression (OLS)model were used to analyze the spatial distribution of influence on KRD. An obvious spatial agglomeration of KRD in the study area according to Moran’s I at the significant level of 99% was found. Coefficients of determination (R2)of GWR were much higher for OLS (0.508 vs. 0.156),indicating a much better fit for the GWR model. Coefficients of GWR between twelve drivers and an obvious spatial distribution of value magnitudes,negative or positive effects and combined types. The specifics of the karst background create a fragile and vulnerable environment that is susceptible to human activities. Meanwhile,intense human activities lead to a sharp change in KRD status,which included the predatory sabotage for casing the severe KRD and the KRD restoration projects for reversing KRD to no KRD. The regression coefficients of the twelve drivers and their linear combined characteristics showed different spatial distributions based on GWR modeling. Using the GWR model revealed the spatial discrimination of the effects of driving forces on KRD and identified key drivers of KRD at the local area,revealing the spatial distribution of the joint effect of different driving forces helping provide a scientific reference to differential KRD control at small watershed scales.
Table 1 Classification standard of karst rocky desertification表1 石漠化等级分级标准 |
| 石漠化强度等级 | 基岩裸露/% | 植被+土壤覆盖/% | 分级 |
|---|---|---|---|
| 无石漠化 | <20 | >80 | 1 |
| 潜在石漠化 | 20~30 | 70~80 | 2 |
| 轻度石漠化 | 30~50 | 50~70 | 3 |
| 中度石漠化 | 50~70 | 30~50 | 4 |
| 强度石漠化 | 70~90 | 10~30 | 5 |
| 极强度石漠化 | >90 | <10 | 6 |
Figure 1 Boundary of Guizhou and Guangxi Karst Mountainous Region图1 黔桂喀斯特山地范围 |
Figure 2 Driving forces of karst rocky desertification in Guizhou and Guangxi Karst Mountainous Region图2 黔桂喀斯特山地石漠化影响因子空间差异 |
Table 2 Driving forces of karst rocky desertification and data sources and processing in Guizhou and Guangxi Karst Mountainous Region表2 黔桂喀斯特山地石漠化影响因子及其数据来源、处理过程 |
| 类型 | 影响因子(代码) | 描述 | 数据来源及处理 |
|---|---|---|---|
| 社会经济 | 人口密度(x1) | 空间单元的人口密度数据(2010年) | 中国科学院资源环境科学数据中心,人口密度数据集[32] |
| GDP(x2) | 空间单元的国民生产总值(2010年) | 中国科学院资源环境科学数据中心,GDP数据[33] | |
| 空间距离 | 到主要铁路距离 (x3) | 空间单元中心到线状铁路的最近距离 (2010年) | 中国科学院资源环境科学数据中心,道路数据集[34]和距离分析工具(ArcGIS 10.1) |
| 到主要公路距离 (x4) | 空间单元中心到线状公路的最近距离 (2010年) | 中国科学院资源环境科学数据中心,公路数据集[35]和距离分析工具(ArcGIS 10.1) | |
| 地形 | 海拔(x5) | 空间单元中心点的海拔数值 | 中国科学院计算机网络信息中心地理空间数据云[36] |
| 坡度(x6) | 空间单元切平面与水平面夹角 | 中国科学院计算机网络信息中心地理空间数据云)[36]和地形分析工具(ArcGIS 10.1) | |
| 气候 | 年均降水(x7) | 空间单元平均降水数值(1980-2011年) | 寒区旱区科学数据中心中国区域高时空分辨率地面气象要素驱动数据集[37] |
| 年均气温(x8) | 空间单元平均气温数值(1980-2011年) | 寒区旱区科学数据中心中国区域高时空分辨率地面气象要素驱动数据集[37] | |
| 植被 | 植被指数(x9) | 空间单元的植被指数数据(2011年) | NASA的陆地过程分布式数据档案中心[38] |
| 立地 | 土壤砂粘百分比(x10) | 空间单元土壤砂粘百分比 | 寒区旱区科学数据中心,中国土壤特征数据集[39] |
| 碳酸盐岩比例分级(x11) | 空间单元的碳酸盐岩比例分级数据 | 喀斯特数据中心[40],1级为连续性灰岩、白云岩,2级为灰岩白云岩混合岩,3级为灰岩夹碎屑岩、白云岩夹碎屑岩,4级为灰岩白云岩碎屑岩互层、灰岩碎屑岩互层,5级为碎屑岩 | |
| 土地利用 | 土地利用影响分级(x12) | 空间单元土地利用对石漠化影响分级 (2010年) | 中国科学院资源环境科学数据中心,土地利用数据集[41],1级为建设用地、水域、水田和未利用地,2级为林地,3级为旱地,4级为草地 |
Table 3 Collinearity test results between karst rocky desertification and driving factors in Guizhou and Guangxi Karst Mountainous Region表3 黔桂喀斯特山地石漠化与影响因子共线性检验结果 |
| 影响因子 | 共线性统计量 | 影响因子 | 共线性统计量 | ||
|---|---|---|---|---|---|
| 容差 | VIF | 容差 | VIF | ||
| x1 | 0.682 | 1.466 | x7 | 0.554 | 1.805 |
| x2 | 0.773 | 1.294 | x8 | 0.225 | 4.439 |
| x3 | 0.880 | 1.137 | x9 | 0.673 | 1.485 |
| x4 | 0.900 | 1.110 | x10 | 0.962 | 1.040 |
| x5 | 0.244 | 4.102 | x11 | 0.951 | 1.051 |
| x6 | 0.814 | 1.228 | x12 | 0.931 | 1.074 |
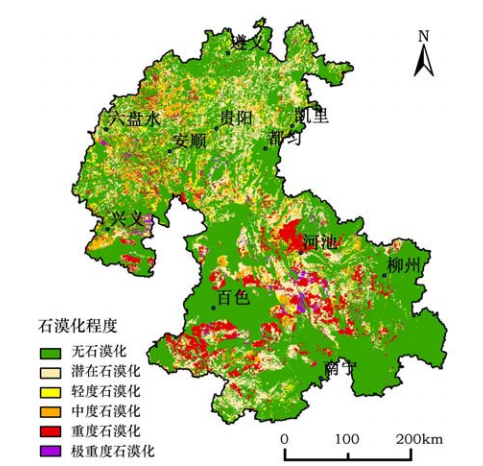
Figure 3 Spatial distribution of karst rocky desertification in Guizhou and Guangxi Karst Mountainous Region in 2011图3 2011年黔桂喀斯特山地石漠化空间分布 |
Table 4 Parameter estimation and test results of the GWR model表4 GWR 模型参数估计及检验结果 |
| 模型参数 | OLS模型 | GWR模型 |
|---|---|---|
| Bandwidth | - | 6 928.466 |
| Residual Squares | - | 9 823.062 |
| Effective Number | - | 1 678.221 |
| Sigma | - | 0.779 |
| AIC | 564 901.811 | 42 551.165 |
| R2 | 0.156 | 0.554 |
| Adjusted R2 | 0.156 | 0.508 |
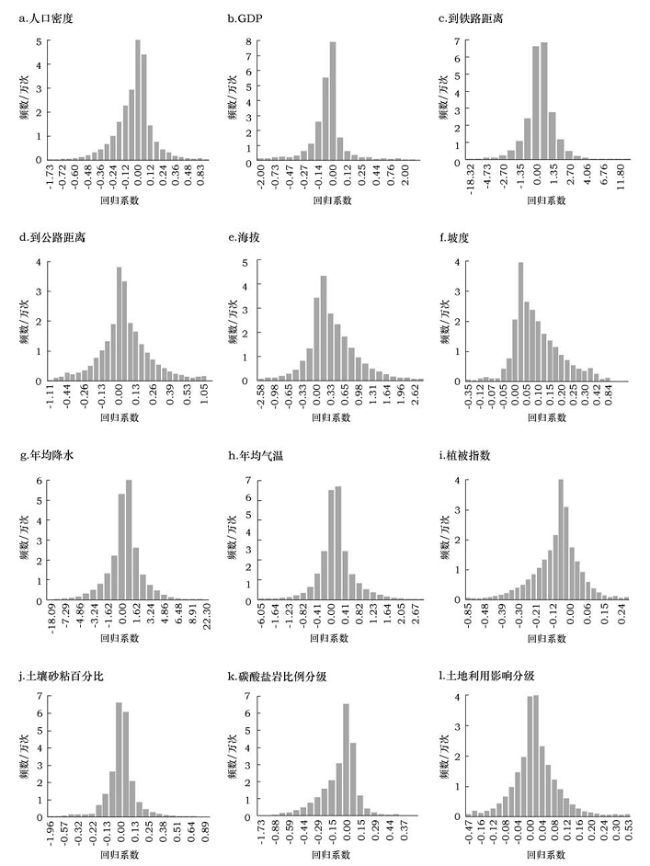
Table 5 Statistical characteristics of GWR regression coefficients for driving forces of karst rocky desertification in Guizhou and Guangxi Karst Mountainous Region表5 黔桂喀斯特山地石漠化影响因子的GWR模型回归系数的描述性统计 |
| 影响因子 | 平均值 | 标准差 | 最大值 | 最小值 | 下四分位值 | 中位值 | 上四分位值 |
|---|---|---|---|---|---|---|---|
| x1 | -0.064 | 0.191 | 1.230 | -1.734 | -0.148 | 0.033 | 0.089 |
| x2 | -0.018 | 0.596 | 14.950 | -12.900 | -0.078 | -0.012 | 0.018 |
| x3 | 0.022 | 1.235 | 14.126 | -18.324 | -0.489 | 0.001 | 0.534 |
| x4 | 0.024 | 0.197 | 1.049 | -1.112 | -0.068 | 0.001 | 0.115 |
| x5 | 0.179 | 0.585 | 5.539 | -2.585 | -0.020 | 0.112 | 0.557 |
| x6 | 0.082 | 0.106 | 0.835 | -0.351 | 0.007 | 0.058 | 0.135 |
| x7 | -0.028 | 1.310 | 22.305 | -18.087 | -0.781 | 0.007 | 0.817 |
| x8 | 0.040 | 0.565 | 3.670 | -6.051 | -0.187 | 0.002 | 0.233 |
| x9 | -0.136 | 0.134 | 0.349 | -0.850 | -0.098 | -0.053 | 0.011 |
| x10 | 0.008 | 0.163 | 1.105 | -1.962 | -0.062 | 0.003 | 0.082 |
| x11 | -0.098 | 0.193 | 1.417 | -1.727 | -0.183 | -0.049 | 0.002 |
| x12 | 0.010 | 0.080 | 0.527 | -0.471 | -0.027 | 0.001 | 0.044 |
Figure 4 Histogram statistics of regression coefficients of GWR for different driving forces in Guizhou and Guangxi Karst Mountainous Region图4 黔桂喀斯特山地石漠化影响因子回归系数统计 |
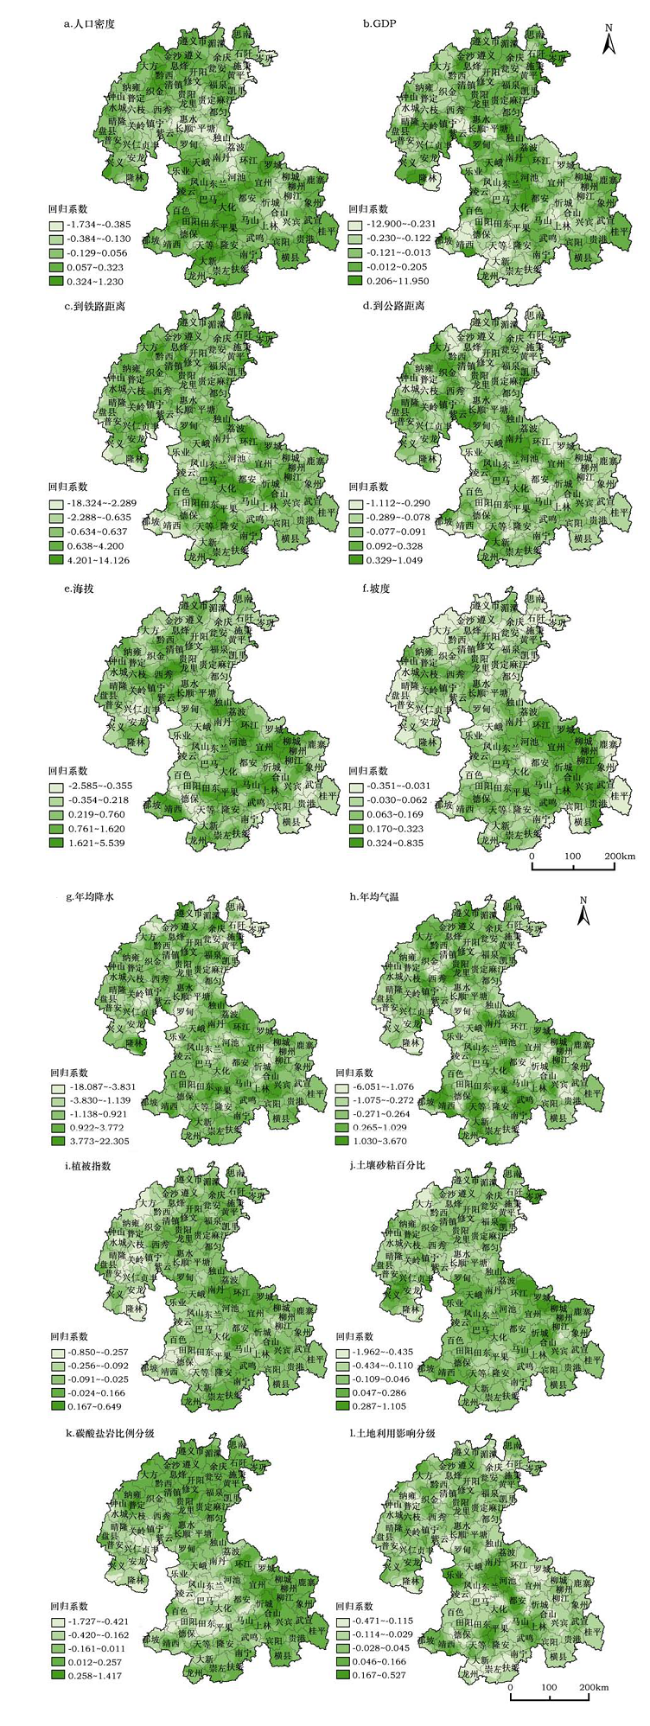
Figure 5 Spatial distribution of GWR regression coefficients for driving forces of karst rocky desertification in Guizhou and Guangxi Karst Mountainous Region图5 黔桂喀斯特山地石漠化影响因子回归系数 |
The authors have declared that no competing interests exist.
| [1] |
[
|
| [2] |
[
|
| [3] |
[
|
| [4] |
[
|
| [5] |
|
| [6] |
|
| [7] |
|
| [8] |
[
|
| [9] |
[
|
| [10] |
|
| [11] |
[
|
| [12] |
[
|
| [13] |
|
| [14] |
|
| [15] |
|
| [16] |
[
|
| [17] |
|
| [18] |
|
| [19] |
|
| [20] |
|
| [21] |
[
|
| [22] |
[
|
| [23] |
[
|
| [24] |
[
|
| [25] |
|
| [26] |
|
| [27] |
|
| [28] |
[
|
| [29] |
[
|
| [30] |
中华人民共和国国家林业局. 中国石漠化状况公报[EB/OL].(2012-06-18)[2017-08-23].
[State Forestry Administr-ation of People 's Republic of China. Bulletin of China 's Karst Rock Desertification[EB/OL].(2012-06-18)[2017-08-23].
|
| [31] |
|
| [32] |
中国科学院资源环境科学数据中心.人口密度数据(2010)[EB/OL].(2014-06-01)[2017-03-10].
[Data Center for Resources and Environmental Sciences,Chinese Academy of Sciences. Population Density Dataset (2010)[EB/OL]. (2014-06-01)[2017-03-10].
|
| [33] |
中国科学院资源环境科学数据中心. GDP数据[EB/OL]. (2014-06-01)[2017-03-10].
[Data Center for Resources and Environmental Sciences,Chinese Academy of Sciences. GDP Dataset (2010)[EB/OL]. (2014-06-01)[2017-03-10].
|
| [34] |
中国科学院资源环境科学数据中心. 道路数据集[EB/OL]. (2017-03-01)[2017-03-10].
[Data Center for Resources and Environmental Sciences,Chinese Academy of Sciences. Road Dataset [EB/OL]. (2017-03-01)[2017-03-10].
|
| [35] |
中国科学院资源环境科学数据中心. 公路数据集[EB/OL]. (2017-03-01)[2017-03-10].
[Data Center for Resources and Environmental Sciences,Chinese Academy of Sciences. Road Dataset [EB/OL]. (2017-03-01)[2017-03-10].
|
| [36] |
中国科学院计算机网络信息中心地理空间数据云. SRTM DEM数据 [EB/OL]. (2017-01-01)[2017-03-10].
[International Scientific & Technical Data Mirror Site,Computer Network Information Center,Chinese Academy of Sciences. SRTM DEM Dataset [EB/OL]. (2017-01-01)[2017-03-10].
|
| [37] |
寒区旱区科学数据中心.中国区域高时空分辨率地面气象要素驱动数据集(2011)[EB/OL]. (2016-06-06)[2017-03-10].
[Cold and Arid Regions Science Data Center at Lanzhou. China Meteorological Forcing Dataset (2011)[EB/OL]. (2016-06-06)[2017-03-10].
|
| [38] |
The Land Processes Distributed Active Archive Center,LP DAAC/NASA.MODIS/Aqua Vegetation Indices[EB/OL].(2017-03-01)[2017-03-10].
|
| [39] |
寒区旱区科学数据中心. 中国土壤特征数据集 [EB/OL]. (2013-06-07)[2017-03-10].
[Cold and Arid Regions Science Data Center at Lanzhou. Soil Particle-size Distribution Dataset (2011)[EB/OL]. (2013-06-07)[2017-03-10].
|
| [40] |
喀斯特数据中心. 岩性数据[EB/OL]. (2011-10-30)[2017-03-10].
[Karst Data Center. Lithology Dataset[EB/OL]. (2011-10-30)[2017-03-10].
|
| [41] |
中国科学院资源环境科学数据中心. 土地利用数据(2010)[EB/OL]. (2012-02-20)[2017-03-10].
[Data Center for Resources and Environ-mental Sciences,Chinese Academy of Sciences. Land Use Dataset(2010)[EB/OL]. (2012-02-20)[2017-03-10].
|
| [42] |
|
| [43] |
|
| [44] |
|
| [45] |
[
|
| [46] |
[
|
| [47] |
[
|
| [48] |
|
| [49] |
[
|
| [50] |
[
|
| [51] |
[
|
/
| 〈 |
|
〉 |