
林业生态安全指标-指数的耦合实证测度研究
作者简介:廖冰,男,江西高安人,博士生,主要研究领域为林业管理工程。E-mail:liaobing1002@126.com
收稿日期: 2016-11-06
要求修回日期: 2017-07-03
网络出版日期: 2017-09-20
基金资助
国家自然科学基金项目(71173107、71673136)
江苏省高校哲学社会科学优秀创新团队建设项目(苏教社政2013-8-2-1)
2016年江苏省普通高校学术学位研究生科研创新计划项目(KYZZ16_0314)
The empirical measurement of coupling from indicators to indexes of forestry ecological security
Received date: 2016-11-06
Request revised date: 2017-07-03
Online published: 2017-09-20
Copyright
研究林业生态安全测度评价对管理者制定林业生态安全预警、监管和控制措施以深入推进生态文明建设具有重要意义。为克服已有研究的不足,本文立足于林业生态安全的广义内涵——产业与生态互利共生,在分析林业产业压力与森林生态相互关系的基础上,利用2004-2015年全国及31省域面板数据,运用结构化PSIR和定量化SEM方法确定了林业生态安全指标及其权重,通过Lotka-Volterra方法得到了具有生态经济意义的林业生态安全共生度指数及其判据,实现由指标向指数的耦合集成,最后对全国及31省域林业生态安全实证测度,并根据测度的“系列指数”追溯“指标变量”以找出林业生态安全问题的原因,实现由指数向指标的回溯解耦。研究结果表明:①整个中国林业产业压力与森林生态处于非绿色共生模式导致林业生态安全处于预警状态,这将产生潜在的林业生态安全隐患,亟需引起高度重视,要实现林业绿色安全仍任重道远;②31省域中,处于林业生态安全预警省域的数量(18省域,占比58%)要多于处于林业生态安全省域的数量(13省域,占比42%);③林业生态安全不仅依赖于林业自然资源禀赋能力,还取决于林业产业压力与森林生态的共生协调状态。
廖冰 , 张智光 . 林业生态安全指标-指数的耦合实证测度研究[J]. 资源科学, 2017 , 39(9) : 1777 -1791 . DOI: 10.18402/resci.2017.09.15
Studying the calculation of forestry ecological security is significant for managers to determine policy for supervising forestry ecological security and promote ecological civilization. This study aimed to overcome defects in existing research regarding the essential attribute of forestry ecological security: symbiosis between forestry industry pressure and forest ecology. First, indicators and weightings were determined by means of pressure-state-impact-response(PSIR) and structural equation modeling(SEM). Second, with data for China and thirty-one provinces from 2004-2015, symbiotic degree indexes with ecology economic significance and judgment criteria of forestry ecological security were constructed using Lotka-Volterra method,realizing the coupling from indicators to indexes. Last, the empirical calculation of forestry ecological security in China and thirty-one provinces was carried out and indicators were tracked to determine key reasons for existing problems according to calculated indexes, realizing decoupling from indexes to indicators. We found that the Chinese forestry industry pressure and forest ecology are not at the state of green symbiosis so that forestry ecological security is at state of pre-warning and the potential hidden risk of forestry ecological security will appear; there will be a very long way to go. In all 31 provinces, the quantities of provinces in a state of pre-warning for forestry ecological security(including 18 provinces, 58%) are more than the quantities of provinces which are at state of forestry green security (including 13 provinces, 42%). Forestry green security not only depends on resource endowment and natural conditions but also the symbiotic state between the forestry industry pressure and forest ecology.
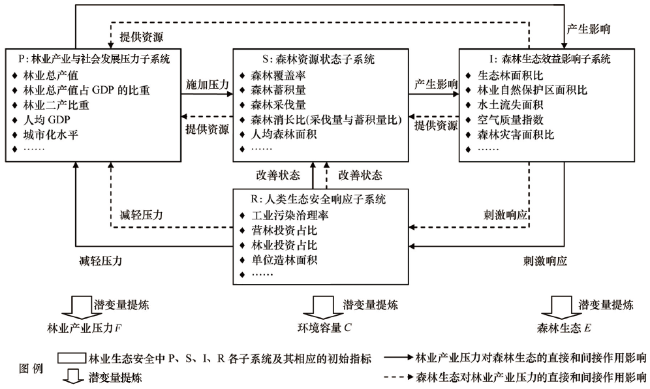
Figure 1 Original indicators among forestry industry pressure,environment capacity and forest ecology based on PSIR framework图1 基于PSIR理论框架的林业产业压力、环境容量和森林生态初始指标体系 |
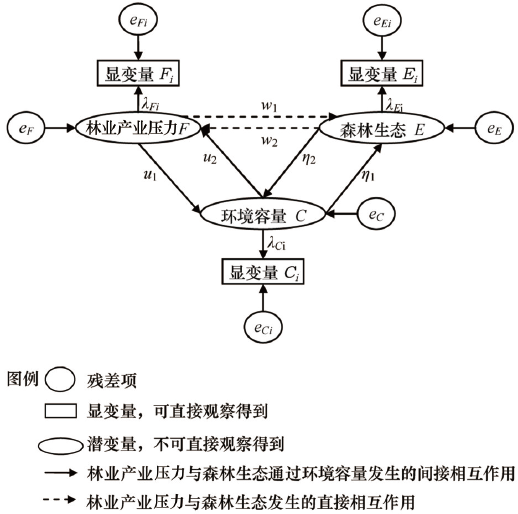
Figure 2 Hypothesis models SEMP and SEMC based on interaction between forestry industry pressure and forest ecology图2 林业产业压力与森林生态相互作用的理论假设模型SEMP和SEMC |
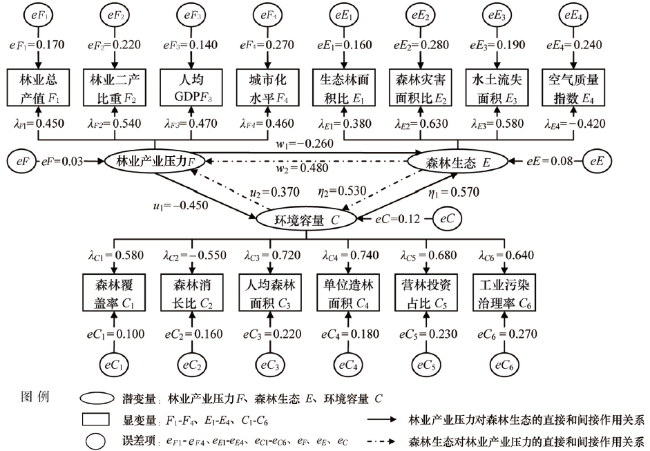
Table 1 Final indicators screened out by SEM of forestry ecological security and their operation paths coefficients表1 通过SEM筛选得到的林业生态安全最终指标及其作用路径系数 |
| 潜变量 | 初始指标 | 最终指标 | 指标释义 | ||
|---|---|---|---|---|---|
| 林业产业压力F(压力指标) | 林业总产值X1、林业二产比重X2、林业总产值占GDP比重X3、人均GDP X4、城市化水平X5…… | 林业总产值F1 | 除反映林业产业经济总体发展水平外,还间接反映为促进林业产业经济发展而消耗利用森林资源并在一定程度上造成生态破坏、环境损害的压力,正向指标 | 0.450 | 0.234 |
| 林业二产比重F2 | 除反映林产工业对林业产业经济发展贡献度、林业产业结构特征外,还间接反映为发展林产工业排放污染废弃物、CO2等导致生态破坏、环境损害的压力,正向指标 | 0.540 | 0.281 | ||
| 人均GDP F3 | 除反映一般社会经济发展水平外,还间接反映为发展社会经济开发利用森林资源、加工利用木材等而破坏生态、损害环境的压力,正向指标 | 0.470 | 0.245 | ||
| 城市化水平F4 | 同上 | 0.460 | 0.240 | ||
| 环境容量C(状态和响应指标) | 森林覆盖率X6、森林蓄积量X7、森林采伐量X8、森林消长比X9、人均森林面积X10、单位造林面积X11、营林投资占比X12、工业污染治理率X13、林业投资占比X14…… | 森林覆盖率C1 | 反映在压力作用下森林资源的总体丰富程度,间接反映资源禀赋强弱,正向指标 | 0.580 | 0.148 |
| 森林消长比C2 | 森林采伐消耗量与蓄积生长量之比,反映在压力作用下,森林资源总量的动态变化,间接反映木材利用、供给、森林结构、质量以及资源更能能力状况,值越大,更新力慢,负向指标 | |-0.550|③ | 0.141 | ||
| 人均森林面积C3 | 反映在压力作用下,森林资源的人均丰富程度,间接反映森林资源禀赋强弱、森林固碳制氧能力,正向指标 | 0.720 | 0.184 | ||
| 单位造林面积C4 | 反映人类应对负面影响所做的积极响应,反映人工造林力度、绿色发展状况,间接反映森林质量、资源更新力,正向指标 | 0.740 | 0.189 | ||
| 营林投资占比C5 | 反映人类应对负面影响所做的积极响应,反映人工造林资本投入力度,间接反映林业一产结构及对林业的贡献,正向指标 | 0.680 | 0.174 | ||
| 工业污染治理率C6 | 反映人类应对负面影响所做的积极响应,间接反映林业绿色度,正向指标 | 0.640 | 0.164 | ||
| 森林生态E(影响指标) | 生态林面积比X15、林业自然保护区面积比X16、水土流失面积X17、空气质量指数X18、森林灾害面积比X19…… | 生态林面积比E1 | 反映森林结构对森林生态效益的影响,间接反映森林资源禀赋强弱、森林结构特征,正向指标 | 0.380 | 0.189 |
| 森林灾害面积比E2 | 反映森林灾害对森林生态效益的影响,间接反映森林资源质量,正向指标 | 0.630 | 0.313 | ||
| 水土流失面积E3 | 反映水土流失对森林生态效益的影响,间接反映森林质量、森林资源更新力,正向指标 | 0.580 | 0.289 | ||
| 空气质量指数E4 | 反映大气生态状况对森林生态效益的影响,间接反映森林质量、固碳制氧能力,正向指标 | |-0.420|④ | 0.209 |
Figure 3 Operation paths coefficients of indicators for forestry ecological security based on SEM图3 基于SEM的林业生态安全指标作用路径系数 |
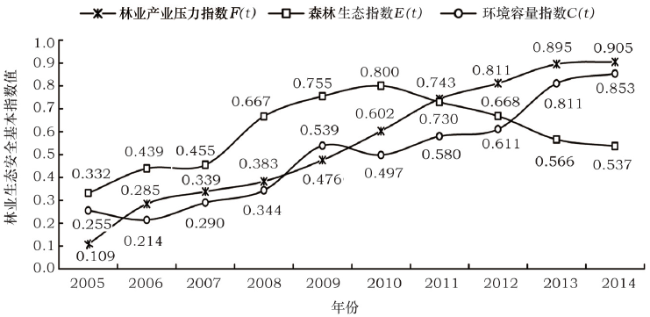
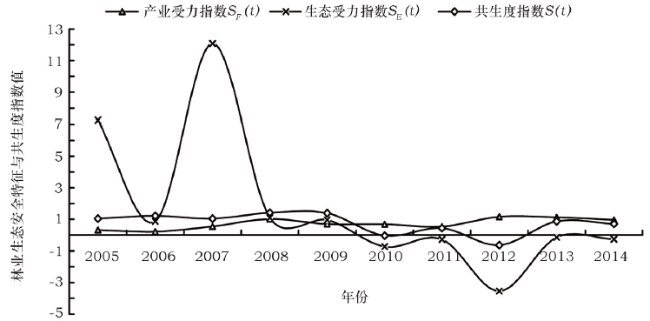
Figure 4 Calculation results of the basic indexes for forestry ecological security in China from 2005 to 2014图4 2005-2014年中国林业生态安全基本指数测度结果 |
Table 2 Judgment criterions for state and pre-warning ranks of forestry ecological security表2 林业生态安全状态和预警等级判据标准 |
| 序号 | 生态受力指数SE(t) | 共生度指数S(t) | 生态-产业共生关系 | 安全状态 | 预警等级 |
|---|---|---|---|---|---|
| 1 | SE(t)<0 | -1<S(t)<0 | 产业获利生态受损 | 危险 | 红色预警(Red Pre-warning,RP) |
| 2 | SE(t)<0 | -<S(t)<-1 | 生态受损产业受损 | 高风险 | 橙色预警(Orange Pre-warning,OP) |
| 3 | SE(t)>0 | -1≤S(t)<0 | 产业受损生态获利 | 风险 | 黄色预警(Yellow Pre-warning,YP) |
| 4 | SE(t)>0 | 0≤S(t)<1 | 产业受损生态获利 | 亚健康 | 蓝色预警(Blue Pre-warning,BP) |
| 5 | SE(t)<0 | 0≤S(t)<1/3 | 产业获利生态受损 | 低康复 | 转折橙色预警(Transition Orange Pre-warning,TOP) |
| 6 | SE(t)<0 | 1/3≤S(t)<2/3 | 产业获利生态受损 | 中康复 | 转折黄色预警(Transition Yellow Pre-warning,TYP) |
| 7 | SE(t)<0 | 2/3≤S(t)<1 | 产业获利生态受损 | 高康复 | 转折蓝色预警(Transition Blue Pre-warning,TBP) |
| 8 | SE(t)>0 | 1≤S(t)≤ | 生态产业互利共生 | 健康 | 绿色安全(Green Security,GS) |
Figure 5 Judgment results of state and pre-warning ranks for forestry ecological security in China from 2005 to 2014图5 2005-2014年中国林业生态安全状态及预警等级评价结果 |
Table 3 Judgment results of state and pre-warning ranks for forestry ecological security in 31 provinces of China from 2006 to 2014表3 2006-2014年中国31省域林业生态安全状态及预警等级评判结果 |
| 年份 | 2006 | 2007 | 2008 | 2009 | 2010 | 2011 | 2012 | 2013 | 2014 | 年份 | 2006 | 2007 | 2008 | 2009 | 2010 | 2011 | 2012 | 2013 | 2014 |
|---|---|---|---|---|---|---|---|---|---|---|---|---|---|---|---|---|---|---|---|
| 北京 | GS | TYP | OP | GS | OP | BP | TYP | OP | OP | 湖北 | YP | RP | OP | RP | OP | BP | OP | GS | GS |
| 天津 | BP | TBP | RP | BP | OP | GS | GS | TYP | OP | 湖南 | OP | TBP | OP | GS | OP | BP | OP | GS | GS |
| 河北 | OP | GS | OP | GS | BP | GS | OP | RP | RP | 广东 | GS | TBP | TOP | OP | TBP | OP | GS | GS | GS |
| 山西 | OP | OP | YP | BP | BP | BP | OP | YP | YP | 广西 | RP | TOP | OP | OP | TYP | OP | YP | GS | GS |
| 内蒙古 | GS | GS | BP | GS | OP | BP | GS | RP | RP | 海南 | OP | OP | OP | TBP | OP | OP | TBP | GS | GS |
| 辽宁 | BP | TYP | GS | BP | TBP | YP | GS | TYP | TYP | 重庆 | TOP | OP | OP | GS | OP | OP | OP | OP | RP |
| 吉林 | BP | TBP | GS | RP | BP | BP | TOP | TYP | TYP | 四川 | TBP | RP | YP | GS | BP | OP | GS | GS | GS |
| 黑龙江 | GS | TOP | YP | RP | YP | BP | GS | TYP | TYP | 贵州 | RP | OP | OP | GS | BP | OP | TOP | GS | GS |
| 上海 | OP | GS | TBP | GS | GS | GS | GS | TBP | TBP | 云南 | RP | OP | OP | OP | YP | BP | TBP | GS | GS |
| 江苏 | GS | GS | TBP | TOP | GS | GS | TBP | GS | GS | 西藏 | GS | OP | BP | BP | OP | OP | OP | OP | OP |
| 浙江 | GS | GS | BP | GS | GS | TBP | GS | GS | GS | 陕西 | BP | OP | OP | GS | GS | GS | BP | OP | OP |
| 安徽 | GS | GS | GS | GS | GS | GS | GS | GS | GS | 甘肃 | OP | OP | BP | OP | GS | BP | OP | OP | OP |
| 福建 | RP | TBP | OP | TBP | OP | TYP | TBP | GS | GS | 青海 | BP | RP | BP | RP | GS | BP | YP | OP | OP |
| 江西 | OP | TOP | OP | TOP | OP | BP | OP | GS | GS | 宁夏 | RP | TOP | OP | YP | OP | BP | OP | OP | OP |
| 山东 | YP | RP | YP | BP | GS | GS | RP | BP | GS | 新疆 | GS | OP | BP | YP | RP | BP | OP | OP | OP |
| 河南 | GS | GS | BP | RP | YP | BP | RP | YP | RP | ||||||||||
注:OP表示橙色预警[SE(t)<0、<S(t)<-1],RP表示红色预警[SE(t)<0、-1<S(t)<0],BP表示蓝色预警[SE(t)>0、0≤S(t)<1];YP为黄色预警[SE(t)>0、-1≤S(t)<0];GS为绿色安全[SE(t)>0、1≤S(t)≤];TOP为转折橙色预警[SE(t)<0、0≤S(t)<1/3];TBP为转折蓝色预警[SE(t)<0、2/3≤S(t)<1];TYP为转折黄色预警[SE(t)<0、1/3≤S(t)<2/3]。 |
Table 4 Judgment results of pre-warning ranks for forestry ecological security and comparison with current existing research in 2013表4 本文林业生态安全预警等级评判结果与已有相关研究[19](2013年)的比较 |
| 结果对比 | 健康 GS | 高康复 TBP | 中康复 TYP | 低康复 TOP | 亚健康BP | 风险 YP | 高风险 OP | 危险 RP |
|---|---|---|---|---|---|---|---|---|
| 本文研究 结果 | 福建、湖北、江西、广东、江苏、海南、四川、安徽、浙江、湖南、广西、云南、贵州 | 上海 | 辽宁、吉林、黑龙江、天津 | (无) | 山东 | 河南、山西 | 新疆、重庆、陕西、西藏、宁夏、甘肃、青海、北京 | 内蒙古、 河北 |
| 已有研究测度结果[19] | 吉林、海南、四川、福建、云南、湖北、宁夏、黑龙江、辽宁、陕西、江苏、重庆、北京、河北、广西、湖南、山东、甘肃、上海、广东、浙江、河南 | 安徽 | (无) | (无) | 天津、山西、贵州、西藏、青海 | 江西 | 新疆 | 内蒙古 |
| 对“已有研究测度结果”的评论 | 处于GS状态的省域数量过多,占比70.97%;已有研究结果与许多省域的实际发展情况吻合度低 | 安徽林业产业压力指数与森林生态指数均靠前,应处于GS状态而非TBP状态 | 本文测得4省域处于此状态,而已有研究测得处于TYP状态的省域空缺,和实际情况吻合度低 | (无) | 贵州、青海产业与生态发展较好,应处于GS状态而非BP状态 | 江西为林业大省,林业产业压力指数与森林生态指数均靠前,应处于GS状态而非YP状态 | 与实际情况基本吻合 | 与实际情况基本吻合 |
注:根据本研究提出的新方法,利用相关统计资料数据,测得处于“低康复TOP”状态的省域空缺。 |
The authors have declared that no competing interests exist.
| [1] |
[
|
| [2] |
[
|
| [3] |
[
|
| [4] |
|
| [5] |
|
| [6] |
|
| [7] |
|
| [8] |
|
| [9] |
[
|
| [10] |
[
|
| [11] |
[
|
| [12] |
[
|
| [13] |
[
|
| [14] |
[
|
| [15] |
[
|
| [16] |
[
|
| [17] |
[
|
| [18] |
[
|
| [19] |
[
|
| [20] |
[
|
| [21] |
|
| [22] |
United Nation Division for Sustainable Development. Indicators of Sustainable Development:Guideline and Methodologies[R]. New York:UNDSD,2001.
|
| [23] |
|
| [24] |
|
| [25] |
[
|
| [26] |
[
|
| [27] |
[
|
| [28] |
|
| [29] |
|
| [30] |
|
| [31] |
|
| [32] |
|
| [33] |
|
| [34] |
中华人民共和国国家统计局. 中国统计年鉴(2005-2015)[M]. 北京:中国统计出版社,2005-2015.
[National Bureau of Stati-stics of the People’s Republic of China. China Statistical Yearbook (2005-2015)[M]. Beijing:China Statistical Press,2005-2015.]
|
| [35] |
中华人民共和国国家林业局. 中国林业统计年鉴(2004-2014)[M]. 北京:中国林业出版社,2004-2014.
[State Forestry Admi-nistration of the People’s Republic of China. China Forestry Statistical Yearbook (2004-2014)[M]. Beijing:China Forestry Publishing House,2004-2014.]
|
| [36] |
中华人民共和国国家统计局,中华人民共和国环境保护部. 中国环境统计年鉴(2004-2014)[M]. 北京:中国统计出版社,2004-2014.
[National Bureau of Statistics of the People’s Republic of China,Ministry of Environmental Protection of the People’s Republic of China. China Statistical Yearbook on Environment (2004-2014)[M]. Beijing:China Statistical Press,2004-2014.]
|
| [37] |
中国统计信息网.统计公报总索引/分省区索引[DB/OL]. 2010-01-22.
[China statistical information network. Statistical bulletin total index/ each provincial index [DB/OL]. 2010-01-22.]
|
| [38] |
[CNKI,China academic journal electronic magazine co. LTD.China economy and social development statistical database/ statistical yearbook index [DB/OL].
|
| [39] |
[
|
| [40] |
[
|
/
| 〈 |
|
〉 |