
青海湖流域不同海拔高度土壤水分时空变化特征
作者简介:刘磊,男,河南信阳人,硕士生,主要从事生态水文研究。E-mail:lliu526@mail.bnu.edu.cn
收稿日期: 2016-04-27
要求修回日期: 2016-09-18
网络出版日期: 2017-02-20
基金资助
国家自然科学基金重点项目(41130640)
教育部“创新团队发展计划”项目(IRT_15R06)
Variation in soil water content along different altitude gradients in the Qinghai Lake Watershed
Received date: 2016-04-27
Request revised date: 2016-09-18
Online published: 2017-02-20
Copyright
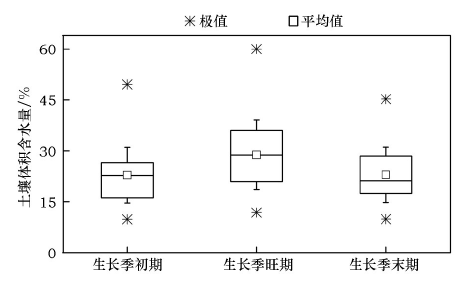
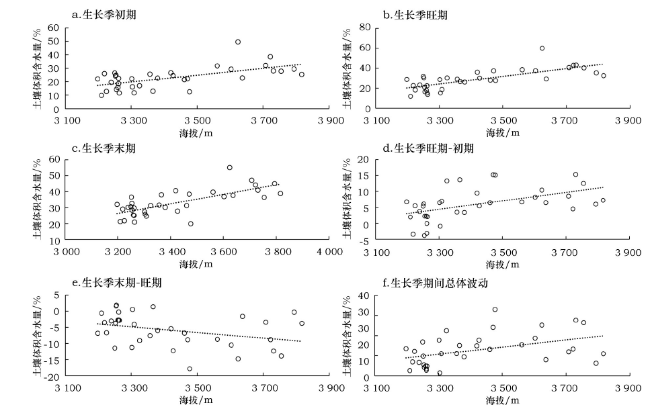
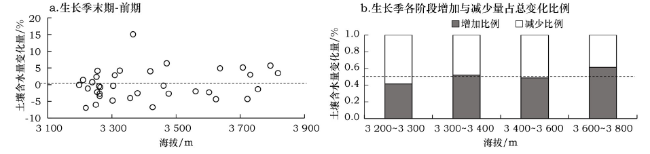
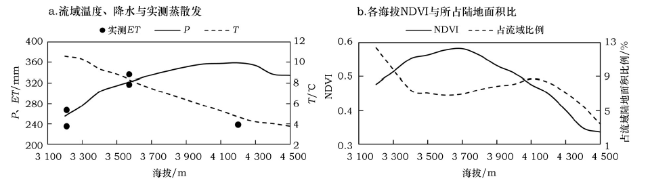
在气候变化背景下探讨流域不同海拔高度的土壤水分状况,对于深入认识变化环境下流域水资源特征具有十分重要的意义。本文通过对青海湖流域不同海拔高度的土壤水分采样,探讨了流域土壤水分的时空变化规律,并对生长季流域不同海拔的水分盈亏状况进行了初步分析,结果表明:①流域平均土壤含水量在生长季旺期达到峰值(28.79%),生长季初期(22.81%)和生长季末期(22.91%)相对较低;随海拔的升高,流域土壤含水量不断增加,且在生长季旺期增加最为显著(P<0.01);②经过一个生长季,湖滨3200~3300m海拔范围内土壤水分收支略有亏缺,减少1.24%,3300~3400m和3400~3600m海拔范围内,水分收支基本平衡,分别增加0.54%和-0.57%,3600~3800m海拔范围内,水分收支有所盈余,增加3.69%;流域海拔3800m以上地区为水分盈余区,且该区域对气候变化较为敏感,气温升高一旦导致流域水分收支平衡区向高海拔推进,将会使青海湖流域水分盈余区大面积减小,进而对流域水资源造成严重影响。
刘磊 , 李小雁 , 蒋志云 , 魏俊奇 , 南木甲 . 青海湖流域不同海拔高度土壤水分时空变化特征[J]. 资源科学, 2017 , 39(2) : 263 -275 . DOI: 10.18402/resci.2017.02.09
Understanding soil water content variation at different altitudes is fundamental to identifying spatial variation in water resources across a watershed,especially under a changing climate. Here,we evaluated spatial and temporal variation in soil water content along different altitude gradients in the Qinghai Lake watershed. With the integrative consideration of temperature,precipitation,evapotranspiration and the normalized difference vegetation index(NDVI)during the growth season,water deficits of areas at different altitudes were explored. We found that the average soil water content(ASWC)during the middle of the growing season was the maximum(28.79%),higher than the beginning and end of the growing season in 2015,22.81% and 22.91,respectively. ASWC increased with altitude during the growing season,and there was a positive correlation between them,particularly in the middle of the growing season(P < 0.01). The analysis of water budget indicated that regions with altitudes of 3200~3300m were water deficit regions in the watershed,with a decrease of 1.24% in soil water after a growing season. Water budgets in regions with altitudes of 3300~3400m and 3400~3600m were almost balanced,which increases of 0.54% and -0.57%,respectively; an increase of 3.69% was identified in regions with altitudes of 3600~3800m. Regions with altitudes higher than 3800m were considered as water supply regions in the Qinghai Lake watershed. However,the water supply regions have been highly vulnerable to climate change and will decrease sharply if climate warming continues. This will influence water resources deeply in the watershed and have critical effects on the basin and its society and ecosystems.
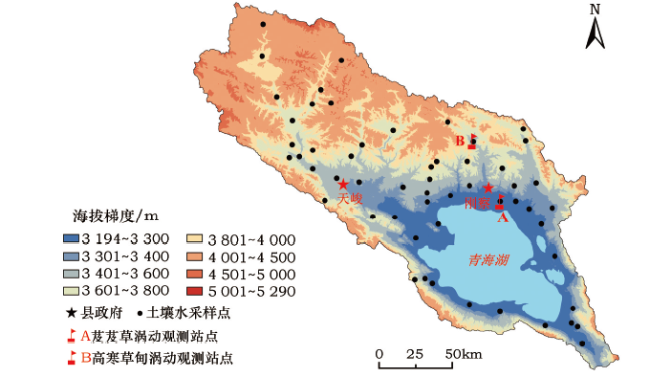
Figure 1 Altitude gradients and soil water sample sites in Qinghai Lake Watershed图1 青海湖流域海拔分布及土壤水分采样点空间分布 |
Figure 2 Soil moisture variation in different growing season periods of 2015 in Qinghai Lake Watershed图2 2015年青海湖流域生长季不同阶段流域土壤水分变化 |
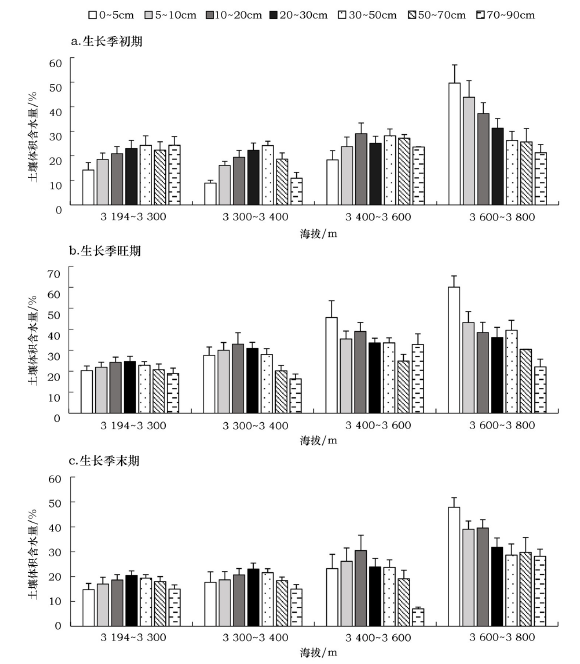
Figure 3 Vertical variation of soil moisture in different altitude gradients and different growing season periods of 2015图3 2015年生长季不同阶段不同深度的土壤含水量随海拔的变化 |
Table 1 The correlation between altitudes and soil moisture content of Qinghai Lake Watershed in different growing season periods of 2015表1 2015年青海湖流域生长季不同阶段土壤水含量与海拔的相关性系数表 |
| 生长季 初期 | 生长季 旺期 | 生长季 末期 | 生长季 旺期-初期※ | 生长季 末期-旺期※ | 生长季 初期-末期※※ | 生长季 末期-初期※ | ||
|---|---|---|---|---|---|---|---|---|
| Pearson 相关性 | 0.606** | 0.736** | 0.717** | 0.505** | -0.337* | 0.439** | 0.195 | |
| 显著性(双侧) | 0.000 | 0.000 | 0.000 | 0.002 | 0.048 | 0.008 | 0.263 | |
注:※为前后者土壤体积含水量之差,※※ 表示生长季初期到生长季旺期和生长季旺期到生长季末期土壤体积含水量差的绝对值之和;**为在0.01 水平(双侧)上显著相关;*为在 0.05水平(双侧)上显著相关。 |
Table 2 Soil moisture and relative water content in different altitude gradients of Qinghai Lake Watershed in different growing season periods of 2015表2 2015年青海湖流域生长季各海拔梯度的土壤含水量与相对土壤含水量 |
| 海拔梯度/m | 绝对含水量/% | 相对含水量/% | |||||
|---|---|---|---|---|---|---|---|
| 生长季初期 | 生长季旺期 | 生长季末期 | 生长季初期 | 生长季旺期 | 生长季末期 | ||
| 3200~3300 | 19.10±1.60 | 21.05±1.76 | 17.93±1.34 | 57.91±5.06 | 63.76±5.51 | 54.35±4.27 | |
| 3300~3400 | 18.33±1.98 | 24.96±2.17 | 19.81±1.71 | 53.40±6.83 | 73.16±8.24 | 57.26±5.18 | |
| 3400~3600 | 24.04±2.36 | 33.55±1.81 | 23.51±2.89 | 65.71±6.75 | 91.41±5.27 | 64.01±7.75 | |
| 3600~3800 | 31.69±3.05 | 40.56±3.30 | 33.20±2.18 | 79.24±7.70 | 93.90±4.14 | 83.09±5.59 | |
注:相对含水量指实际土壤含水量与田间持水量的比值。 |
Figure 4 The regime of soil moisture variation along different altitude gradients of Qinghai Lake Watershed in different growing season periods of 2015 |
Table 3 Relationship of soil moisture variation and altitude gradients of Qinghai Lake Watershed in different growing season periods of 2015表3 2015年青海湖流域生长季期间流域不同海拔高度的土壤体积含水量变化 |
| 海拔梯度/m | 增加量/% | 减少量/% | 波动量/%* | 增加比例 | 减少比例 | 累计增加量/%** | 标准误差 |
|---|---|---|---|---|---|---|---|
| 3 194~3 300 | 3.00 | 4.24 | 7.24 | 0.415 | 0.585 | -1.24 | 0.083 |
| 3 300~3 400 | 6.57 | 6.03 | 12.59 | 0.521 | 0.479 | 0.54 | 0.092 |
| 3 400~3 600 | 9.49 | 10.06 | 19.55 | 0.485 | 0.515 | -0.57 | 0.044 |
| 3 600~3 800 | 9.96 | 6.27 | 16.23 | 0.614 | 0.386 | 3.69 | 0.073 |
注:* 为从生长季初期到生长季旺期和从生长季旺期到生长季末期土壤体积含水量增加量与减少量之和;** 为生长季末期与生长季前期土壤体积含水量之差。 |
Figure 5 Variance of soil moisture contents of Qinghai Lake Watershed after the growing season of 2015图5 2015年青海湖流域生长季前后土壤含水量变化 |
Figure 6 Relationships between elevation (meters above sea level)and precipitation,temperature,NDVI,ET and area fraction of every altitude gradient |
The authors have declared that no competing interests exist.
| [1] |
|
| [2] |
|
| [3] |
|
| [4] |
|
| [5] |
[
|
| [6] |
[
|
| [7] |
[
|
| [8] |
[
|
| [9] |
|
| [10] |
[
|
| [11] |
[
|
| [12] |
|
| [13] |
[
|
| [14] |
[
|
| [15] |
|
| [16] |
|
| [17] |
|
| [18] |
|
| [19] |
[
|
| [20] |
|
| [21] |
[
|
| [22] |
[
|
| [23] |
[
|
| [24] |
[
|
| [25] |
[
|
| [26] |
|
| [27] |
|
| [28] |
|
| [29] |
|
| [30] |
|
| [31] |
|
| [32] |
|
| [33] |
|
| [34] |
[
|
| [35] |
[
|
| [36] |
|
| [37] |
|
| [38] |
[
|
| [39] |
|
| [40] |
[
|
| [41] |
|
| [42] |
|
| [43] |
|
| [44] |
|
| [45] |
|
| [46] |
[
|
| [47] |
[
|
/
| 〈 |
|
〉 |