
中国海洋旅游基地适宜性综合评价研究
作者简介:孙静,女,辽宁铁岭人,硕士生,主要从事城市规划、旅游、土地利用研究。305861611@qq.com
收稿日期: 2016-06-19
要求修回日期: 2016-10-30
网络出版日期: 2016-12-20
基金资助
国家自然科学基金项目(41471140,41671151)
国家旅游局“国家旅游示范基地标准”项目
The comprehensive evaluation of suitability of marine tourism base in China
Received date: 2016-06-19
Request revised date: 2016-10-30
Online published: 2016-12-20
Copyright
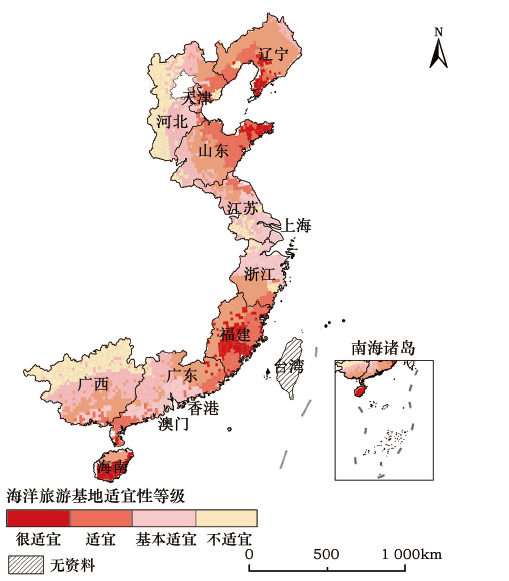
海洋旅游代表着中国旅游业转型升级的重要方向,研究以当前海洋旅游资源为基础,综合分析沿海地区建设国家海洋旅游基地的适宜性。研究结果表明:①中国海洋旅游基地的发展主要集中在渤海海域中的辽东半岛东部海域、黄海海域中的山东半岛东北部海域、东海海域中的闽南海域和南海海域中的海南岛以及三沙市等区域的沿海城市;②在海洋旅游资源基础方面,南海南部海域、粤西海域、桂东、桂西海域沿海地区的海洋旅游资源丰富多样,适合风景观光、滨海浴场、沙滩、海岛型等滨海旅游度假区的协同开发;③在旅游产业发展和潜力方面,长三角和珠三角沿海地区中心城市可依靠产业发展和潜力优势,改善资源环境基础,打造海洋旅游国际滨海城市旅游目的地,协同城市群创新发展海洋旅游产业。
孙静 , 杨俊 , 席建超 . 中国海洋旅游基地适宜性综合评价研究[J]. 资源科学, 2016 , 38(12) : 2244 -2255 . DOI: 10.18402/resci.2016.12.05
Marine tourism represents an important direction in China's tourism industry transformation and upgrade. Here we use pluralistic geographic information data based on a GIS spatial platform to analyze tourism resources,current tourism development and the future of marine tourism. Comprehensive assessment of appropriate regional national marine tourism demonstration base construction. We found that China’s marine tourism development is mainly concentrated on the Eastern Liaodong Peninsula in the Bohai Sea,northeastern Shandong Peninsula in the Huanghai Sea,the Minnan Sea,East China Sea and southwest Hainan Island in the South China Sea. Marine tourism industry development mainly depends on the development model of urban + tourist,specifically targeting Sanya,Xiamen,Dalian and Weihai,as urban regions relying on coastal tourist resorts as marine tourism demonstrations. Dalian and Weihai also need further planning for the development direction of the marine industry;mining industry developmental characteristics give full play to the northern coastal city as marine tourism leaders. On the basis of resources,the southern waters of the South China Sea,western Guangdong,and eastern and western waters in Guangxi rich in marine tourism resources are suitable for co-development of coastal beaches,island-types and other coastal tourist resorts. Sansha,Beihai and Yangjiang city are key areas for marine tourism in the future. In industrial development and potential,the Yangtze River Delta and Pearl River Delta coastal regional centers have industrial development potential. We need to improve the resource base environment and build an international coastal city of marine tourism destinations,innovate urban agglomeration collaboratives,develop the marine tourism industry,rationally use rich coastal and island resources,and lead international marine tourism development.
Key words: marine tourism base; suitability; comprehensive evaluation
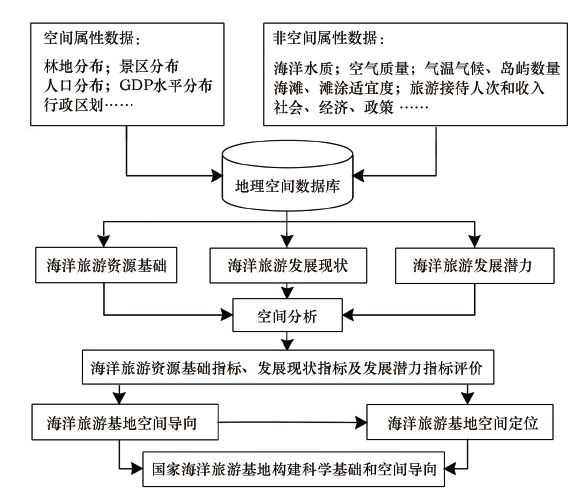
Figure 1 Research route图1 研究路线 |
Table 1 The suitability evaluation index system of marine tourism base in China表1 中国海洋旅游基地适宜性评价指标体系 |
| 目标层 | 领域层(权重) | 因素层(权重) | 指标说明 |
|---|---|---|---|
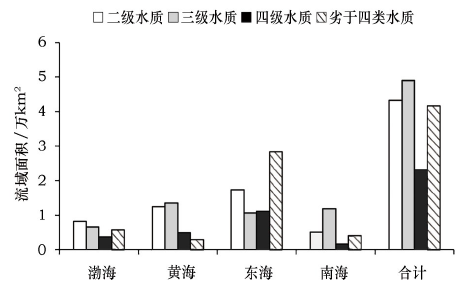
| 综合指数 | 旅游资源基础指标(0.623) | 海洋水质(0.125) | 依据国家海洋水质标准海水水质分为四类,第一类适用于海洋渔业、自然和生物保护;第二类适用于水产养殖区,海水浴场和海上运动或娱乐,以及与食用直接有关的工业用水;第三类 适用于一般工业用水区和滨海风景旅游区;第四类适用于海洋港口水域,海洋开发作业区。海洋水质类别越高,指标赋值越高。 |
| 滩涂、海滩适宜度 (0.115) | 滨海滩涂或海滩生态状态,沙滩、珊瑚礁、或者丘陵等资源可以做滨海度假区,红树林可以作为滨海自然观光资源,淤泥和滩涂则不具备海洋旅游利用价值。按照其海滩、滩涂特征依次顺序赋值。 | ||
| 岛屿数量(0.115) | 各滨海海域的岛屿数值越大,指标赋值越高。 | ||
| 气候舒适度(0.113) | 依据UTCI舒适度指数模型选取海洋基地,将基本条件最佳舒适度区间设定在16~26℃,并计算各沿海城市UTCI达标天数比率。达标天数比率越大,指标赋值越高。 | ||
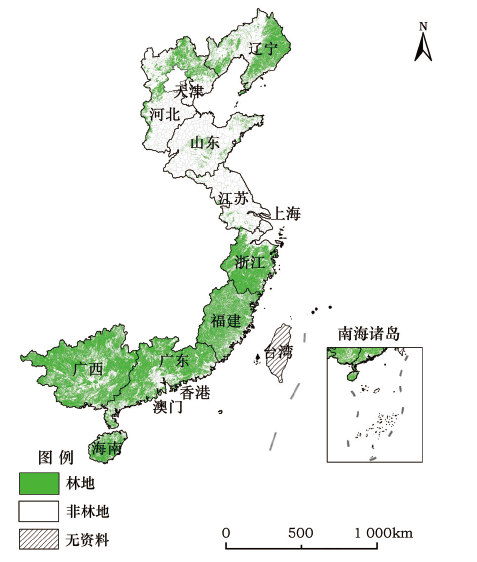
| 森林覆盖率(0.078) | 森林覆盖率是体现旅游景区生态环境质量的重要因素。森林覆盖率=森林面积/区域面积(以地级市为单位)。森林覆盖率越大,指标赋值越高。 | ||
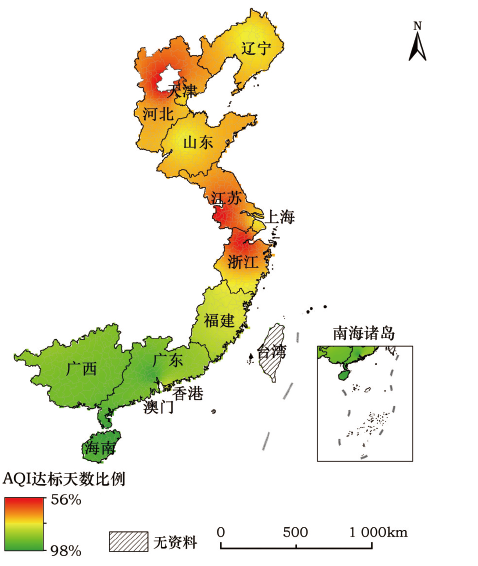
| 空气质量(0.077) | 空气质量是衡量旅游景区环境质量的重要因素。AQI达标率=AQI达标天数/366。达标比例越大,指标赋值越高。 | ||
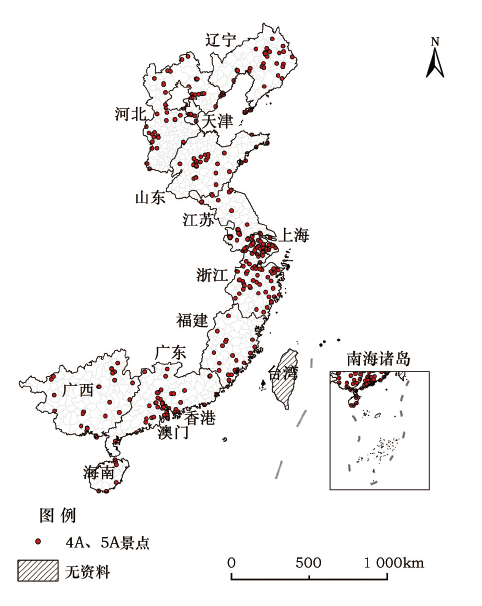
| 旅游发展现状指标(0.174) | 旅游景区景点个数 (0.092) | 统计各滨海区域内5A和4A级旅游景区总数和以海洋旅游为中心的5A级景区数。景区数量越多,指标赋值越高。 | |
| 旅游收入水平和接 待人次(0.082) | 统计各滨海区域旅游总收入总和以及接待国内外旅游总人数。统计值越高,指标赋值越高。 | ||
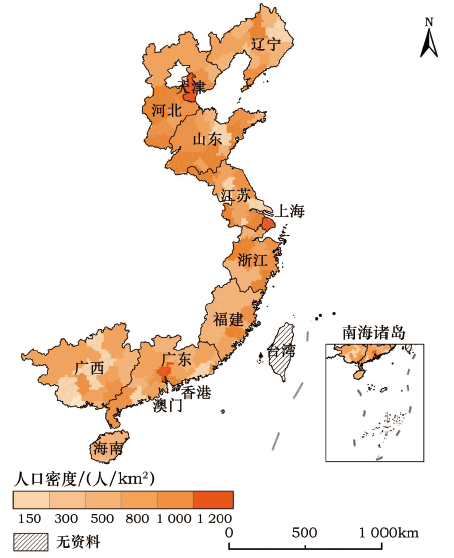
| 旅游发展潜力指标(0.203) | 人口密度(0. 091) | 人口密度与区域经济基础、地理位置和建设条件等密切相关,在一定程度上反映旅游产业的发展潜力, 人口密度=总人口数量/土地面积。人口密度越大,指标赋值越高。 | |
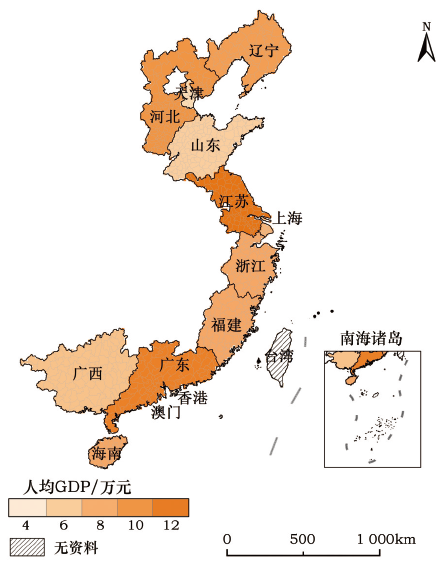
| 经济水平(0.112) | 经济水平用城市人均GDP水平及增长速率表示,经济发展水平=f([人均GDP],[GDP增长率])。经济水平越高,因子赋值越高。 |
Table 2 Data sources and description表2 数据来源与说明 |
| 数据信息 | 数据来源 |
|---|---|
| 海洋水质、滩涂或海滩健康状态、空气质量空间分布状态数据 | 中华人民共和国环境保护部[25] |
| 海洋环境、生态状况以及滨海旅游休闲娱乐区经济状况 | 中国海洋信息网[26] |
| 海洋经济统计数据 | 中国国家海洋局[27] |
| 城市人口、绿化、经济、交通及地区生产总值构成等全国各市(区、县)人口、经济、收入水平数据 | 《中国统计年鉴(2014)》[28] |
| 全国旅游业概况、地方旅游业概况、公报、政策法规、统计资料及旅游机构、主要经济指标及星级饭店综合资料等 | 《2014年中国旅游景区发展报告》[29] |
| 旅游业GDP数据 | 中华人民共和国国家旅游局[30] |
Figure 2 The sea water quality standard statistical results of China in 2014图2 2014年中国管辖海域水质统计结果 |
Figure 3 The spatial distribution of forest of China 's coastal areas in 2014 |
Figure 4 The spatial distribution of AQI of China 's coastal areas in 2014 |
Figure 5 The spatial distribution of 4A and 5A scenic spot of China 's coastal areas in 2014 |
Table3 The statistical results of the level of tourism development in coastal province (Municipality/Autonomous Region) in 2014表3 2014年沿海省(直辖市、自治区)旅游业发展水平统计数据 |
| 沿海省 (直辖市、自治区) | 接待 人次 /亿人次 | 旅游总 收入 /亿元 | 沿海省 (直辖市、自治区) | 接待 人次 /亿人次 | 旅游总 收入 /亿元 |
|---|---|---|---|---|---|
| 辽宁 | 2.24 | 1 846 | 浙江 | 4.88 | 6 300 |
| 河北 | 3.15 | 2 561 | 福建 | 2.34 | 2 707 |
| 天津 | 1.56 | 2 307 | 广东 | 3.26 | 9 227 |
| 山东 | 5.91 | 5 800 | 海南 | 0.48 | 485 |
| 江苏 | 5.74 | 8 145 | 广西 | 2.86 | 2 495 |
| 上海 | 2.68 | 3 415 | 港、澳、台 | 无资料 | 无资料 |
Figure 6 The distribution of population density of China 's coastal areas in 2014 |
Figure 7 The distribution of Per GDP of China 's coastal areas in 2014 |
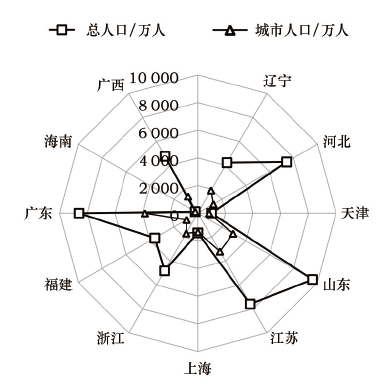
Figure 8 The demographics of China 's coastal areas in 2014图8 2014年中国沿海地区人口统计 |
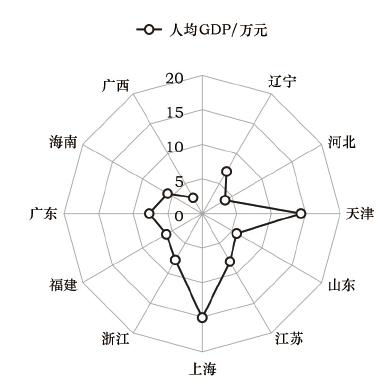
Figure 9 The per GDP of China 's coastal areas in 2014图9 2014年中国沿海地区人均GDP统计 |
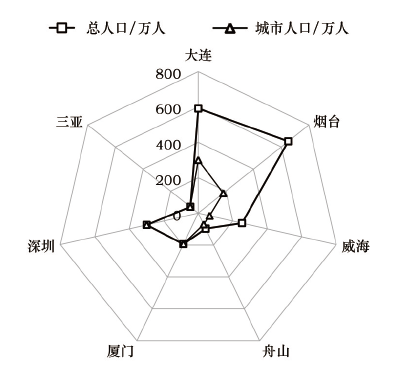
Figure 10 The demographics of China 's key marine tourism city in 2014图10 2014年中国重点海洋旅游城市人口统计 |
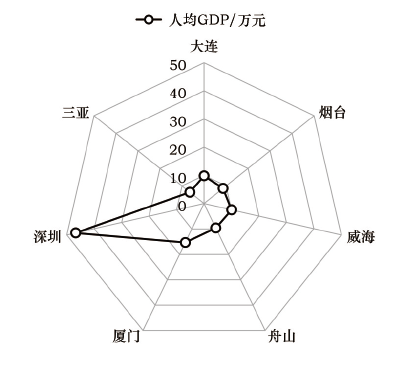
Figure 11 The per GDP of China 's key marine tourism city in 2014图11 2014年中国重点海洋旅游城市人均GDP统计 |
Figure 12 The suitability grades distribution of marine tourism base of China in 2014 |
Table 4 The suitability division of marine tourism in China表4 中国海洋旅游适宜度划分 |
| 滨海区位 | 适宜度等级 | 滨海区位 | 适宜度等级 | ||||||
|---|---|---|---|---|---|---|---|---|---|
| 很适宜 | 适宜 | 基本适宜 | 不适宜 | 很适宜 | 适宜 | 基本适宜 | 不适宜 | ||
| 辽东半岛西部滨海区 | √ | 闽中滨海区 | √ | ||||||
| 辽河三角洲滨海区 | √ | 闽南滨海区 | √ | ||||||
| 辽西冀东滨海区 | √ | 东海陆架滨海区 | √ | ||||||
| 渤海湾海域 | √ | 台湾海峡海域 | √ | ||||||
| 黄河口与山东半岛西北部滨海区 | √ | 粤东滨海区 | √ | ||||||
| 渤海中部滨海区 | √ | 珠江三角洲滨海区 | √ | ||||||
| 辽东半岛东部滨海区 | √ | 粤西滨海区 | √ | ||||||
| 山东半岛东北部滨海区 | √ | 桂东滨海区 | √ | ||||||
| 山东半岛南部滨海区 | √ | 桂西滨海区 | √ | ||||||
| 江苏沿岸滨海区 | √ | 海南岛东北部海域 | √ | ||||||
| 黄海陆架滨海区 | √ | 海南岛西南滨海区 | √ | ||||||
| 长江三角洲及舟山群岛滨海区 | √ | 南海北部滨海区 | √ | ||||||
| 浙中南滨海区 | √ | 南海中部滨海区 | √ | ||||||
| 闽东滨海区 | √ | 南海南部滨海区 | √ | ||||||
The authors have declared that no competing interests exist.
| [1] |
[
|
| [2] |
[
|
| [3] |
|
| [4] |
[
|
| [5] |
|
| [6] |
|
| [7] |
|
| [8] |
[
|
| [9] |
[
|
| [10] |
[
|
| [11] |
[
|
| [12] |
|
| [13] |
[
|
| [14] |
[
|
| [15] |
[
|
| [16] |
[
|
| [17] |
|
| [18] |
|
| [19] |
[
|
| [20] |
[
|
| [21] |
[
|
| [22] |
[
|
| [23] |
[
|
| [24] |
[
|
| [25] |
[
|
| [26] |
[
|
| [27] |
[
|
| [28] |
[
|
| [29] |
[
|
| [30] |
[
|
| [31] |
[
|
/
| 〈 |
|
〉 |