
中国水泥生产碳排放系数省区空间差异性及成因分析
作者简介:赵建安,男,山西洪洞人,研究员,主要从事资源开发利用与区域经济发展研究。E-mail:zhaoja@igsnrr.ac.cn
收稿日期: 2016-01-10
要求修回日期: 2016-08-10
网络出版日期: 2016-09-22
基金资助
中国科学院先导项目(XDA05010400)
中国建筑材料科学研究总院委托项目(中国水泥CO2排放地理图)
Spatial and causal analysis of discrepancies in CO2 emission factors for cement production among provinces in China
Received date: 2016-01-10
Request revised date: 2016-08-10
Online published: 2016-09-22
Copyright
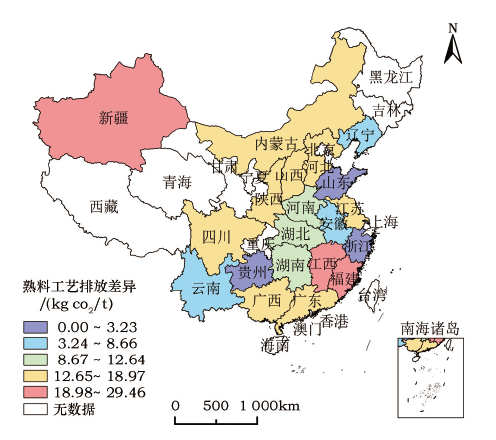
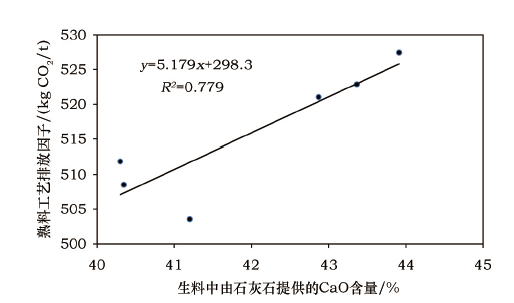
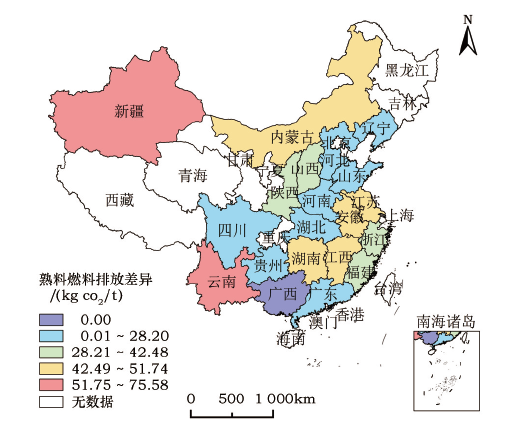
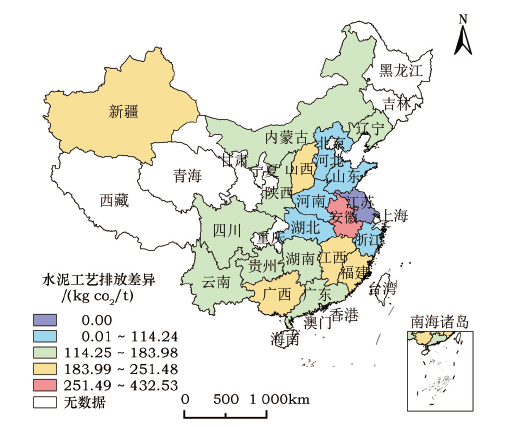
中国作为全球最大水泥生产国,水泥生产碳排放量大。除因产能、产量规模差异形成省区间排放总量差异外,碳排放系数区域差异也影响着总排放量不同。本文以省区为单元,基于全国20个主要水泥生产省区的碳排放系数抽样调查基础数据,分析和比较了省区间水泥熟料工艺碳排放系数、熟料燃料碳排放系数、水泥工艺碳排放系数、水泥燃料碳排放系数及间接碳排放系数的空间差异,结合ArcGIS对各类碳排放系数的空间差异分布进行直观体现;并以生产线为对象分析省区间水泥生产碳排放系数存在空间差异的原因。相关分析结果表明:水泥熟料工艺碳排放系数在总体上呈现由西部、中部省区向东部省区递减的态势,差异性产生的原因主要是省区间水泥用石灰石品质的不同,即生料中石灰石的CaO含量起到基本决定作用,替代材料用量及CaO比例也会产生一定影响;熟料燃料碳排放系数总体分布格局是东部沿海省区相对较低,中西部省区较高,差异原因主要是各省区水泥生产线所用煤炭种类及低位发热值的差异。煤炭低位发热值较高的省区,燃料碳排放系数就越小;水泥工艺碳排放系数及燃料碳排放系数的总体格局是多数东部沿海省区相对较低,中西部多数省区相对较高。差异主要与水泥熟料比直接相关,熟料比越低则水泥碳排放系数亦越小;间接碳排放系数主要由大区电力生产碳排放系数所决定,但水泥生产线余热发电对间接碳排放系数亦有影响。
赵建安 , 郑宗强 , 曹植 , 姚建华 . 中国水泥生产碳排放系数省区空间差异性及成因分析[J]. 资源科学, 2016 , 38(9) : 1791 -1800 . DOI: 10.18402/resci.2016.09.16
As the largest producer of cement worldwide,China is also the biggest emitter of CO2 emissions. It has been widely recognized that CO2 emission factors affect and define regional CO2 emissions,capacity and scale. We therefore discuss regional spatial differences in CO2 emission factors in terms of the CO2 emission factor of the clinker process,CO2 emission factor of clinker fuel,CO2 emission factor of cement processes,CO2 emission factor of cement fuel and indirect CO2 emission factor in provinces based on sampling survey data. To identify differences,we produced five corresponding thematic maps to view the spatial distribution. Our results indicate that the spatial distribution characteristics of four preceding items are almost the same:the eastern coastal provinces are relatively low and central and west regions are higher. As for the indirect CO2 emission factor,it is mainly decided by the CO2 emission factor of the Chinese regional power grid;its distribution feature is ambiguous. We further explored sources of differences in CO2 emission factors among provinces. We argue differences in the CaO content of limestone and raw material additives affect the results. However,differences in the CaO content of limestone are critical. Differences in the CO2 emission factor of clinker fuel are because of the coal low calorific value. The lower average low calorific value,the less the CO2 emission factor of clinker fuel. In the cement grinding process,power consumption produces CO2 emissions. So the spatial variances of the CO2 emission factor of the cement process and fuel are highly related to the clinker-cement ratio. The spatial differences in indirect CO2 emission factor between the twenty provinces is small,and mainly decided by CO2 emission factor of Chinese regional power grids. Whether cement production lines own the waste heat power generation also reduces the indirect CO2 emission factor.
Table 1 The sampling situation of production line表1 生产线抽样情况 |
| 序号 | 产能 /万t | 石灰石CaO 比重/% | 石灰石MgO 比重/% | 熟料产量 /万t | 标煤消耗 /(kg/t-cli) | |
|---|---|---|---|---|---|---|
| 东部 | 1 | 2 500 | 50.86 | 1.74 | 78.50 | 109.59 |
| 2 | 2 500 | 51.08 | 0.98 | 76.00 | 105.47 | |
| 3 | 5 000 | 49.07 | 2.69 | 133.00 | 118.07 | |
| 4 | 5 000 | 49.00 | 1.36 | 156.00 | 117.34 | |
| 中部 | 5 | 2 500 | 49.65 | 1.29 | 82.06 | 133.19 |
| 6 | 2 500 | 50.12 | 1.16 | 67.57 | 112.90 | |
| 7 | 5 000 | 51.06 | 0.79 | 180.00 | 104.36 | |
| 8 | 5 000 | 54.58 | 0.31 | 180.00 | 101.00 | |
| 西部 | 9 | 2 500 | 53.06 | 0.77 | 115.26 | 125.42 |
| 10 | 2 500 | 49.65 | 2.83 | 67.57 | 109.83 | |
| 11 | 5 000 | 49.39 | 1.23 | 180.11 | 101.86 | |
| 12 | 5 000 | 52.17 | 0.65 | 184.40 | 123.84 |
注:表中数据为2011-2013年部分省区抽样调查新型干法水泥生产样本在线物性数据,样本原始数据为生产线全年12个月综合平均值。其中1、3号样本生产线来自山东省,2、4号线来自浙江省,5、7号线来自湖北省,6、8号线来自陕西省,9、11号线来自广西自治区,10、12号生产线来自四川省。 |
Table 2 Calculational results of CO2 emissions factor表2 碳排放系数推算结果 |
| 最大值 | 最小值 | 中位数 | |
|---|---|---|---|
| 工艺碳排放系数(kgCO2/t-cli) | 537.766 | 508.305 | 520.942 |
| 燃料碳排放系数(kgCO2/t-cli) | 344.820 | 269.235 | 308.733 |
| 工艺碳排放系数(kgCO2/t-ce) | 605.526 | 172.999 | 351.859 |
| 燃料碳排放系数(kgCO2/t-ce) | 375.870 | 103.823 | 195.637 |
| 间接排放系数(kgCO2/t-cli) | 78.726 | 22.823 | 42.859 |
数据来源说明:表中数据为198条新型干法水泥生产线抽样调查物性数据集成分析后产生的结果。 |
Table 3 Production of clinker and cement products in China in 2013表3 2013年中国各省区水泥熟料与水泥产量 |
| 省区 | 硅酸盐熟料产量 /万t | 窑外分解窑产量 /万t | 水泥产量 /万t |
|---|---|---|---|
| 全国合计 | 136 151.11 | 119 480.73 | 241 439.66 |
| 北京 | 655.66 | 655.65 | 900.54 |
| 天津 | 163.17 | 163.17 | 951.88 |
| 河北 | 5 775.37 | 5 471.61 | 12 676.24 |
| 山西 | 2 809.89 | 2 538.28 | 4 984.85 |
| 辽宁 | 3 117.98 | 3 031.92 | 6 005.24 |
| 吉林 | 3 106.40 | 2 950.01 | 4 502.92 |
| 上海 | 40.39 | 40.39 | 750.31 |
| 黑龙江 | 1 581.72 | 1 270.16 | 4 028.48 |
| 江苏 | 5 292.52 | 5 259.86 | 17 991.86 |
| 福建 | 4 875.93 | 4 618.41 | 7 890.37 |
| 浙江 | 5 540.33 | 5 483.27 | 12 462.87 |
| 安徽 | 12 255.00 | 11 533.60 | 12 131.37 |
| 江西 | 5 243.36 | 4 526.81 | 9 204.20 |
| 山东 | 8 896.43 | 7 655.71 | 16 217.81 |
| 湖北 | 5 733.94 | 3 691.58 | 11 056.52 |
| 河南 | 7 450.25 | 6 815.40 | 16 764.44 |
| 广东 | 7 099.23 | 6 363.26 | 13 394.93 |
| 湖南 | 5 819.56 | 5 006.53 | 11 264.67 |
| 海南 | 1 365.65 | 1 365.65 | 1 988.36 |
| 四川 | 8 205.94 | 5 522.66 | 13 897.09 |
| 重庆 | 4 384.93 | 3 520.06 | 6 126.95 |
| 贵州 | 5 646.58 | 4 817.33 | 8 140.51 |
| 陕西 | 5 082.45 | 3 923.17 | 8 545.52 |
| 云南 | 6 229.42 | 5 492.21 | 9 009.16 |
| 青海 | 976.56 | 710.84 | 1 786.29 |
| 甘肃 | 2 953.51 | 2 552.85 | 4 412.73 |
| 内蒙古 | 3 238.33 | 2 831.05 | 6 395.72 |
| 广西 | 7 436.58 | 7 001.80 | 10 707.48 |
| 西藏 | 225.78 | 183.99 | 295.82 |
| 宁夏 | 1 302.28 | 1 119.87 | 1 914.28 |
| 新疆 | 3 645.95 | 3 363.61 | 5 040.25 |
资料来源:2014年02月18日的中国产业信息网(http://www.chyxx.com/data/)相关数据整理。 |
Figure 1 The distribution of CO2 emission factor of clinker process in China图1 熟料工艺碳排放系数省区差异分布 |
Table 4 Chemical composition analysis and proportion of partial raw materials for 2500t/d production line表4 2500t/d生产线原料化学成分分析及部分生料配比 |
| 区域 | 2 500t/d | 石灰石中CaO 比重/% | 石灰石占生料 比重/% | 生料中其他 材料 | 材料占生料 比重/% | 工艺碳排放系数 /(kgCO2/t-cli) |
|---|---|---|---|---|---|---|
| 东部 | 1 | 50.86 | 79.73 | 转炉渣、砂岩 | 6.14、5.10 | 482.280 |
| 2 | 51.08 | 81.00 | 砂页岩、钢渣 | 3.60 | 489.810 | |
| 中部 | 3 | 49.65 | 85.70 | 砂岩、粉煤灰、硫酸渣 | 8.60、2.40、3.30 | 521.920 |
| 4 | 50.12 | 79.50 | 粘土 、粉煤灰等 | 13.10、4.00 | 522.800 | |
| 西部 | 5 | 49.65 | 83.00 | 砂页岩、铁矿石 | 5.00、3.00 | 531.430 |
| 6 | 53.06 | 82.70 | 砂岩、硫酸渣 | 14.30、3.10 | 527.526 |
Table 5 Chemical composition analysis and proportion of partial raw materials for 5000t/d production line表5 5000t/d生产线原料化学成分分析及部分生料配比 |
| 区域 | 5 000t/d | 石灰石中CaO 比重/% | 石灰石占生料 比重/% | 生料中其他 材料 | 材料占生料 比重/% | 工艺碳排放系数 /(kgCO2/t-cli) |
|---|---|---|---|---|---|---|
| 东部 | 1 | 49.00 | 84.09 | 煤矸石、砂岩 | 1.32、31.05 | 503.580 |
| 2 | 49.07 | 82.23 | 煤矸石、铁矿石等 | 10.80、4.60 | 508.540 | |
| 中部 | 3 | 54.58 | 73.84 | 粘土、转炉渣 | 18.50、4.00 | 511.900 |
| 4 | 51.06 | 86.00 | 砂岩、页岩 | 1.50、9.00 | 527.450 | |
| 西部 | 5 | 52.17 | 83.12 | 砂岩、煤矸石等 | 6.80、10.00 | 522.870 |
| 6 | 49.39 | 86.80 | 页岩,铁矿石 | 3.40,3.50 | 521.033 |
Figure 2 The relationship between CO2 emission factor of clinker process and CaO content of limestone图2 熟料工艺碳排放系数与石灰石提供CaO比例的关系 |
Figure 3 The distribution of CO2 emission factor for clinker fuel in China图3 熟料燃料碳排放系数省区差异分布 |
Table 6 Low calorific value and CO2 emission factor of fuel in partial provinces表6 部分省区水泥生产煤炭低位发热值及燃料碳排放系数 |
| 省份 | 煤炭低位平均发热值 /(MJ/kg) | 燃料碳排放系数 /(kgCO2/t-cli) |
|---|---|---|
| 山东 | 23.68 | 286.26 |
| 河南 | 23.06 | 287.67 |
| 河北 | 22.26 | 273.85 |
| 辽宁 | 22.88 | 284.03 |
| 新疆 | 22.18 | 344.82 |
| 云南 | 20.27 | 336.37 |
数据来源说明:煤炭低位发热值数据为企业一年度年平均值,燃料碳排放系数为年均值。 |
Figure 4 The distribution of CO2 emission factor for cement process in China图4 水泥工艺碳排放系数省区差异分布 |
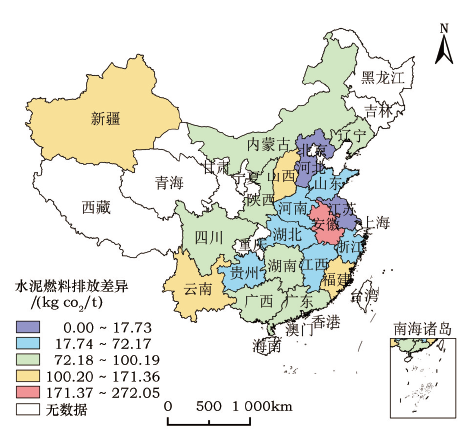
Figure 5 The distribution of CO2 emission factor for cement fuel in China图5 水泥燃料碳排放系数省区差异分布 |
Table 7 The clinker-cement ratio of 20 provinces in China表7 20个水泥生产主要省区水泥熟料比 |
| 省份 | 水泥熟料比/% | 省份 | 水泥熟料比/% |
|---|---|---|---|
| 辽宁 | 50.49 | 河南 | 40.65 |
| 河北 | 43.16 | 湖南 | 44.44 |
| 江苏 | 29.23 | 湖北 | 33.39 |
| 福建 | 58.53 | 江西 | 49.18 |
| 广东 | 47.50 | 内蒙古 | 44.26 |
| 山东 | 47.21 | 四川 | 39.74 |
| 浙江 | 44.00 | 云南 | 60.96 |
| 广西 | 65.39 | 陕西 | 45.91 |
| 山西 | 50.92 | 新疆 | 66.73 |
| 安徽 | 95.07 | 贵州 | 59.18 |
Table 8 CO2 emission factor of Chinese regional power grid in 2013表8 2013年中国区域电网CO2排放系数 |
| 区域电网 | 电力排放系数(kgCO2/kWh) |
|---|---|
| 华北区域电网 | 1.030 2 |
| 东北区域电网 | 1.112 0 |
| 华东区域电网 | 0.810 0 |
| 华中区域电网 | 0.977 9 |
| 西北区域电网 | 0.972 0 |
| 南方区域电网 | 0.922 3 |
资料来源:2013年09月17日,国家发改委气候司(http://www.ccchina.gov.cn/archiver/cdmcn/UpFile/Files/Default/20130917081426863466.pdf)。 |
The authors have declared that no competing interests exist.
| [1] |
[
|
| [2] |
[
|
| [3] |
[
|
| [4] |
[
|
| [5] |
[
|
| [6] |
[
|
| [7] |
|
| [8] |
|
| [9] |
|
| [10] |
|
| [11] |
[
|
| [12] |
|
| [13] |
|
| [14] |
|
| [15] |
[
|
| [16] |
[
|
| [17] |
[
|
| [18] |
[
|
| [19] |
[
|
| [20] |
[
|
| [21] |
[
|
| [22] |
[
|
| [23] |
[
|
| [24] |
[
|
| [25] |
[
|
| [26] |
[
|
| [27] |
[
|
| [28] |
[
|
| [29] |
[
|
/
| 〈 |
|
〉 |