
香格里拉未来50a主要气候环境要素变化预估——基于小波分析和多元 VAR 回归预估模型
作者简介:刘盈曦,女,云南昆明人,博士,讲师,主要研究方向为环境经济学。E-mail:yingxi.liu.0711@gmail.com
收稿日期: 2016-01-10
要求修回日期: 2016-06-05
网络出版日期: 2016-09-22
基金资助
云南财经大学科学研究基金项目(YC2013D11)
国家自然科学基金项目(41165004)
NSFC-云南联合基金重点项目(U09336
Climatic and environmental changes in Shangri-La in next 50 years according to wavelet analysis and multiple VAR regression prediction modeling
Received date: 2016-01-10
Request revised date: 2016-06-05
Online published: 2016-09-22
Copyright
采用云南省香格里拉气象站55a(1958-2012)的逐年气温、降水量、绝对湿度、相对湿度和霜日数资料,引入多元最小二乘估计模型(多元OLS)、多元向量自回归模型(多元VAR)和结构方程模型,基于Morlet连续复小波(Cmor)变换的主周期数据,探索未来50a香格里拉气温等气候环境要素的定量预估模型、变化趋势及5个主要气候环境要素的相互关系。结果表明:未来50a内香格里拉的气温以0.44℃/10a的速率升高,50a后气温将升高2℃左右;降水以围绕平均值做周期振荡为主,并以14.7mm/10a的速率增多;绝对湿度以0.06 mg/L/10a的速率增大,并有明显的周期振荡;相对湿度以-0.96%/10a的速率减小,并有周期振荡;年霜日数以-2.8d/10a的速率减少,并有周期振荡。绝对湿度、相对湿度和霜日数的变化与气温和降水的变化显著相关,气温变化对湿度和霜日数的影响大于降水量的影响,气温的持续升高是除降水外其他气候要素变化的主要原因。
刘盈曦 , 彭贵芬 , 陈先刚 , 杨宇明 . 香格里拉未来50a主要气候环境要素变化预估——基于小波分析和多元 VAR 回归预估模型[J]. 资源科学, 2016 , 38(9) : 1754 -1767 . DOI: 10.18402/resci.2016.09.13
Using main cycle data transformed from Molet continuous complex wavelet (CMOR) we explored Shangri-La’s five main climatic and environmental factors'(yearly temperature,precipitation,absolute huidity,relative humidity and frost days)quantitative prediction models,variation trends and multiple relations based on multiple Ordinary Least Squares (OLS)model,multiple Vector Auto-regression (VAR)modeling and Structural Equation Model(SEM). The raw data was from the Shangri-La meteorological station in Yunnan,China from 1958 to 2012. We conclude that in next 50 years,Shangri-La’s temperature will increase at a rate of 0.44 ℃/10a,it will rise about 2℃ after 50 years,reaching about 9℃. Shangri-La’s precipitation shows periodic oscillation around its mean value,increasing at a rate of 14.7mm/10a. Shangri-La’s absolute humidity will increase at a rate of 0.06 mg/L/10a with obvious periodic oscillation. Shangri-La’s relative humidity will decrease at a rate of -0.96 %/10a with periodic oscillation. Shangri-La’s yearly frosty days will decrease at a rate of -2.8 d/10a with periodic oscillation Shangri-La’s temperature,precipitation and frost days were dependent on temperature and precipitation;temperature’s effect is greater than precipitation’s;and a continuous increase in temperature is the main reason for changes in all other climatic factors,except precipitation.
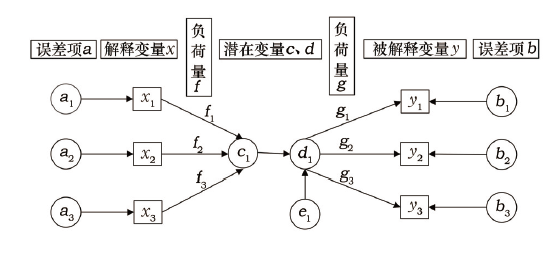
Figure 1 An example of structural equation model图1 SEM结构方程式体系的一个例子 |
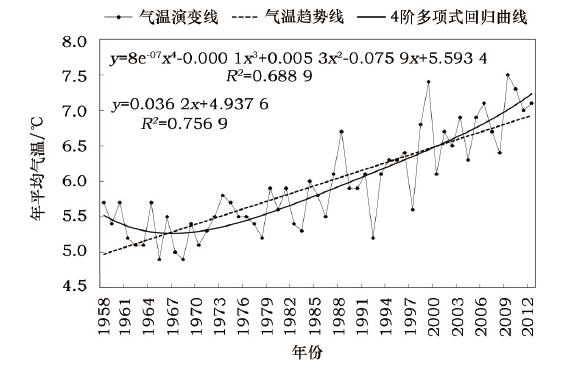
Figure 2 Temperature’s linear trend and 4 order polynomial regression图2 气温直线趋势和4阶多项式回归分析 |
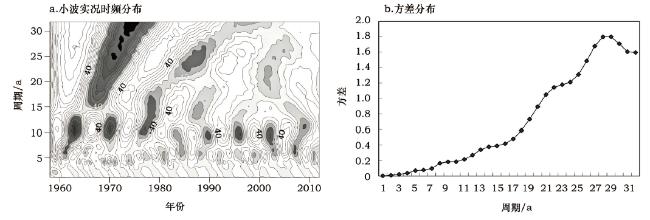
Figure 3 Temperature’s real part of wavelet time frequency distribution and wavelet variance distribution图3 气温小波实部时频分布和方差分布 |
Table 1 Regression results of multiple ols regression model表1 气温多元OLS模型回归结果表 |
| 因子 | 回归系数(T检验的P值) |
|---|---|
| 9a主周期 | 0.017 2 (0.702) |
| 14a主周期 | 0.031 5 (0.107) |
| 28a主周期 | 0.032 9***(0.001) |
| 趋势项 | 0.043 6***(0.000) |
| 常数项 | 5.076 0***(0.000) |
| N | 55.000 0 |
| R | 0.872 0 |
注:***表示因子通过了1%的显著性检验水平。 |
Table 2 Prediction on annual temperature change based on VAR Model表2 VAR模型年气温变化预估结果 |
| 预估年数 | 10a | 20a | 30a | 40a | 50a |
|---|---|---|---|---|---|
| 预估年份 | 2022 | 2032 | 2042 | 2052 | 2062 |
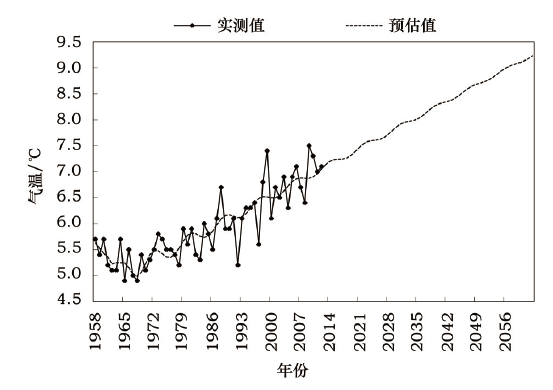
| 气温值/℃ | 7.537 | 7.956 | 8.351 | 8.774 | 9.229 |
| 增速/(℃/10a) | 0.437 | 0.419 | 0.395 | 0.423 | 0.455 |
Figure 4 Temperature simulation based on main cycles’ coefficients图4 主周期系数气温模拟趋势 |
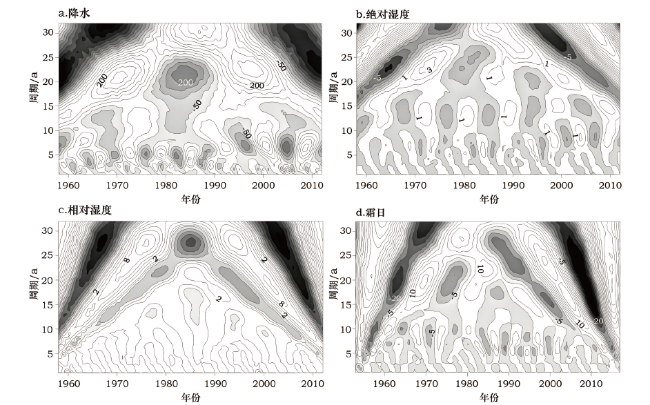
Figure 5 Real part of wavelet time frequency distribution of precipitation、absolute humidity、relative humidity and frost days图5 降水、绝对湿度、相对湿度和霜日的小波时频分布 |
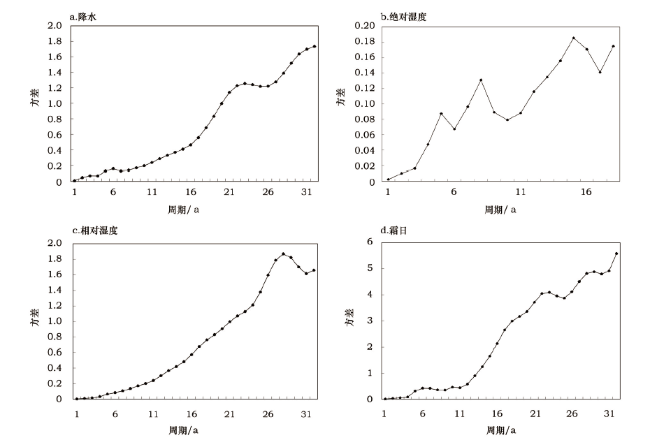
Figure 6 Precipitation,absolute humidity,relative humidity and frost days’s wavelet variance distribution图6 降水、绝对湿度、相对湿度、霜日的方差分布 |
Table 3 Analyzed results of factors prediction based on multiple OLS Modelling表3 多元OLS模型预估因子分析结果 |
| 降水量 | 绝对湿度 | 相对湿度 | 霜日 | ||||
|---|---|---|---|---|---|---|---|
| 3a主周期 | 3.945 0 (0.121) | 5a主周期 | 0.069 0***(0.006) | 28a主周期 | -0.325 0* (0.059) | 6a主周期 | 0.822 0***(0.001) |
| 6a主周期 | 0.381 0 (0.308) | 8a主周期 | 0.068 9***(0.001) | 31a主周期 | 1.119 0** (0.034) | 8a主周期 | 0.327 0 (0.146) |
| 7a主周期 | 0.655 0 (0.187) | 15a主周期 | 0.034 7* (0.059) | 32a主周期 | -0.852 0** (0.023) | 22a主周期 | 0.887 0 (0.129) |
| 13a主周期 | 0.669 0***(0.001) | 23a主周期 | 0.009 7 (0.215) | 23a主周期 | -0.764 0 (0.220) | ||
| 22a主周期 | 0.210 0 (0.225) | 31a主周期 | 0.002 5 (0.605) | 28a主周期 | -0.445 0 (0.375) | ||
| 31a主周期 | 0.543 0 (0.355) | 29a主周期 | 0.491 0 (0.274) | ||||
| 趋势项 | 0.934 0 (0.216) | 趋势项 | 0.005 6***(0.000) | 趋势项 | -0.087 5***(0.000) | 趋势项 | -0.341 0***(0.000) |
| 常数项 | 611.200 0***(0.000) | 常数项 | 6.756 0***(0.000) | 常数项 | 71.340 0***(0.000) | 常数项 | 159.400 0***(0.000) |
| N | 55 | N | 55 | N | 55 | N | 55 |
| R | 0.609 | R | 0.714 | R | 0.744 | R | 0.669 |
注:括号内为T检验的P值,*p< 0.05,**p< 0.01,***p< 0.001。 |
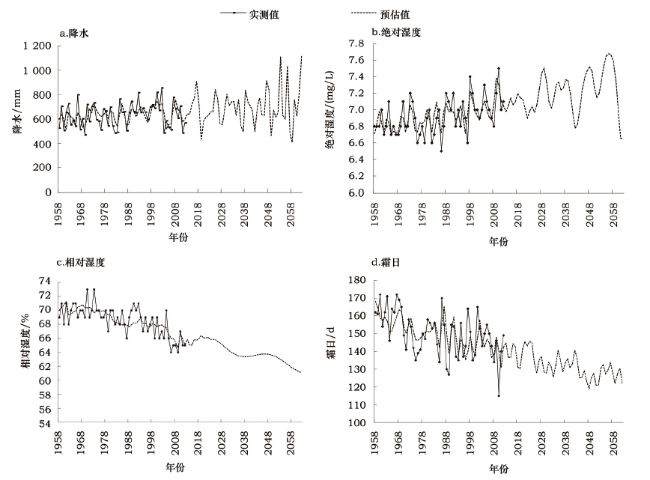
Figure 7 Yearly prediction on climate factor图7 未来50a气候要素逐年预估趋势 |
Table 4 Prediction on climate facter change for next 50 years表4 未来50a气候要素变化预估结果 |
| 预估年数 | 10a | 20a | 30a | 40a | 50a | 未来50a 变率/10a |
|---|---|---|---|---|---|---|
| 预估年份 | 2013-2022 | 2023-2032 | 2033-2042 | 2043-2052 | 2053-2062 | |
| 年降水量/mm | 664.845 5 | 696.612 1 | 660.637 9 | 689.148 8 | 755.739 1 | 14.729 0 |
| 年平均绝对湿度/(mg/L) | 7.072 0 | 7.173 0 | 7.189 0 | 7.257 0 | 7.311 0 | 0.060 0 |
| 年平均相对湿度/% | 65.819 0 | 65.115 0 | 63.497 0 | 63.604 0 | 61.981 0 | -0.960 0 |
| 年霜日/d | 139.647 0 | 134.549 0 | 133.642 0 | 125.293 0 | 128.380 0 | -2.817 0 |
Table 5 Tests of structural equation model of climatic and environmental system coupling relationship in Shangri-La表5 香格里拉气候环境系统耦合关系结构方程模型检验结果 |
| 检验统计量 | P> | RMSEA | CFI | TLI | 总体R2 |
|---|---|---|---|---|---|
| 拟合标准 | >0.05 | <0.1 | >0.9 | >0.90 | >80% |
| 检验结果 | 0.743 | 0.000 | 1.000 | 1.082 | 93.6% |
| 模型适配判断 | 是 | 是 | 是 | 是 | 是 |
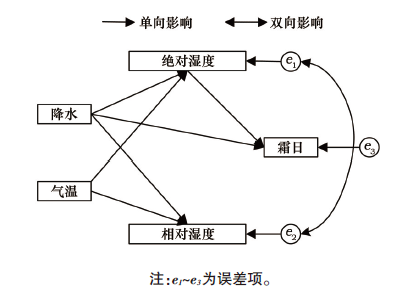
Figure 8 Structural equation model of climatic and environmental system coupling relationship in Shangri-La图8 香格里拉气候环境系统耦合关系结构方程模型 |
Table 6 Regression results of structural equation model of climatic and environmental system coupling relationship in Shangri-La表6 香格里拉气候环境系统耦合关系结构方程模型回归结果 |
| 被解释变量 | 解释变量 | 系数 | 标准差 | Z | P>|z| | 95%的置信区间 | R | ||
|---|---|---|---|---|---|---|---|---|---|
| 结构方程 | 绝对湿度 | 降水 | 0.175** | 0.075 | 2.34 | 0.019 | 0.028 | 0.322 | 0.66 |
| 气温 | 0.631*** | 0.054 | 11.73 | 0.000 | 0.526 | 0.737 | |||
| 常数项 | 26.090*** | 2.926 | 8.92 | 0.000 | 20.355 | 31.826 | |||
| 相对湿度 | 降水 | 0.210*** | 0.069 | 3.05 | 0.002 | 0.075 | 0.345 | 0.76 | |
| 气温 | -0.738*** | 0.043 | -17.11 | 0.000 | -0.823 | -0.654 | |||
| 常数项 | 37.411*** | 2.068 | 18.09 | 0.000 | 33.357 | 41.464 | |||
| 霜日 | 绝对湿度 | -0.298** | 0.132 | -2.25 | 0.024 | -0.557 | -0.039 | 0.56 | |
| 降水 | -0.175* | 0.101 | -1.74 | 0.083 | -0.373 | 0.023 | |||
| 气温 | -0.267** | 0.116 | -2.30 | 0.022 | -0.494 | -0.039 | |||
| 常数项 | 25.231*** | 3.340 | 7.55 | 0.000 | 18.679 | 31.785 | |||
| 残差的协方差 | 相对湿度与绝对湿度 | 0.843*** | 0.039 | 21.57 | 0.000 | 0.766 | 0.919 | ||
注:P为Z的检验值;*、 ** 和***分别表示因子通过了10%、5%和1%的显著性检验水平。 |
The authors have declared that no competing interests exist.
| [1] |
[
|
| [2] |
|
| [3] |
[
|
| [4] |
[
|
| [5] |
[
|
| [6] |
[
|
| [7] |
[
|
| [8] |
[
|
| [9] |
[
|
| [10] |
[
|
| [11] |
[
|
| [12] |
[
|
| [13] |
[
|
| [14] |
[
|
| [15] |
[
|
| [16] |
[
|
| [17] |
[
|
| [18] |
[
|
| [19] |
[
|
| [20] |
[
|
| [21] |
[
|
| [22] |
[
|
| [23] |
[
|
| [24] |
[
|
| [25] |
|
| [26] |
|
| [27] |
[
|
| [28] |
[
|
| [29] |
|
| [30] |
[
|
| [31] |
|
| [32] |
|
| [33] |
[
|
| [34] |
[
|
| [35] |
[
|
| [36] |
[
|
| [37] |
[
|
| [38] |
[
|
| [39] |
[
|
| [40] |
[
|
| [41] |
[
|
| [42] |
[
|
| [43] |
[
|
/
| 〈 |
|
〉 |