
青海湖流域生态服务价值时空格局变化及其影响因子研究
作者简介:姜翠红,女,山东肥城人,副研究员,主要从事土地利用与气候变化,农业资源评价等。E-mail:caujiangch@126.com
收稿日期: 2016-02-26
要求修回日期: 2016-05-26
网络出版日期: 2016-08-25
基金资助
国家自然科学基金项目(41401057)
国家测绘地理信息局2016年国家基础测绘科技与标准计划项目(2016KJ0202)
Spatial-temporal pattern variation and impact factors of ecosystem service values in the Qinghai Lake Watershed
Received date: 2016-02-26
Request revised date: 2016-05-26
Online published: 2016-08-25
Copyright
生态系统服务价值核算对于环境可持续性、人类福祉与经济发展分析、政策框架制定具有重要参考意义。 本研究选取以高寒草地为主要覆盖类型的青海湖流域为研究区域,采用从植被茂盛程度和提供生态服务的有效时间两个维度修正后的EGESV模型,分别对青海湖流域2000年、2012年生态服务价值进行评估并分析了其空间格局变化特征及其影响因子。研究结果表明,2012年青海湖流域内各覆盖类型提供的生态服务价值总量为157.93亿元,比2000年增加了1.24亿元。2000年各覆盖类型提供的生态服务价值总量呈现水域>草地>森林>农田>荒漠>城镇,2012年荒漠生态服务价值总量超过农田的生态服务价值总量。不同的土地覆盖类型空间格局在整体空间上决定着青海湖流域生态服务价值空间格局的异质性。由于草地生态系统内部植被茂盛程度、生长季长度的差异,生态服务价值在空间上整体呈现纬度地带性,部分区域表现出垂直地带性变化特征。受人类活动、气候变化的双重干扰,流域内生态服务价值空间格局变化明显,呈现部分地区高生态服务价值的集聚化分布向均匀化转变,草地生态服务价值在空间上整体升高,青海湖高生态服务价值区域范围扩张。人类活动干扰下的土地利用变化是流域内生态服务价值总量降低的主要原因,而气候变化对流域生态系统的潜在影响利于流域生态服务价值总量的增加。该研究结果可为政府制定气候变化趋势下青海湖流域生态环境保护政策提供科学的依据。
姜翠红 , 李广泳 , 程滔 , 陈占涛 , 张浩然 . 青海湖流域生态服务价值时空格局变化及其影响因子研究[J]. 资源科学, 2016 , 38(8) : 1572 -1584 . DOI: 10.18402/resci.2016.08.15
The Qinghai Lake watershed has mostly alpine meadow cover. We used a modified Costanza’s model,revised to incorporate the extent of vegetation lushness and the effective time of vegetation providing ecosystem services to evaluate ecosystem service values (ESV)and analyze spatial patterns for the year 2000 and 2012. The results show that the total ESV of the Qinghai Lake watershed was 1.54×10¹² CNY,a rise of 1.20×10⁸ CNY on 2000. Water was the main source of Qinghai Lake watershed ESV,followed by grassland,woodland,farmland,and desert in 2000; however,the total ESV of desert exceeded farmland because of farmland area decline and desert area increases in 2012. Different land cover type spatial patterns in the whole space determined spatial pattern heterogeneity for ESVs in the Qinghai Lake watershed. Grassland ESV showed a latitudinal zonal pattern across the whole space,while some areas showed vertical zonal variation because of vegetation coverage and growing season changes across latitudes and vertical zones. ESV spatial patterns change significantly under the double disturbance of human activities and climate change,some regions with high ESVs from concentration distribution to uniform,grassland ESV in the space increased,and the range of Qinghai Lake with high ESV expanded. Land use change under human disturbance was the main reason to reduce total ESV,and the potential impact of climate change on ecosystems helps to increase ESV of the watershed. These data provide a scientific basis for the government to make ecological environmental protection policy under climate change for the Qinghai Lake watershed.
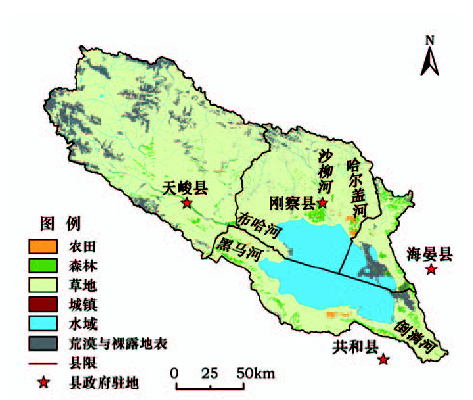
Figure 1 Qinghai Lake watershed land cover in 2012图1 2012年青海湖流域土地覆被 |
Table 1 Classification of terrestrial ecosystem based on land cover classification of geographical conditions census表1 基于地理国情普查地表覆盖分类体系的陆地生态系统类型划分 |
| 陆地生态系统类型 | 地理国情普查地表覆盖类型(分类代码) |
|---|---|
| 农田生态系统 | 水田(0110)、旱地(0120) |
| 森林生态系统 | 乔木林(0310)、灌木林(0320)、乔灌混合林(0330)、竹林(0340)、疏林(0350)、绿化林地(0360)、人工幼林(0370)、稀疏灌丛(0380)、果园(0210)、茶园(0220)、桑园(0230)、橡胶园(0240)、苗圃(0250)、花圃(0260)、其他园地(0290) |
| 草地生态系统 | 天然草地(0410)、人工草地(0420) |
| 城镇生态系统 | 多层及以上房屋建筑区(0510)、低矮房屋建筑区(0520)、废弃房屋建筑区(0530)、多层及以上独立房屋建筑(0540)、低矮独立房屋建筑(0550)、有轨道道路路面(0610)、无轨道道路路面(0601)、硬化地表(0710)、水工设施(0720)、城墙(0740)、温室大棚(0750)、固化池(0760)、工业设施(0770)、其他构筑物(0790)、露天采掘场(0810)、堆放物(0820)、建筑工地(0830)、其他人工堆掘地(0890) |
| 水域生态系统 | 水面(1001)、水渠(1012)、冰川与常年积雪(1050) |
| 荒漠生态系统 | 沙障(0780)、盐碱地表(0910)、泥土地表(0920)、沙质地表(0930)、砾石地表(0940)、岩石地表(0950) |
Table 2 The value of ecosystem services per unit area of different terrestrial ecosystem in China表2 中国不同类型陆地生态系统单位面积生态服务价值 |
| 生态系统类型 | 供给服务 | 调节服务 | 支持服务 | 文化服务 | 单位面积总价值 /(元/hm2) | |||||
|---|---|---|---|---|---|---|---|---|---|---|
| 食物生产 | 原材料 | 气体调节 | 气候调节 | 水分调节 | 废物循环 | 保持土壤 | 生物控制 | 文化娱乐 | ||
| 农田生态系统 | 884.9 | 88.5 | 442.4 | 787.5 | 530.9 | 1 451.2 | 1 291.9 | 628.2 | 8.8 | 6 114.3 |
| 森林生态系统 | 148.2 | 1 338.3 | 1 940.1 | 1 827.8 | 1 836.8 | 772.5 | 1 805.4 | 2 025.4 | 934.1 | 12 628.7 |
| 草地生态系统 | 193.1 | 161.7 | 673.7 | 700.6 | 682.6 | 592.8 | 1 006.0 | 839.8 | 390.7 | 5 241.0 |
| 城镇生态系统 | 0 | 0 | 0 | 0 | 0 | 0 | 0 | 0 | 0 | 0 |
| 水域生态系统 | 238.0 | 157.2 | 229.0 | 925.2 | 8 429.6 | 6 669.1 | 184.1 | 1 540.4 | 1 994.0 | 20 366.7 |
| 荒漠生态系统 | 9.0 | 18.0 | 27.0 | 58.4 | 31.4 | 116.8 | 76.4 | 179.6 | 107.8 | 624.3 |
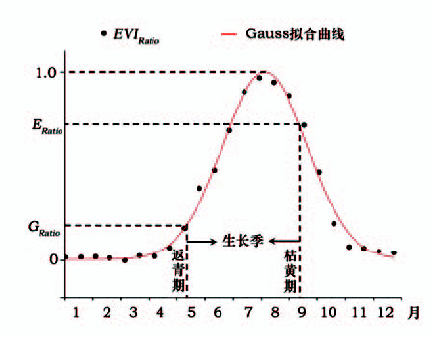
Figure 2 The threshold method图2 阈值法植被物候模型 |
Table 3 Land cover transition matrix in Qinghai Lake watershed between 2000 and 2012(hm2)表3 2000-2012年青海湖流域土地覆盖类型转移矩阵 |
| 2000年 | 2012年 | ||||||
|---|---|---|---|---|---|---|---|
| 农田 | 森林 | 草地 | 城镇 | 水域 | 荒漠 | 总面积 | |
| 农田 | 7 980.8 | 12 504.6 | 23 208.1 | 398.5 | 0 | 94.8 | 44 186.8 |
| 森林 | 8.3 | 33 394.2 | 100 267.7 | 56.4 | 0 | 1 706.1 | 135 432.7 |
| 草地 | 1 215.9 | 39 412.0 | 1 908 385.6 | 1 898.5 | 1 437.1 | 89 033.1 | 2 041 382.2 |
| 城镇 | 13.5 | 60.9 | 454.3 | 738.9 | 0 | 5.6 | 1 273.2 |
| 水域 | 2.2 | 5.0 | 497.8 | 9.6 | 472 211.8 | 1 058.4 | 473 784.8 |
| 荒漠 | 5.1 | 5 667.8 | 77 447.7 | 21.6 | 5 070.8 | 185 158.0 | 273 371.0 |
| 总面积 | 9 225.8 | 91 044.5 | 2 110 261.2 | 3 123.5 | 478 719.7 | 277 056.0 | 2 969 430.7 |
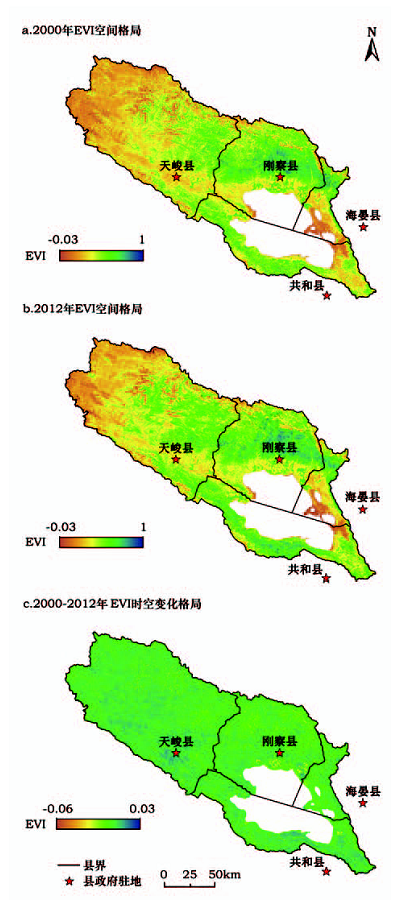
Figure 3 Spatial pattern variation of the maximum EVI in Qinghai Lake watershed during 2000 to 2012图3 2000-2012年青海湖流域年内最大EVI空间格局及其变化 |
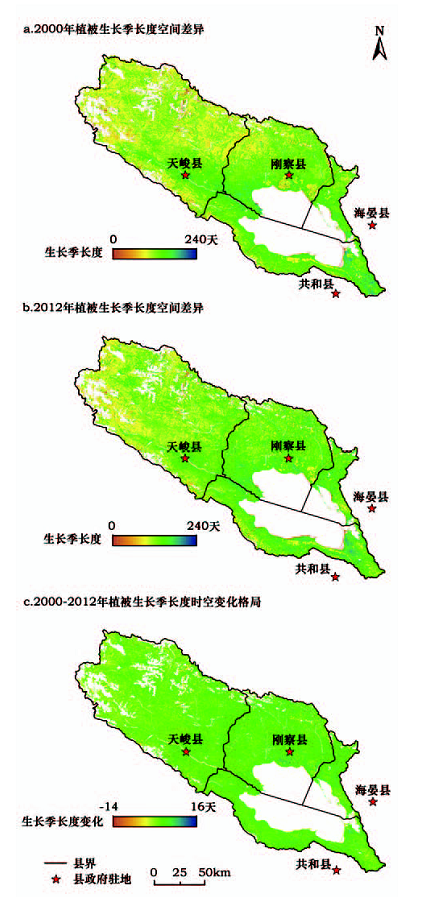
Figure 4 Spatial pattern variation of the growing season in Qinghai Lake watershed during 2000 to 2012图4 2000-2012年青海湖流域植被生长季长度空间差异及其变化 |
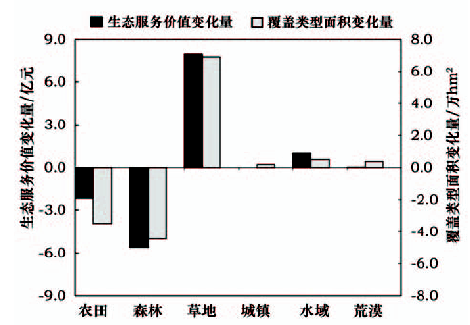
Table 4 Ecosystem service values of each land cover type in Qinghai Lake watershed (亿元)表4 青海湖流域不同覆盖类型的生态系统服务价值 |
| 农田 | 森林 | 草地 | 城镇 | 水域 | 荒漠 | 生态系统服务价值总量 | |
|---|---|---|---|---|---|---|---|
| 2000年 | 2.70 | 17.10 | 38.69 | 0 | 96.49 | 1.71 | 156.69 |
| 2012年 | 0.56 | 11.50 | 46.64 | 0 | 97.50 | 1.73 | 157.93 |
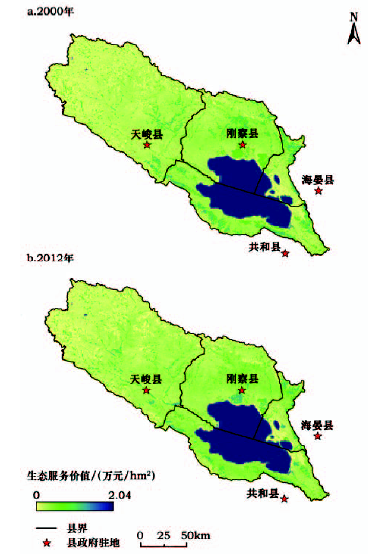
Figure 5 Spatial pattern of ecosystem service values in Qinghai Lake watershed图5 青海湖流域生态服务价值空间格局 |
Figure 6 Net change of different land cover area and ecosystem services value between 2000 and 2012图6 2000-2012年不同地表覆盖类型面积与生态服务价值净变化量 |
The authors have declared that no competing interests exist.
| [1] |
|
| [2] |
|
| [3] |
|
| [4] |
|
| [5] |
|
| [6] |
|
| [7] |
[
|
| [8] |
[
|
| [9] |
[
|
| [10] |
|
| [11] |
|
| [12] |
|
| [13] |
|
| [14] |
[
|
| [15] |
|
| [16] |
[
|
| [17] |
[
|
| [18] |
[
|
| [19] |
|
| [20] |
|
| [21] |
|
| [22] |
|
| [23] |
|
| [24] |
|
| [25] |
|
| [26] |
[
|
| [27] |
|
| [28] |
|
| [29] |
|
| [30] |
|
| [31] |
|
| [32] |
|
| [33] |
[
|
| [34] |
[
|
| [35] |
|
| [36] |
|
| [37] |
[
|
| [38] |
国务院第一次全国地理国情普查领导小组办公室. 地理国情普查内容与指标[M]. 北京:测绘出版社,2013.
[Office of the Leading Group of the State Council for the First Time in National Geographic National Conditions. National Geographical Condition Survey Content and Indicator[M]. Beijing:Surveying and Mapping Publishing House,2013.]
|
| [39] |
[
|
| [40] |
|
| [41] |
|
| [42] |
|
| [43] |
|
| [44] |
|
| [45] |
|
| [46] |
[
|
| [47] |
|
| [48] |
|
| [49] |
|
| [50] |
[
|
| [51] |
|
| [52] |
[
|
/
| 〈 |
|
〉 |