
入境游客与社区居民旅游供给感知测评及差异分析——以北京市为例
作者简介:刘军胜,男,河南开封人,博士生,主要研究方向为旅游市场开发与旅游流。E-mail:liujs526@163.com
收稿日期: 2015-12-14
要求修回日期: 2016-03-08
网络出版日期: 2016-08-25
基金资助
国家自然科学基金项目(41271158)
陕西师范大学研究生创新基金项目(2015CXB003)
国家旅游局万名旅游英才计划—研究型英才培养项目(WMYC20151061)
Evaluation and difference analysis on inbound tourists and local resident perception for tourism supply in Beijing
Received date: 2015-12-14
Request revised date: 2016-03-08
Online published: 2016-08-25
Copyright
不同群体对区域旅游的供给感知评价可为目的地协调发展提供参考。基于北京市入境游客与社区居民一手调查数据,建构两大群体旅游供给结构方程感知模型,从宏观与微观两方面分析两大群体对北京旅游供给感知程度及其差异,以识别旅游目的地发展过程中不同群体所注重的关键因素。结果表明:①通过对入境游客与社区居民样本数据的公因子萃取,提取出两大群体旅游供给感知公因子,包括人文环境、自然环境与安全、交通服务、服务质量与设施、旅游活动、信息服务与营销、旅游景区等方面,并以此建构并验证两大群体结构方程感知模型;②入境游客与社区居民旅游供给感知存在宏观差异,入境游客注重旅游目的地整体发展水平与软件环境建设,注重旅游过程中的情感性消费,而社区居民更注重目的地旅游资源、安全、市场营销等基础层次消费;③入境游客所提取出的一阶隐变量对旅游供给感知的路径系数较高,而社区居民所提取出的一阶隐变量对旅游供给感知的路径系数相对较低;④入境游客与社区居民的旅游供给感知受个人及群体认知能力、感知水平等一系列微观因素影响,受旅游目的地旅游供给结构、发展水平等宏观条件的制约,同时在二大群体所扮演的自然人与理性人角色的共同影响下导致对目的地旅游供给感知出现差异与错位。
刘军胜 , 马耀峰 . 入境游客与社区居民旅游供给感知测评及差异分析——以北京市为例[J]. 资源科学, 2016 , 38(8) : 1476 -1490 . DOI: 10.18402/resci.2016.08.07
Supply perception for different groups play an important role in tourism destination coordination development. Through surveys of inbound tourists and local residents we construct two groups perceived structural equation model of tourism supply,and from macro and micro perspective analysis the two groups tourism supply perception degree and differences. We found that after twice common factor extraction of the sample data,we extracted the common perception factors of tourism supply for the two groups,including the human environment,the natural environment and safety,transport services,quality of service and facilities,tourism,information services and marketing,tourist attractions, and then constructed a structural equation perceived assumptions model for the two groups. Inbound tourists and local residents have macroscopic differences about the perception of tourism supply,inbound tourists pay attention to the level of destination development and software environment (the external manifestations of emotion in the process of tourism consumption)but local residents pay more attention to the basic level consumption,including destination tourism resources,security and marketing conditions. The extracted first order hidden variable perception of inbound tourists for path coefficient of tourism supply is slightly higher,the local residents path coefficient for the perception of tourism supply is relatively low;and the 42 measurement terms of first-order latent variable path coefficient about inbound tourists is relatively low,but local residents path coefficient is relatively high. Tourism supply perception is influenced by individuals and groups of cognitive ability and perception level,and restricted by macro conditions such as tourist destination tourism supply structure and development level. The role of the group also leads to differences in the perception of destination supply.
Table 1 The specific measurement terms表1 具体测量条款 |
| 代码 | 条款 | 代码 | 条款 | 代码 | 条款 |
|---|---|---|---|---|---|
| E1 | 城市风光独特 | E17 | 多种不同等级的住宿服务设施 | E33 | 服务业发展水平较高 |
| E2 | 旅游景区价值较高 | E18 | 多种不同等级的休闲娱乐场所 | E34 | 居民的好客程度较高 |
| E3 | 旅游景区类型多样 | E19 | 多种不同等级的购物场所 | E35 | 旅游景区环境优美 |
| E4 | 为游客提供了解本地生活的机会 | E20 | 公共交通方式多样 | E36 | 互联网服务完善 |
| E5 | 民俗风情具有吸引力 | E21 | 市内交通方便快捷 | E37 | 移动通讯服务完善 |
| E6 | 旅游节事活动具有吸引力 | E22 | 景区内交通方便快捷 | E38 | 英文旅游信息获取方便 |
| E7 | 文化演艺活动丰富多样 | E23 | 本地与其他旅游城市间交通便捷 | E39 | 旅游标识、导览信息方便有效 |
| E8 | 国际会展丰富多样 | E24 | 交通设施完善 | E40 | 景区信息咨询服务完善 |
| E9 | 餐饮服务质量 | E25 | 城市空气质量良好 | E41 | 旅游形象鲜明 |
| E10 | 住宿服务质量 | E26 | 优质充足的城市用水 | E42 | 旅游促销有力 |
| E11 | 导游服务质量 | E27 | 城市公共环境卫生状况良好 | E43 | 免费旅游宣传资料充足 |
| E12 | 景区服务质量 | E28 | 城市绿化覆盖率高 | E44 | 社会治安情况良好 |
| E13 | 旅游购物服务质量 | E29 | 城市休闲氛围浓郁 | E45 | 旅游服务设施安全状况良好 |
| E14 | 旅游娱乐服务质量 | E30 | 现代化的城市商贸氛围浓郁 | E46 | 游客投诉能得到及时有效解决 |
| E15 | 整体旅游价格 | E31 | 历史文化气息浓郁 | E47 | 整体上本地很安全 |
| E16 | 多种不同等级的餐饮服务设施 | E32 | 整体经济发展水平较高 | - | |
Table 2 Inbound tourists perception of supply factor loadings表2 入境游客旅游供给感知因子载荷 |
| 公因子 | 条款 | 因子1 | 因子2 | 因子3 | 因子4 | 因子5 | 因子6 | 因子7 | 因子8 | CA系数 |
|---|---|---|---|---|---|---|---|---|---|---|
| 自然环境与安全因子 | E25 | 0.824 | 0.066 | -0.036 | -0.073 | 0.051 | -0.010 | 0.089 | 0.102 | 0.808 |
| E26 | 0.731 | 0.159 | 0.060 | 0.056 | 0.182 | 0.059 | 0.131 | 0.060 | ||
| E27 | 0.716 | 0.238 | 0.016 | 0.092 | 0.139 | 0.050 | 0.133 | 0.206 | ||
| E28 | 0.650 | 0.189 | -0.054 | 0.215 | 0.214 | 0.142 | 0.163 | 0.176 | ||
| E29 | 0.695 | 0.071 | -0.036 | 0.252 | 0.125 | 0.240 | 0.176 | 0.080 | ||
| E44 | 0.547 | 0.240 | 0.309 | 0.348 | -0.070 | -0.004 | -0.059 | 0.117 | ||
| E45 | 0.524 | 0.381 | 0.315 | 0.329 | 0.044 | 0.047 | -0.025 | 0.126 | ||
| E46 | 0.646 | 0.380 | 0.159 | 0.069 | -0.053 | 0.107 | 0.046 | 0.168 | ||
| 信息服务与景区营销因子 | E36 | 0.174 | 0.602 | -0.009 | 0.371 | 0.149 | -0.078 | 0.051 | 0.302 | 0.843 |
| E37 | 0.119 | 0.489 | 0.092 | 0.362 | 0.220 | -0.203 | 0.166 | 0.288 | ||
| E38 | 0.114 | 0.696 | 0.070 | 0.222 | 0.131 | 0.039 | 0.115 | 0.222 | ||
| E39 | 0.226 | 0.651 | 0.138 | 0.136 | 0.202 | 0.088 | 0.163 | 0.213 | ||
| E40 | 0.347 | 0.660 | 0.136 | 0.116 | 0.152 | 0.141 | 0.109 | 0.128 | ||
| E41 | 0.285 | 0.601 | 0.161 | 0.199 | 0.097 | 0.248 | 0.136 | 0.026 | ||
| E42 | 0.094 | 0.589 | 0.161 | 0.201 | 0.124 | 0.274 | -0.025 | -0.163 | ||
| E43 | 0.353 | 0.571 | 0.153 | 0.016 | 0.038 | 0.276 | 0.066 | -0.105 | ||
| 服务设施因子 | E16 | 0.164 | 0.122 | 0.795 | 0.048 | 0.080 | 0.074 | 0.067 | 0.150 | 0.757 |
| E17 | 0.075 | 0.106 | 0.842 | 0.074 | 0.097 | 0.092 | 0.103 | 0.100 | ||
| E18 | 0.015 | 0.144 | 0.720 | 0.128 | 0.170 | 0.147 | 0.129 | 0.173 | ||
| E19 | -0.060 | 0.178 | 0.628 | 0.258 | 0.311 | 0.084 | 0.057 | 0.147 | ||
| 人文环境因子 | E30 | 0.144 | 0.107 | 0.187 | 0.652 | 0.187 | 0.224 | 0.139 | 0.130 | 0.772 |
| E31 | 0.224 | 0.264 | 0.088 | 0.558 | 0.075 | 0.097 | 0.331 | 0.076 | ||
| E32 | 0.019 | 0.235 | 0.107 | 0.767 | 0.141 | 0.124 | 0.144 | 0.070 | ||
| E33 | 0.277 | 0.331 | 0.102 | 0.555 | 0.118 | 0.070 | 0.049 | 0.168 | ||
| E47 | 0.438 | 0.220 | 0.309 | 0.440 | 0.054 | -0.044 | 0.003 | 0.153 | ||
| 交通服务因子 | E20 | -0.112 | 0.133 | 0.350 | 0.233 | 0.667 | 0.111 | 0.037 | 0.047 | 0.866 |
| E21 | 0.224 | 0.059 | 0.023 | 0.147 | 0.814 | 0.064 | 0.048 | 0.076 | ||
| E22 | 0.384 | 0.244 | 0.052 | -0.011 | 0.680 | -0.008 | 0.103 | 0.199 | ||
| E23 | 0.107 | 0.272 | 0.333 | 0.166 | 0.633 | 0.130 | 0.041 | 0.065 | ||
| E24 | 0.147 | 0.443 | 0.197 | 0.023 | 0.469 | 0.093 | 0.164 | 0.041 | ||
| 旅游活动因子 | E4 | 0.220 | -0.018 | 0.087 | 0.090 | 0.111 | 0.489 | 0.374 | -0.059 | 0.804 |
| E5 | 0.216 | -0.006 | 0.073 | 0.072 | -0.070 | 0.505 | 0.439 | 0.061 | ||
| E6 | 0.194 | 0.180 | 0.017 | 0.113 | 0.041 | 0.712 | 0.175 | 0.211 | ||
| E7 | 0.007 | 0.235 | 0.177 | 0.040 | 0.108 | 0.735 | 0.037 | 0.128 | ||
| E8 | -0.176 | 0.229 | 0.211 | 0.274 | 0.239 | 0.474 | -0.009 | 0.230 | ||
| 旅游景区因子 | E1 | 0.162 | 0.105 | -0.047 | 0.142 | 0.010 | 0.134 | 0.768 | 0.176 | 0.812 |
| E2 | 0.037 | 0.184 | 0.187 | 0.137 | 0.044 | -0.006 | 0.755 | 0.056 | ||
| E3 | 0.153 | 0.107 | 0.146 | 0.064 | 0.205 | 0.263 | 0.682 | -0.003 | ||
| 服务质量因子 | E9 | 0.246 | 0.052 | 0.235 | 0.249 | 0.004 | 0.199 | 0.055 | 0.625 | 0.686 |
| E10 | 0.130 | 0.000 | 0.278 | 0.226 | 0.112 | 0.099 | 0.138 | 0.675 | ||
| E11 | 0.260 | 0.258 | 0.117 | 0.061 | 0.143 | 0.095 | 0.009 | 0.653 | ||
| E12 | 0.395 | 0.265 | 0.154 | -0.048 | 0.149 | 0.167 | 0.155 | 0.529 |
注:①公因子提取方法为主成份分析法;②采取具有 Kaiser 标准化的正交旋转法,A.旋转在9次迭代后收敛;③表中下划线数据为各公因子所属条款因子载荷值。 |
Table 3 Local residents perceive tourism supply factor loadings表3 社区居民旅游供给感知因子载荷 |
| 公因子 | 条款 | 因子1 | 因子2 | 因子3 | 因子4 | 因子5 | 因子6 | 因子7 | 因子8 | 因子9 | CA系数 |
|---|---|---|---|---|---|---|---|---|---|---|---|
| 景区营销因子 | E38 | 0.664 | 0.135 | -0.060 | -0.038 | 0.208 | 0.107 | 0.161 | -0.051 | 0.312 | 0.854 |
| E39 | 0.777 | 0.152 | 0.046 | 0.082 | 0.077 | 0.088 | 0.075 | 0.095 | 0.152 | ||
| E40 | 0.749 | 0.183 | 0.117 | 0.096 | 0.130 | 0.084 | 0.142 | 0.173 | 0.058 | ||
| E41 | 0.652 | 0.075 | 0.198 | 0.254 | 0.006 | 0.095 | 0.167 | 0.265 | 0.095 | ||
| E42 | 0.628 | 0.058 | 0.257 | 0.297 | -0.031 | 0.070 | 0.079 | 0.286 | 0.104 | ||
| E43 | 0.611 | 0.061 | 0.223 | 0.179 | 0.075 | 0.066 | -0.018 | 0.335 | -0.015 | ||
| 交通服务因子 | E20 | 0.052 | 0.771 | 0.059 | 0.145 | -0.037 | 0.147 | 0.106 | 0.114 | 0.017 | 0.825 |
| E21 | 0.065 | 0.824 | 0.146 | 0.138 | 0.058 | 0.058 | 0.066 | 0.139 | 0.066 | ||
| E22 | 0.087 | 0.802 | 0.176 | 0.158 | 0.098 | 0.089 | 0.122 | 0.116 | 0.006 | ||
| E23 | 0.168 | 0.680 | 0.193 | 0.156 | 0.148 | 0.104 | 0.112 | 0.132 | 0.076 | ||
| E24 | 0.206 | 0.616 | 0.053 | 0.032 | 0.201 | 0.101 | 0.187 | 0.087 | 0.009 | ||
| 旅游活动因子 | E4 | 0.113 | 0.098 | 0.473 | 0.027 | -0.031 | 0.140 | 0.343 | 0.118 | 0.074 | 0.732 |
| E5 | 0.042 | 0.123 | 0.626 | 0.003 | 0.045 | 0.112 | 0.282 | 0.251 | 0.114 | ||
| E6 | 0.072 | 0.145 | 0.814 | 0.078 | 0.078 | 0.074 | 0.124 | 0.050 | 0.042 | ||
| E7 | 0.129 | 0.195 | 0.749 | 0.138 | 0.031 | 0.117 | 0.182 | 0.016 | -0.047 | ||
| E8 | 0.264 | 0.048 | 0.636 | 0.162 | -0.001 | 0.171 | 0.136 | -0.039 | -0.040 | ||
| 人文环境因子 | E29 | 0.083 | 0.114 | 0.093 | 0.669 | 0.342 | 0.151 | 0.113 | 0.087 | -0.013 | 0.800 |
| E30 | 0.116 | 0.099 | 0.062 | 0.703 | 0.219 | 0.158 | 0.169 | 0.129 | 0.065 | ||
| E31 | 0.111 | 0.213 | 0.031 | 0.511 | -0.004 | 0.114 | 0.373 | 0.137 | -0.086 | ||
| E32 | 0.163 | 0.204 | 0.111 | 0.609 | 0.000 | 0.065 | 0.182 | 0.191 | 0.135 | ||
| E33 | 0.302 | 0.149 | 0.191 | 0.542 | 0.101 | 0.148 | 0.107 | 0.162 | 0.185 | ||
| 自然环境因子 | E25 | 0.077 | 0.074 | 0.047 | 0.069 | 0.803 | 0.042 | -0.047 | 0.022 | 0.059 | 0.861 |
| E26 | 0.058 | 0.098 | -0.015 | 0.063 | 0.808 | 0.054 | -0.031 | 0.110 | 0.202 | ||
| E27 | 0.147 | 0.086 | 0.003 | 0.132 | 0.792 | 0.108 | 0.053 | 0.123 | 0.110 | ||
| E28 | 0.077 | 0.094 | 0.069 | 0.498 | 0.577 | 0.056 | -0.052 | 0.062 | -0.012 | ||
| 服务质量与设施因子 | E9 | 0.067 | 0.139 | 0.203 | 0.078 | 0.283 | 0.532 | 0.174 | 0.146 | 0.093 | 0.833 |
| E10 | 0.097 | -0.016 | 0.008 | -0.049 | 0.245 | 0.690 | 0.260 | 0.147 | 0.046 | ||
| E11 | 0.397 | -0.081 | 0.159 | 0.053 | 0.075 | 0.443 | 0.294 | -0.082 | -0.100 | ||
| E16 | 0.096 | 0.188 | 0.116 | 0.258 | -0.017 | 0.604 | 0.044 | 0.088 | 0.115 | ||
| E17 | 0.035 | 0.210 | 0.179 | 0.218 | -0.004 | 0.699 | 0.063 | 0.151 | 0.118 | ||
| E18 | 0.208 | 0.243 | 0.371 | 0.393 | -0.084 | 0.404 | 0.018 | -0.038 | -0.060 | ||
| E19 | 0.238 | 0.310 | 0.248 | 0.332 | -0.161 | 0.416 | -0.050 | -0.030 | -0.043 | ||
| 旅游景区因子 | E1 | 0.171 | 0.159 | 0.221 | 0.199 | -0.049 | 0.105 | 0.635 | 0.101 | 0.050 | 0.723 |
| E2 | 0.102 | 0.135 | 0.263 | 0.194 | -0.011 | 0.114 | 0.745 | 0.081 | 0.000 | ||
| E3 | 0.086 | 0.168 | 0.282 | 0.113 | -0.029 | 0.129 | 0.703 | 0.112 | 0.035 | ||
| E12 | 0.322 | 0.138 | 0.218 | 0.116 | 0.067 | 0.293 | 0.427 | -0.030 | -0.032 | ||
| 旅游安全因子 | E44 | 0.256 | 0.149 | 0.135 | 0.132 | 0.102 | 0.079 | -0.020 | 0.744 | 0.016 | 0.845 |
| E45 | 0.283 | 0.210 | 0.028 | 0.153 | 0.128 | 0.204 | 0.178 | 0.704 | 0.022 | ||
| E46 | 0.340 | 0.150 | 0.223 | 0.175 | 0.136 | 0.075 | 0.044 | 0.451 | 0.059 | ||
| E47 | 0.075 | 0.260 | -0.050 | 0.206 | 0.107 | 0.119 | 0.332 | 0.598 | 0.124 | ||
| 信息服务因子 | E36 | 0.178 | 0.023 | 0.047 | 0.045 | 0.209 | 0.096 | 0.004 | 0.065 | 0.837 | 0.827 |
| E37 | 0.205 | 0.076 | 0.025 | 0.103 | 0.137 | 0.088 | 0.033 | 0.054 | 0.845 |
注:①公因子提取方法为主成份分析法;②采取具有 Kaiser 标准化的正交旋转法,A.旋转在8次迭代后收敛;③表中下划线数据为各公因子所属条款因子载荷值。 |
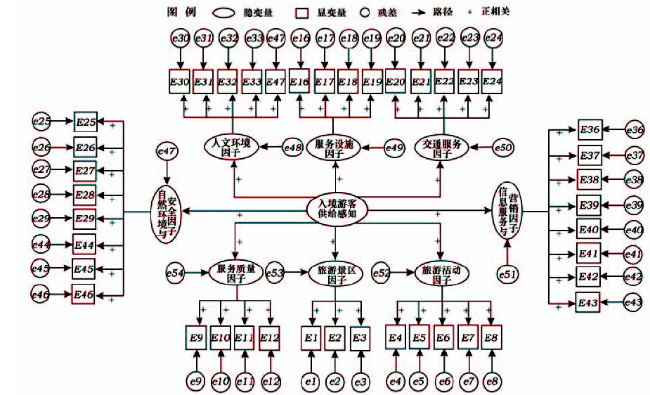
Figure1 Supply perceive hypothetical model of inbound tourists图1 入境游客供给感知假设模型 |
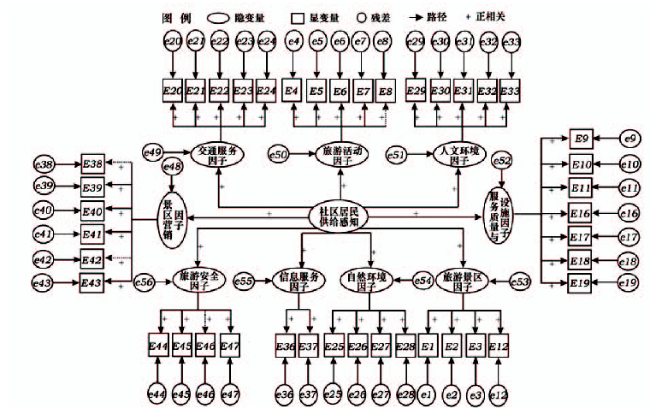
Figure2 Supply perceive hypothetical model of local residents图2 社区居民供给感知假设模型 注:“…→”表示入境游客与社区居民区别程度较大的条款。 |
Table 4 The suitability assess of inbound tourists and local residents structural equation modeling表4 入境游客与社区居民结构方程模型适用性评估 |
| 入境游客结构方程适用性评估 | 社区居民结构方程适用性评估 | ||||||||||
|---|---|---|---|---|---|---|---|---|---|---|---|
| 公因子 | 条款 | 偏度 | 峰度 | CR | AVE | 公因子 | 条款 | 偏度 | 峰度 | CR | AVE |
| 服务质量因子 | E12 | -0.697 | 0.528 | 0.886 4 | 0.507 3 | 旅游安全因子 | E44 | -0.702 | 0.462 | 0.823 2 | 0.539 1 |
| E11 | -0.903 | 0.827 | E45 | -0.592 | 0.428 | ||||||
| E10 | -0.774 | 0.487 | E46 | -0.358 | -0.039 | ||||||
| E9 | -0.432 | -0.094 | E47 | -0.894 | 1.065 | ||||||
| 旅游景区因子 | E3 | -0.894 | 1.032 | 0.748 3 | 0.498 8 | 信息服务因子 | E36 | -0.507 | -0.178 | 0.664 8 | 0.497 9 |
| E2 | -1.085 | 2.004 | E37 | -0.644 | 0.293 | ||||||
| E1 | -0.896 | 1.261 | 自然环境因子 | E25 | 0.365 | -0.847 | 0.797 8 | 0.498 5 | |||
| 旅游活动因子 | E8 | -0.470 | 0.266 | 0.831 7 | 0.500 0 | E26 | -0.079 | -0.577 | |||
| E7 | -0.863 | 1.036 | E27 | -0.385 | -0.272 | ||||||
| E6 | -0.654 | 0.453 | E28 | -0.322 | 0.031 | ||||||
| E5 | -0.859 | 0.849 | 旅游景区因子 | E1 | -0.663 | 0.217 | 0.799 3 | 0.500 3 | |||
| E4 | -0.620 | 0.111 | E2 | -0.843 | 0.780 | ||||||
| 服务设施因子 | E19 | -0.632 | 0.613 | 0.799 9 | 0.500 9 | E3 | -0.494 | 0.267 | |||
| E18 | -0.405 | 0.037 | E12 | -0.252 | -0.038 | ||||||
| E17 | -0.946 | 1.892 | 服务质量与设施因子 | E19 | -0.574 | 0.389 | 0.897 7 | 0.569 9 | |||
| E16 | -0.518 | 0.434 | E18 | -0.232 | -0.346 | ||||||
| 交通服务因子 | E24 | -0.511 | 0.103 | 0.830 5 | 0.499 3 | E17 | -0.429 | 0.710 | |||
| E23 | -0.836 | 0.975 | E16 | -0.513 | 0.623 | ||||||
| E22 | -0.732 | 0.663 | E11 | -0.415 | 0.516 | ||||||
| E21 | -0.806 | 0.631 | E10 | -0.520 | 0.623 | ||||||
| E20 | -0.989 | 1.089 | E9 | -0.593 | 0.366 | ||||||
| 人文环境因子 | E47 | -0.942 | 1.252 | 0.838 5 | 0.511 6 | 旅游活动因子 | E8 | -0.488 | -0.119 | 0.840 2 | 0.526 9 |
| E33 | -0.446 | 0.516 | E7 | -0.304 | -0.268 | ||||||
| E32 | -0.336 | 0.091 | E6 | -0.128 | -0.138 | ||||||
| E31 | -1.117 | 1.849 | E5 | -0.492 | 0.196 | ||||||
| E30 | -0.628 | 0.574 | E4 | -0.242 | -0.037 | ||||||
| 信息服务与景区 营销因子 | E43 | -0.509 | 0.240 | 0.881 0 | 0.499 8 | 人文环境因子 | E33 | -0.461 | 0.321 | 0.844 7 | 0.522 0 |
| E42 | -0.415 | 0.163 | E32 | -0.752 | 0.547 | ||||||
| E41 | -0.464 | 0.459 | E31 | -0.936 | 0.938 | ||||||
| E40 | -0.630 | 0.787 | E30 | -0.434 | 0.145 | ||||||
| E39 | -0.570 | 0.404 | E29 | -0.209 | -0.285 | ||||||
| E38 | -0.435 | -0.158 | 交通服务因子 | E24 | -0.852 | 0.590 | 0.838 0 | 0.522 3 | |||
| E37 | -0.477 | -0.318 | E23 | -0.715 | 0.447 | ||||||
| E36 | -0.365 | -0.569 | E22 | -0.566 | 0.238 | ||||||
| 自然环境与安全因子 | E25 | 0.244 | -0.810 | 0.882 1 | 0.500 7 | E21 | -0.815 | 0.249 | |||
| E26 | 0.119 | -0.900 | E20 | -0.707 | -0.212 | ||||||
| E27 | -0.018 | -0.750 | 景区营销因子 | E38 | -0.382 | 0.316 | 0.856 0 | 0.500 9 | |||
| E28 | -0.338 | 0.073 | E39 | -0.297 | -0.123 | ||||||
| E29 | -0.581 | 0.759 | E40 | -0.205 | -0.244 | ||||||
| E44 | -0.614 | 0.674 | E41 | -0.306 | -0.114 | ||||||
| E45 | -0.568 | 0.529 | E42 | -0.243 | 0.205 | ||||||
| E46 | -0.440 | 0.432 | E43 | -0.263 | 0.007 | ||||||
Table 5 Structural equation model fitting effect表5 结构方程模型拟合效果 |
| 绝对拟合指数 | 相对拟合指数 | 简约指数 | |||||||||||
|---|---|---|---|---|---|---|---|---|---|---|---|---|---|
| 指数 | CMIN/DF | RMSEA | GFI | AGFI | PGFI | NFI | RFI | IFI | TLI | CFI | PRATIO | PNFI | PCFI |
| 标准 | 1.0~3.0 | 0.08 | 0.90 | 0.90 | >0.50 | 0.90 | >0.90 | >0.90 | >0.90 | >0.90 | >0.50 | >0.50 | >0.50 |
| 游客 | 1.658 | 0.031 | 0.923 | 0.906 | 0.753 | 0.916 | 0.901 | 0.965 | 0.958 | 0.964 | 0.855 | 0.783 | 0.824 |
| 居民 | 1.479 | 0.029 | 0.931 | 0.900 | 0.638 | 0.931 | 0.904 | 0.977 | 0.967 | 0.976 | 0.719 | 0.669 | 0.702 |
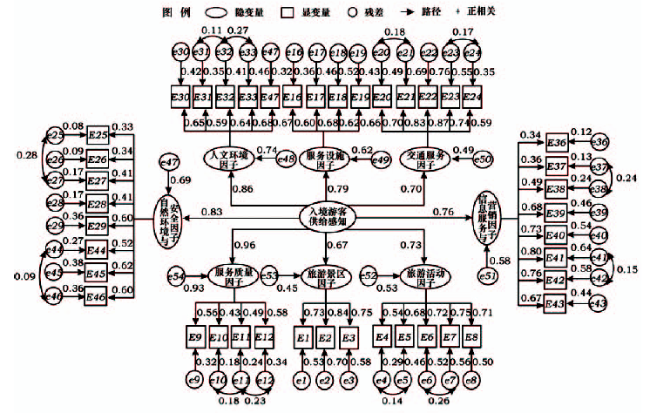
Figure3 Supply perceptual structure model of inbound tourists图3 入境游客供给感知结构模型 注:“…→”表示入境游客与社区居民区别程度较大的条款。 |
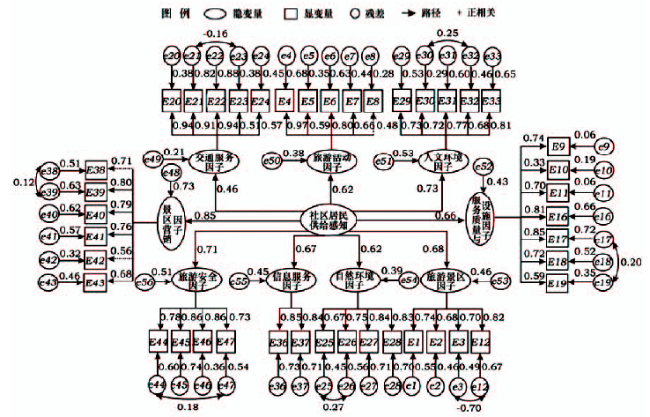
Figure4 Supply perceptual structure model of local residents图4 社区居民供给感知结构模型 注:“…→”表示入境游客与社区居民区别程度较大的条款。 |
The authors have declared that no competing interests exist.
| [1] |
国家旅游局. 中国旅游统计年鉴[M]. 北京:中国旅游出版社,2015.
[National Tourism Administration. The Yearbook of China Tourism Statistics[M]. Beijing:China Tourism Press,2015.]
|
| [2] |
[
|
| [3] |
[
|
| [4] |
[
|
| [5] |
[
|
| [6] |
[
|
| [7] |
[
|
| [8] |
[
|
| [9] |
[
|
| [10] |
|
| [11] |
|
| [12] |
[
|
| [13] |
[
|
| [14] |
|
| [15] |
|
| [16] |
[
|
| [17] |
|
| [18] |
[
|
| [19] |
[
|
| [20] |
|
| [21] |
|
| [22] |
|
| [23] |
|
| [24] |
[
|
| [25] |
[
|
| [26] |
|
| [27] |
|
| [28] |
[
|
| [29] |
[
|
| [30] |
[
|
| [31] |
[
|
| [32] |
北京市统计局. 北京统计年鉴[M]. 北京:中国统计出版社,2015.
[Beijing Statistics Bureau.The Yearbook of Beijing Statistics[M]. Beijing:China Statistics Press,2015.]
|
| [33] |
[
|
| [34] |
[
|
/
| 〈 |
|
〉 |