
基于资源价值显化视角的中国工业用地市场发育水平及其影响因素
作者简介:赵爱栋,男,山西汾阳人,博士生,主要研究方向为土地利用与区域经济。E-mail:2012109004@njau.edu.cn
收稿日期: 2015-03-23
要求修回日期: 2015-05-21
网络出版日期: 2016-02-01
基金资助
教育部哲学社会科学研究重大课题攻关项目(13JZD014)中国土地规划勘测院项目(20130517)2015年江苏省国土资源科技重大项目
Marketization level of industrial land in China and its impacting factors from the perspective of resource value manifesting
Received date: 2015-03-23
Request revised date: 2015-05-21
Online published: 2016-02-01
Copyright
优化土地资源配置要求加快工业用地市场化改革,而准确评估工业用地市场发育水平对于客观评价工业用地市场化改革绩效并具有重要意义。本文利用2007-2013年中国328个地级及以上城市工业用地出让数据,从工业用地出让价格溢价率和出让方式市场化两个维度揭示中国工业用地市场发育水平的时空特征,并分析了影响地区间市场发育水平差异的因素。研究结果表明:中国工业用地市场发育水平由2007年的7.66上升至2013年的32.16,但是工业用地出让价格仍未合理体现资源稀缺性和市场供求所揭示的工业用地价值,市场化改革还停留在转变工业用地出让方式阶段,尚未深入到建立反映资源稀缺程度的工业用地市场化价格形成机制层面;东、中、西部工业用地市场化进程均在深化,东部地区市场发育具有水平高,推进速度快的双重特征,而中西部地区工业用地市场化改革仍处在由被动配合中央政策规定向主动引领改革过渡阶段;地区经济发展水平、产业结构和工业用地需求强度与工业用地市场发育水平呈现显著正向关系,地区土地资源禀赋则有显著负效应,而地区间激烈地“土地引资”竞争显著抑制了中国工业用地市场化进程。因此建议:在工业用地市场化改革过程中,要把完善土地出让制度和建立良好地土地市场生态作为改革重要方向,把促进工业用地价格向合理资源价值回归,优化土地资源配置作为改革落脚点。
赵爱栋 , 马贤磊 , 曲福田 , 许实 . 基于资源价值显化视角的中国工业用地市场发育水平及其影响因素[J]. 资源科学, 2016 , 38(2) : 217 -227 . DOI: 10.18402/resci.2016.02.04
To optimize the allocation of land resources, China should speed up the industrial land market reform, and measure the industrial land marketization level is significance for the evaluation of the performance of industrial land market reform. Based on industrial land leasing data for 238 prefecture-level cities in China from 2007 to 2013,we investigated temporal-spatial evolution patterns of industrial land marketization in China from the dimensions of industrial land leasing premium rate and leasing mode marketization to analyze factors impacting regional differences. The results show that China's the industrial land marketization level rose from 7.66 in 2007 to 32.16 in 2013;industrial land leasing price in China has not yet reflected the value of industrial land revealed by resource scarcity and market conditions. Land market reform remains at a stage of simply changing leasing mode and not deeping into the core that establishes industrial land pricing mechanisms,reflecting the extent of resource scarcity. Industrial land marketization is continuously deepening in eastern,central and western China. The eastern marketization level is not only the highest level but also the fastest;central and western industrial land market reform remains in a transition from passive compliance with central government regulations to initiatives that direct industrial land market reform endogenously. Meanwhile,the level of economic development,industrial structure and industrial land demand intensity showed significant positive relationships with industrial land marketization. Land resource endowments had a significant negative effect,while regional fierce competition for business inhibits the industrial land market reform process in China. It is suggested that perfecting the land grant system and establishing market ecology should be an important position in the process of industrial land market reform,promoting industrial land prices to a reasonable value and optimizing the allocation of resources.
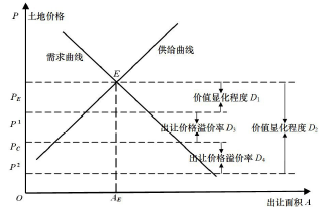
Figure 1 Interpretation of industrial land value surfacing level图1 工业用地价值显化程度阐释 |
Table1 Marketization level contribution rate of industrial land in China from 2007 to 2013表1 2007-2013年中国工业用地市场发育水平及变化贡献率分解 |
年份 | 工业用地市场发育水平 | 2007-2013年发育水平变化贡献率分解/% | |||||||
|---|---|---|---|---|---|---|---|---|---|
| 2007 | 2008 | 2009 | 2010 | 2011 | 2012 | 2013 | 出让方式市场化 | 出让价格溢价率 | |
| 东部 | 6.40 | 27.09 | 30.63 | 34.05 | 36.78 | 34.39 | 38.12 | 63.72 | 36.28 |
| 中部 | 8.09 | 23.57 | 30.23 | 30.84 | 33.48 | 31.72 | 29.73 | 71.46 | 28.54 |
| 西部 | 9.90 | 17.86 | 20.88 | 28.80 | 25.15 | 19.98 | 25.44 | 88.03 | 11.97 |
| 全国 | 7.66 | 24.03 | 28.33 | 32.20 | 32.42 | 28.73 | 32.16 | 72.41 | 27.59 |
注:工业用地市场发育水平变化贡献率分解=发育水平构成指标变化率/发育水平变化率100。 |
Table 2 Information of industrial land grant in China from 2007 to 2013 (元/m2,%) |
| 年份 | 划拨 | 协议出让 | 招、拍、挂出让 | 租赁 | 总体 价格 | ||||
|---|---|---|---|---|---|---|---|---|---|
| 价格 | 比重 | 价格 | 比重 | 价格 | 比重 | 价格 | 比重 | ||
| 2007 | 4.54 | 3.76 | 128.14 | 65.38 | 130.21 | 30.70 | 4.00 | 0.16 | 123 |
| 2008 | 2.75 | 4.07 | 123.97 | 19.10 | 175.85 | 76.74 | 8.54 | 0.08 | 143 |
| 2009 | 9.37 | 2.05 | 148.46 | 12.56 | 219.59 | 85.35 | 73.86 | 0.04 | 192 |
| 2010 | 7.20 | 1.54 | 131.21 | 9.01 | 247.85 | 89.41 | 95.56 | 0.04 | 197 |
| 2011 | 8.87 | 4.67 | 167.43 | 6.09 | 230.95 | 89.18 | 78.27 | 0.05 | 192 |
| 2012 | 7.92 | 5.73 | 160.84 | 6.85 | 228.84 | 87.40 | 41.33 | 0.01 | 189 |
| 2013 | 4.57 | 1.45 | 178.63 | 5.12 | 246.06 | 93.41 | 37.47 | 0.02 | 211 |
| 2007-2013 | 6.81 | 3.32 | 137.22 | 17.73 | 207.65 | 78.89 | 36.17 | 0.06 | 179 |
注:1)2007-2013年,中国工业用地出让方式除表格中所列之外,还有作价出资或入股、授权经营方式,但是出让土地面积和宗数极少,故未列出;2)总体价格=年度工业用地出让总价款/出让总面积。 |
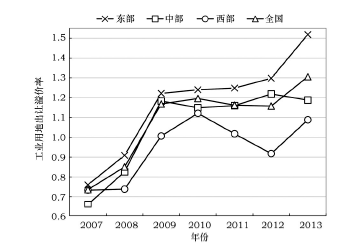
Figure2 Weighted premium rate of industrial land grant price in China from 2007 to 2013图2 2007-2013年中国工业用地出让价格加权溢价率 |
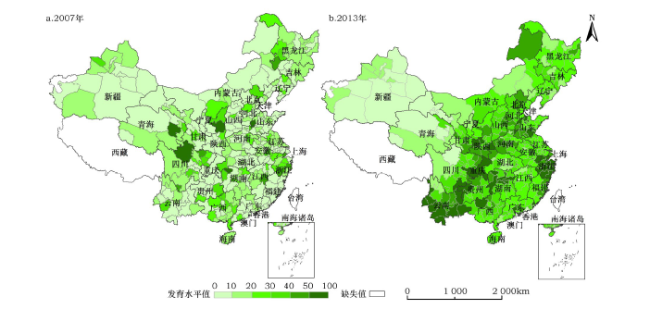
Figure 3 Regional difference of marketization level of industrial land in China in 2007,2013图3 2007年、2013年中国工业用地市场发育水平区域差异 |
Table 3 The descriptive statistics of the indices表3 相关变量描述性统计 |
| 变量名称 | 最大值 | 最小值 | 均值 | 标准差 | 预期影响方向 |
|---|---|---|---|---|---|
| 人均GDP/(元/人) | 182 680.000 0 | 3 398.000 0 | 30 686.000 0 | 23 389.610 0 | + |
| 非农就业比重/% | 99.990 0 | 21.210 0 | 60.730 0 | 0.178 0 | + |
| 产业结构/% | 76.460 0 | 8.580 0 | 36.640 0 | 8.730 0 | + |
| 固定资产投资增长率/% | 389.460 0 | -93.150 0 | 28.490 0 | 0.300 0 | - |
| 人均耕地面积/(hm2/人) | 0.480 0 | 0.000 3 | 0.140 0 | 0.013 3 | - |
Table 4 Test of panel model表4 面板模型检验结果 |
| 新设工业企业数/个 | 3 761.000 0 | 0.000 0 | 120.000 0 | 1 824.180 0 | + |
| 多重共线性 检验 | 自相关检验 H0:不存在一阶自相关 | 异方差检验 H0:不存在异方差 | 豪斯曼检验 H0:系数的差异是非系统的 | ||
|---|---|---|---|---|---|
| 检验方法 | VIF | Modified Wald test | Wooldridge test | Hausman test | |
| 统计量 | VIFmax=1.48 | Chi2(322)=570 000 Prob>Chi2=0.00 | F(1,321)=13.099 Prob>F=0.00 | Chi2(5)=-130 Prob>Chi2=0.00 | |
| 结论 | 不存在多重共性 | 存在自相关 | 存在异方差 | 固定效应模型优于随机效应模型 |
Table 5 Estimation results of impacting factors of industrial land marketization level表5 工业用地市场发育水平影响因素模型估计结果 |
| 解释变量 | 被解释变量:工业用地市场发育水平 | |
|---|---|---|
| 模型1 XTGLS | 模型2 XTGLS | |
| 人均GDP(对数) | 1.942*** (3.43) | 1.966*** (3.48) |
| 非农就业比重 | -9.737***(-4.26) | -9.846***(-4.31) |
| 产业结构(对数) | 0.886 (0.66) | -1.397 (-0.76) |
| 滞后一期产业结构(对数) | 2.953*** (3.20) | 1.114 (1.14) |
| 固定资产投资增长率 | -0.097***(-2.63) | -4.083***(-2.65) |
| 滞后一期固定资产投资增长率 | 3.683***(10.32) | 3.709***(10.35) |
| 人均耕地面积 | 2.758*** (2.16) | 2.679*** (2.48) |
| 新设工业企业数(对数) | 2.321*** (3.14) | 2.629*** (3.00) |
| 虚拟变量-东部 | 3.293** (1.92) | |
| -2.720***(-2.89) | ||
| 常数项_cons | -16.807***(-2.22) | -20.166***(-2.62) |
| Wald统计值 | 229.17 | 233.45 |
| 方差膨胀系数最大值 | 1.61 | 4.57 |
| 统计量 (P值)a | 59.67 (0.00) | |
| 统计量 (P值)b | 48.33 (0.00) | |
| 截面数/样本总量 | 22/1 932 | |
注:1)*、**、***分别表示在10%、5%和1%的水平下显著,括号内为Z值统计量;2)因变量为工业用地市场发育水平值;3)a代表原假设为“产业结构、固定资产投资增长率当期与滞后一期系数同时等于零”的联合显著检验;b代表原假设为“产业结构、固定资产投资增长率当期系数与滞后一期系数之和为零”的联合显著检验。 |
The authors have declared that no competing interests exist.
| [1] |
[
|
| [2] |
[
|
| [3] |
[
|
| [4] |
[
|
| [5] |
[
|
| [6] |
[
|
| [7] |
[
|
| [8] |
|
| [9] |
[
|
| [10] |
[
|
| [11] |
|
| [12] |
[
|
| [13] |
[
|
| [14] |
[
|
| [15] |
[
|
| [16] |
阿尔弗雷德·马歇尔(
[
|
| [17] |
|
| [18] |
格里高利·曼昆(
[
|
| [19] |
[
|
| [20] |
中国国土资源部. 关于发布实施《全国工业用地出让最低价标准》的通知[EB/OL].(2006-12-27)[2015-03-24]. http://www.mlr.gov.cn/zwgk/zytz/200612/t20061227_648789.htm.
[
|
| [21] |
[
|
| [22] |
中国土地市场网[EB/OL]. (2007-01-01)[2015-03-24].http://www.landchina.com/default.aspx?tabid=263&ComName=default. [China Land Market[EB/OL].(2007-01-01)[2015-03-24]. http:// www. Land china.com/default.aspx?tabid=263 &ComName
=default.]
|
| [23] |
[
|
| [24] |
[
|
| [25] |
[
|
| [26] |
|
| [27] |
[
|
| [28] |
[
|
| [29] |
[
|
| [30] |
[
|
| [31] |
|
| [32] |
[
|
| [33] |
[
|
| [34] |
[
|
| [35] |
中国知网中国经济与社会发展统计数据库[EB/OL].
[China Statistical Yearbooks Database[EB/OL].
|
| [36] |
|
| [37] |
[
|
| [38] |
[
|
| [39] |
[
|
/
| 〈 |
|
〉 |