×
模态框(Modal)标题
在这里添加一些文本
Close
Close
Submit
Cancel
Confirm
×
模态框(Modal)标题
×
Journal
Article
Figure
Search
EN
中文
Home
About Journal
Overview
Indexing & Honors
Open Access
Editorial Board
Guide for Authors
Browse
Current Issue
Online First
Archive
Highlights
Topic
Archive by Subject
Most Viewed
Most Download
Most Cited
E-mail Alert
RSS
Subscribe
Advertisement
Contact us
EN
中文
Figure/Table detail
Impacts of China’s graphite export structure adjustments on its industrial international competitiveness: A multi-layer network perspective
LI Bingyan, JIANG Meihui
Resources Science
, 2025, 47(
7
): 1598-1609. DOI:
10.18402/resci.2025.07.16
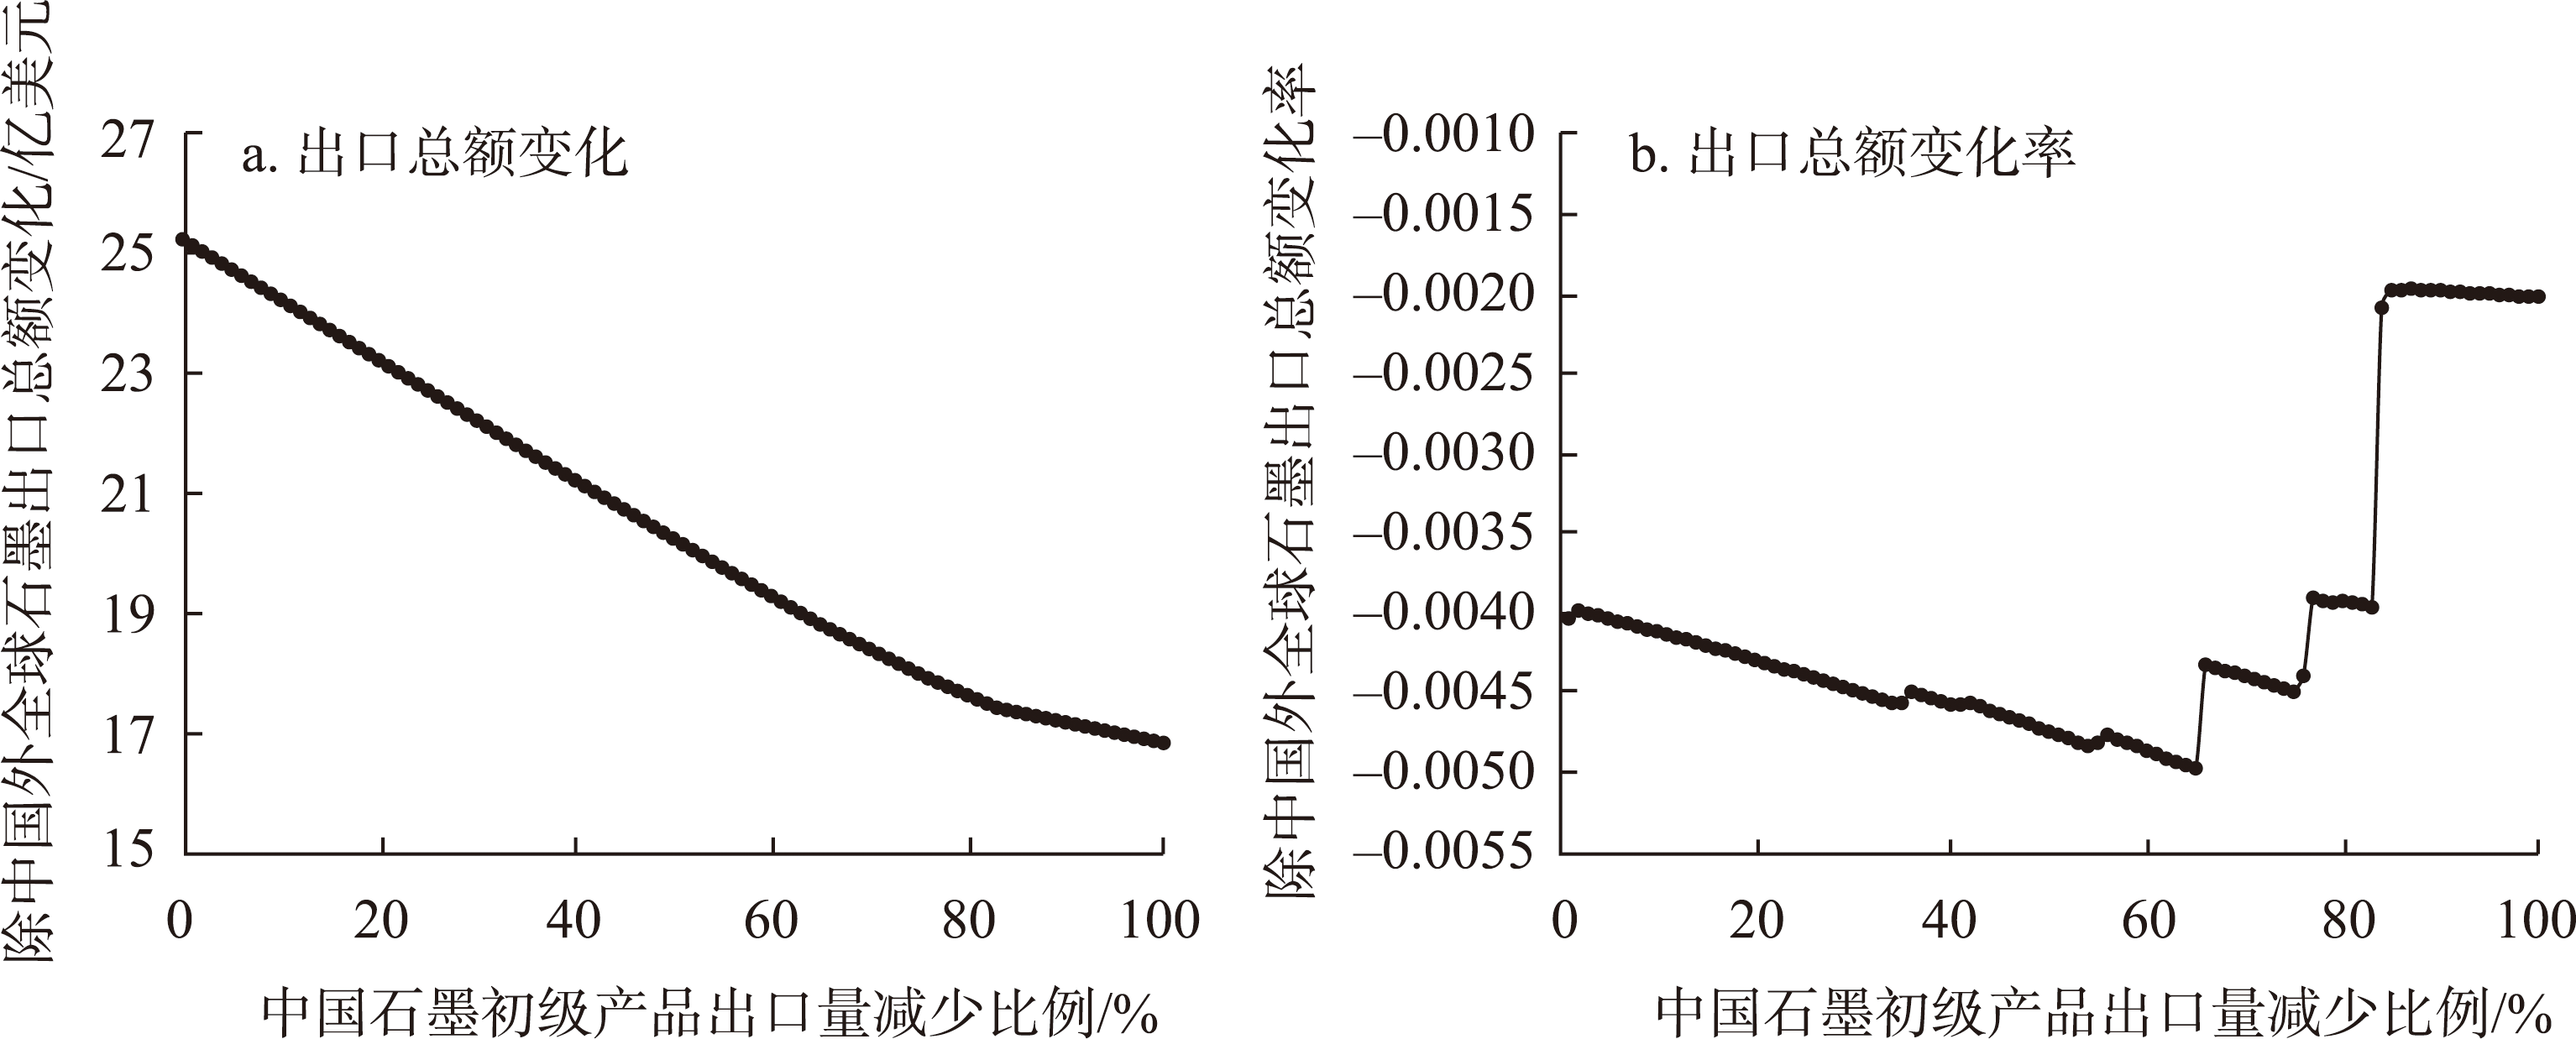
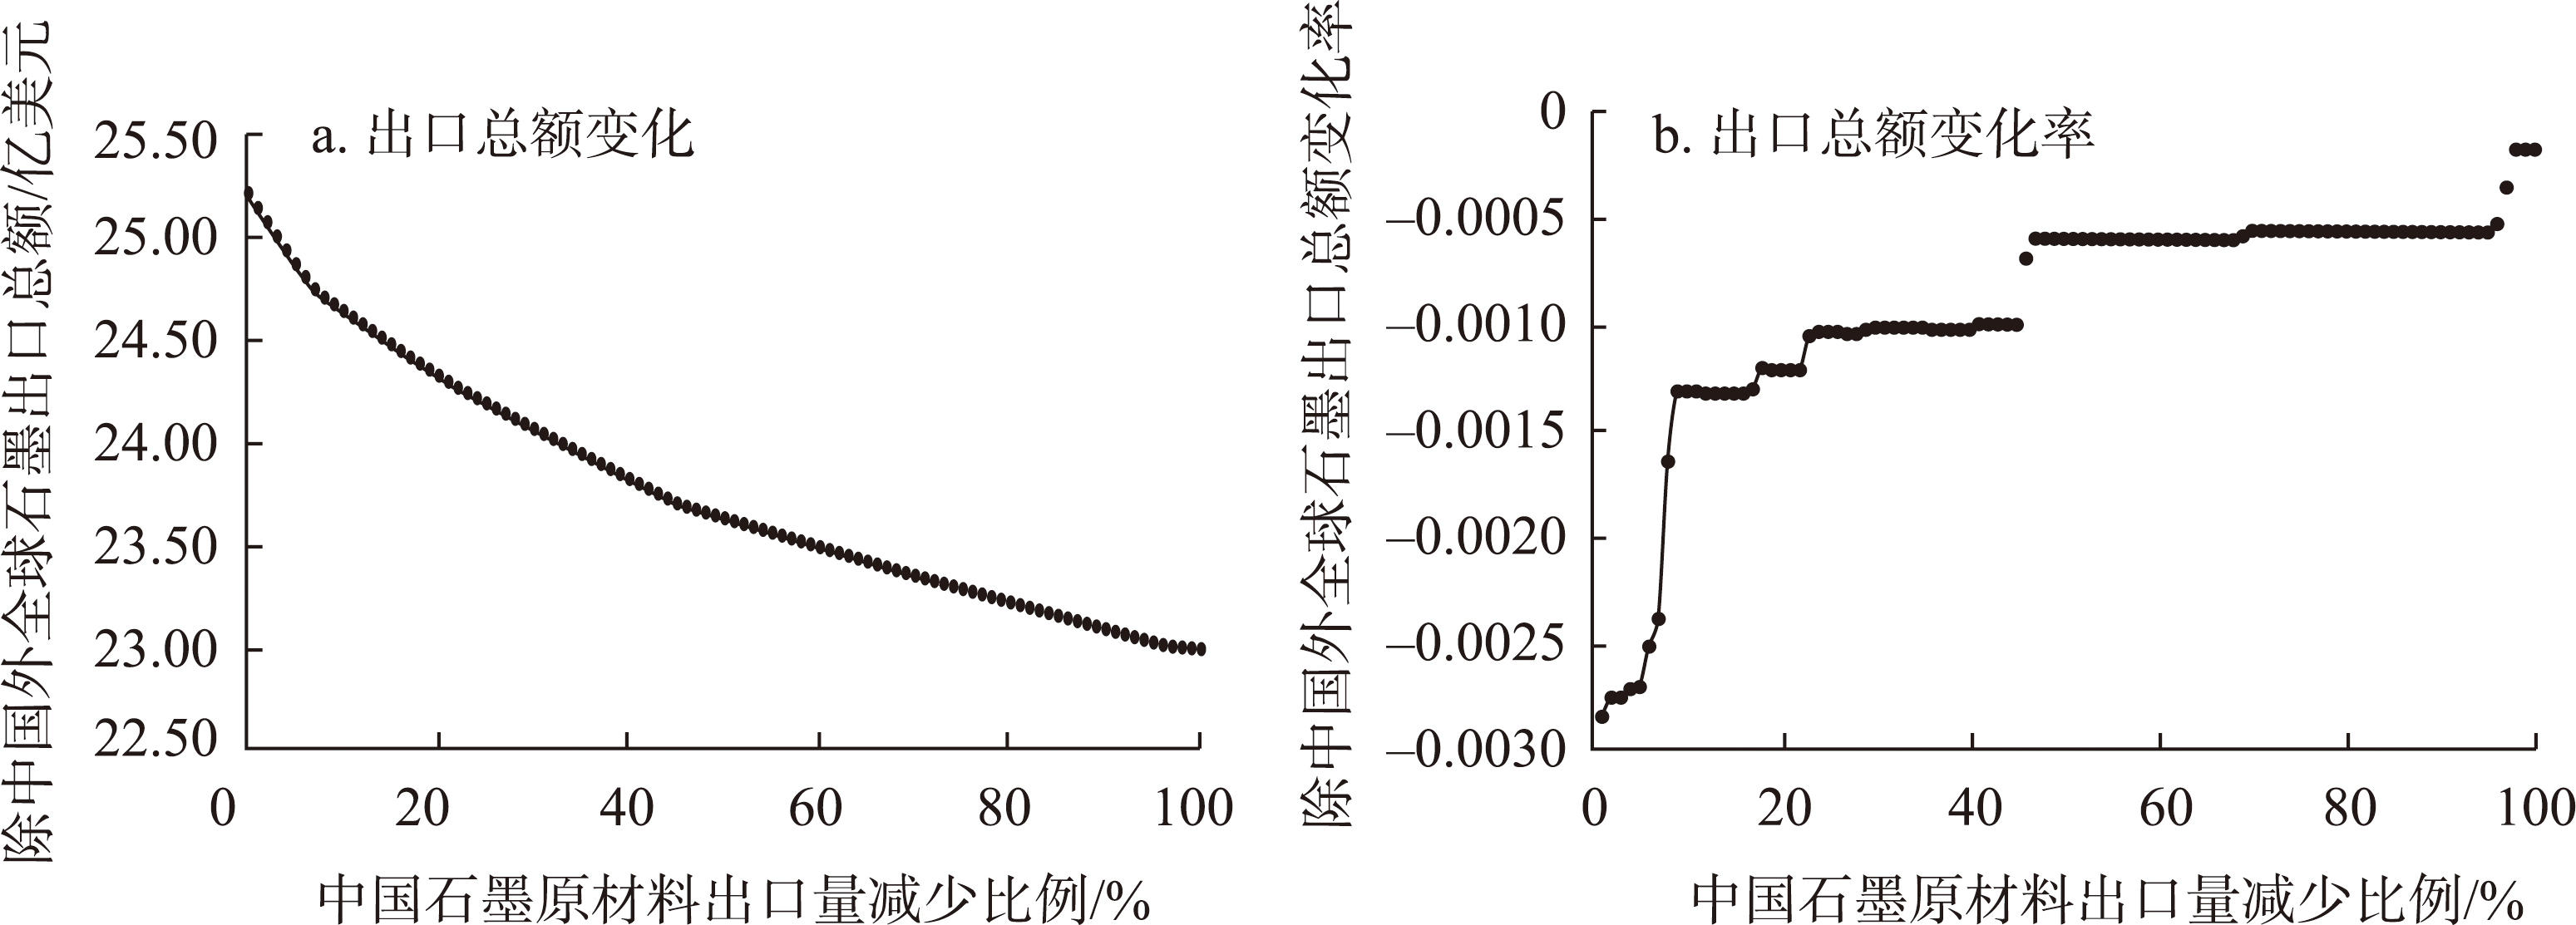
Figure 5
Changes and change rates of total export value of global graphite products
Other figure/table from this article
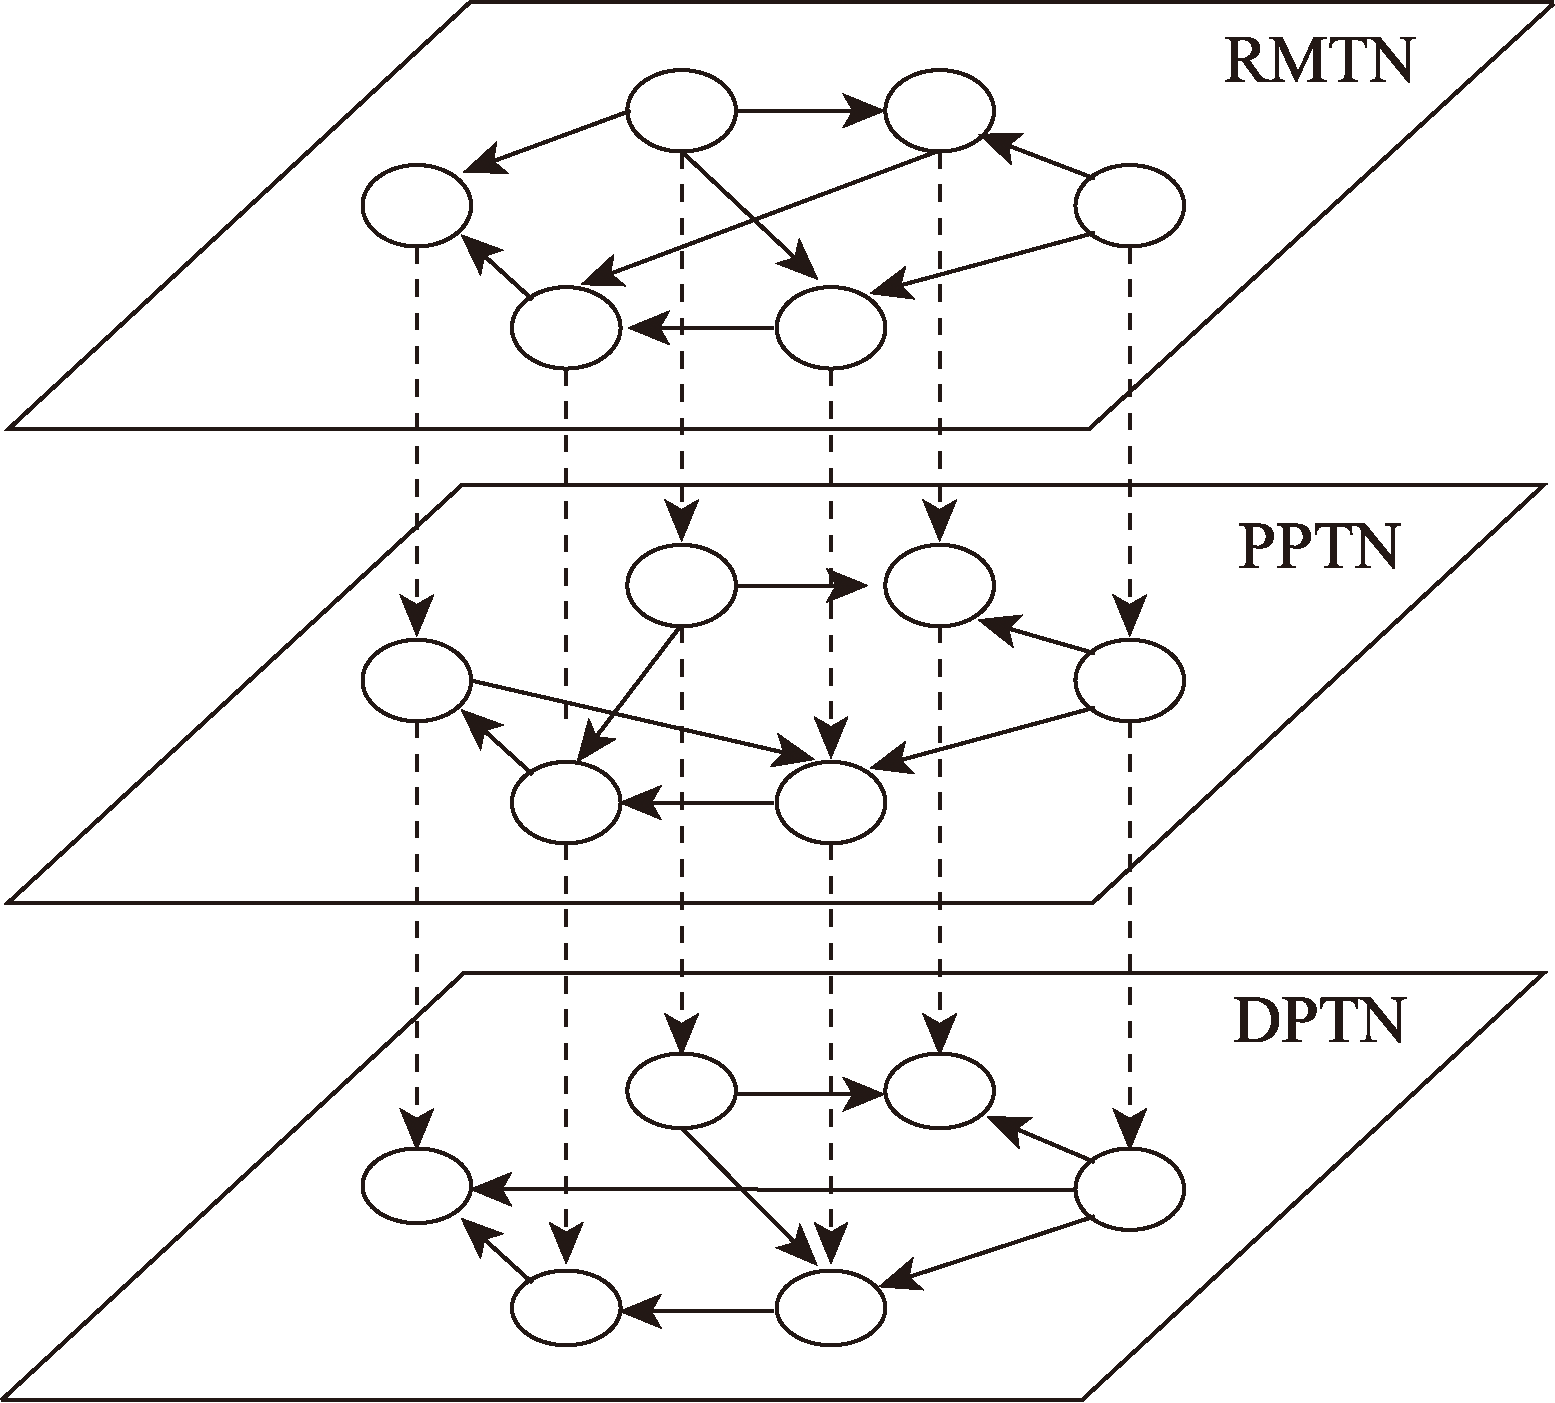
Figure 1
Schematic diagram of multi-layer graphite product trade network model
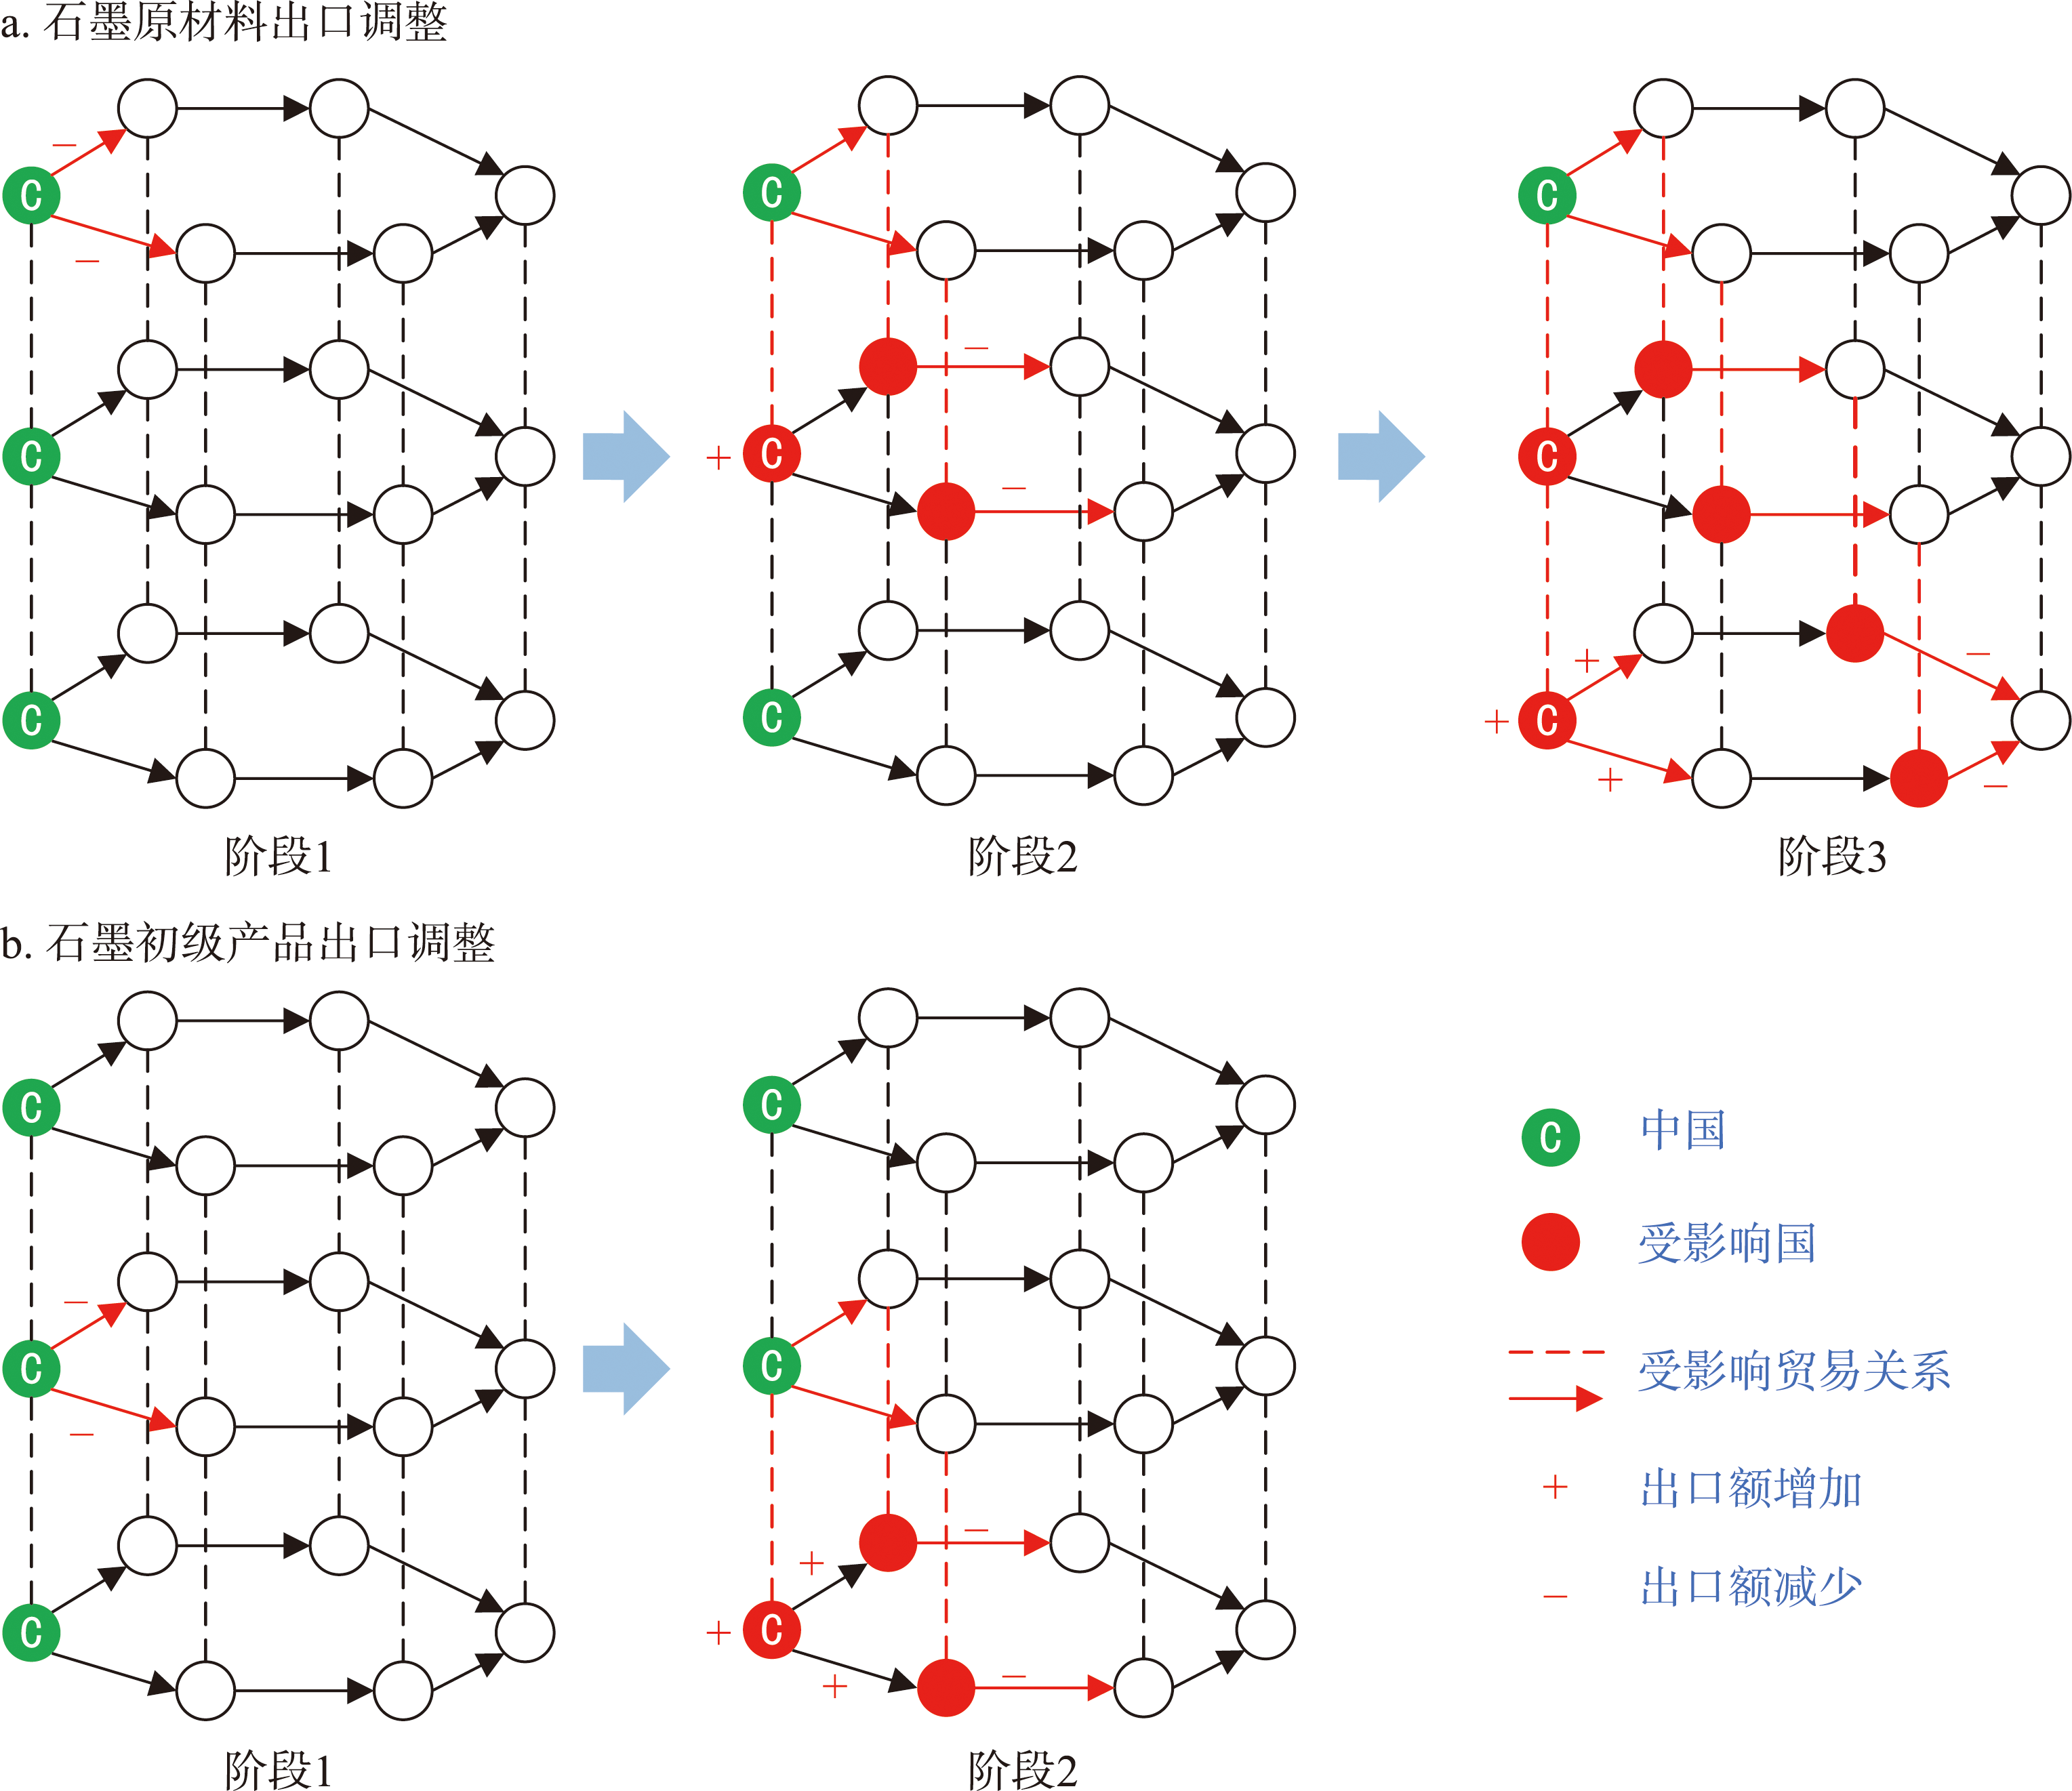
Figure 2
Schematic diagram of cascading propagation process in graphite product trade
Table 1
Graphite products and their classification
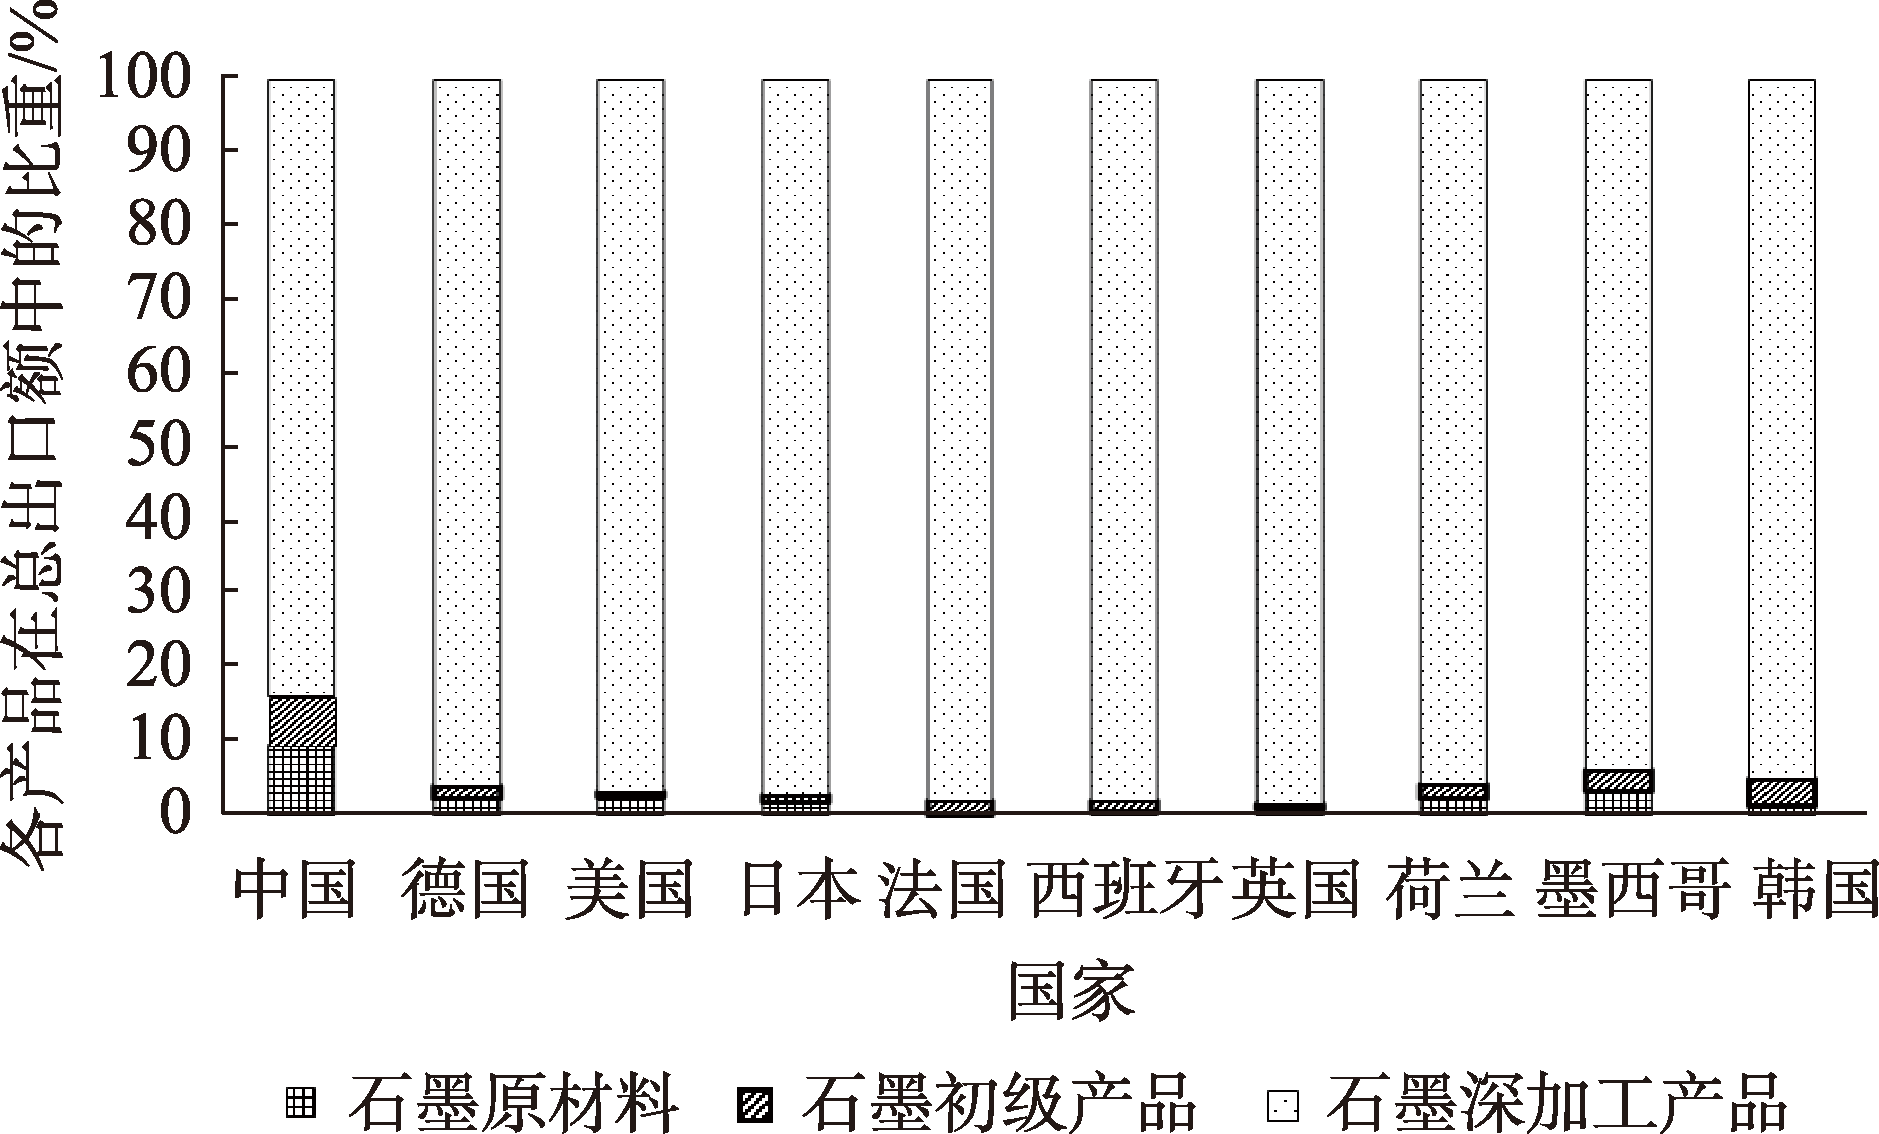
Figure 3
Export structure of major graphite exporters (top 10 by export value)
Table 2
Market share of graphite products in major countries in 2021 (top 10)
Table 3
RCA
index of graphite products in major countries in 2021 (top 10)
Figure 4
Changes and change rates of total export value of global graphite products
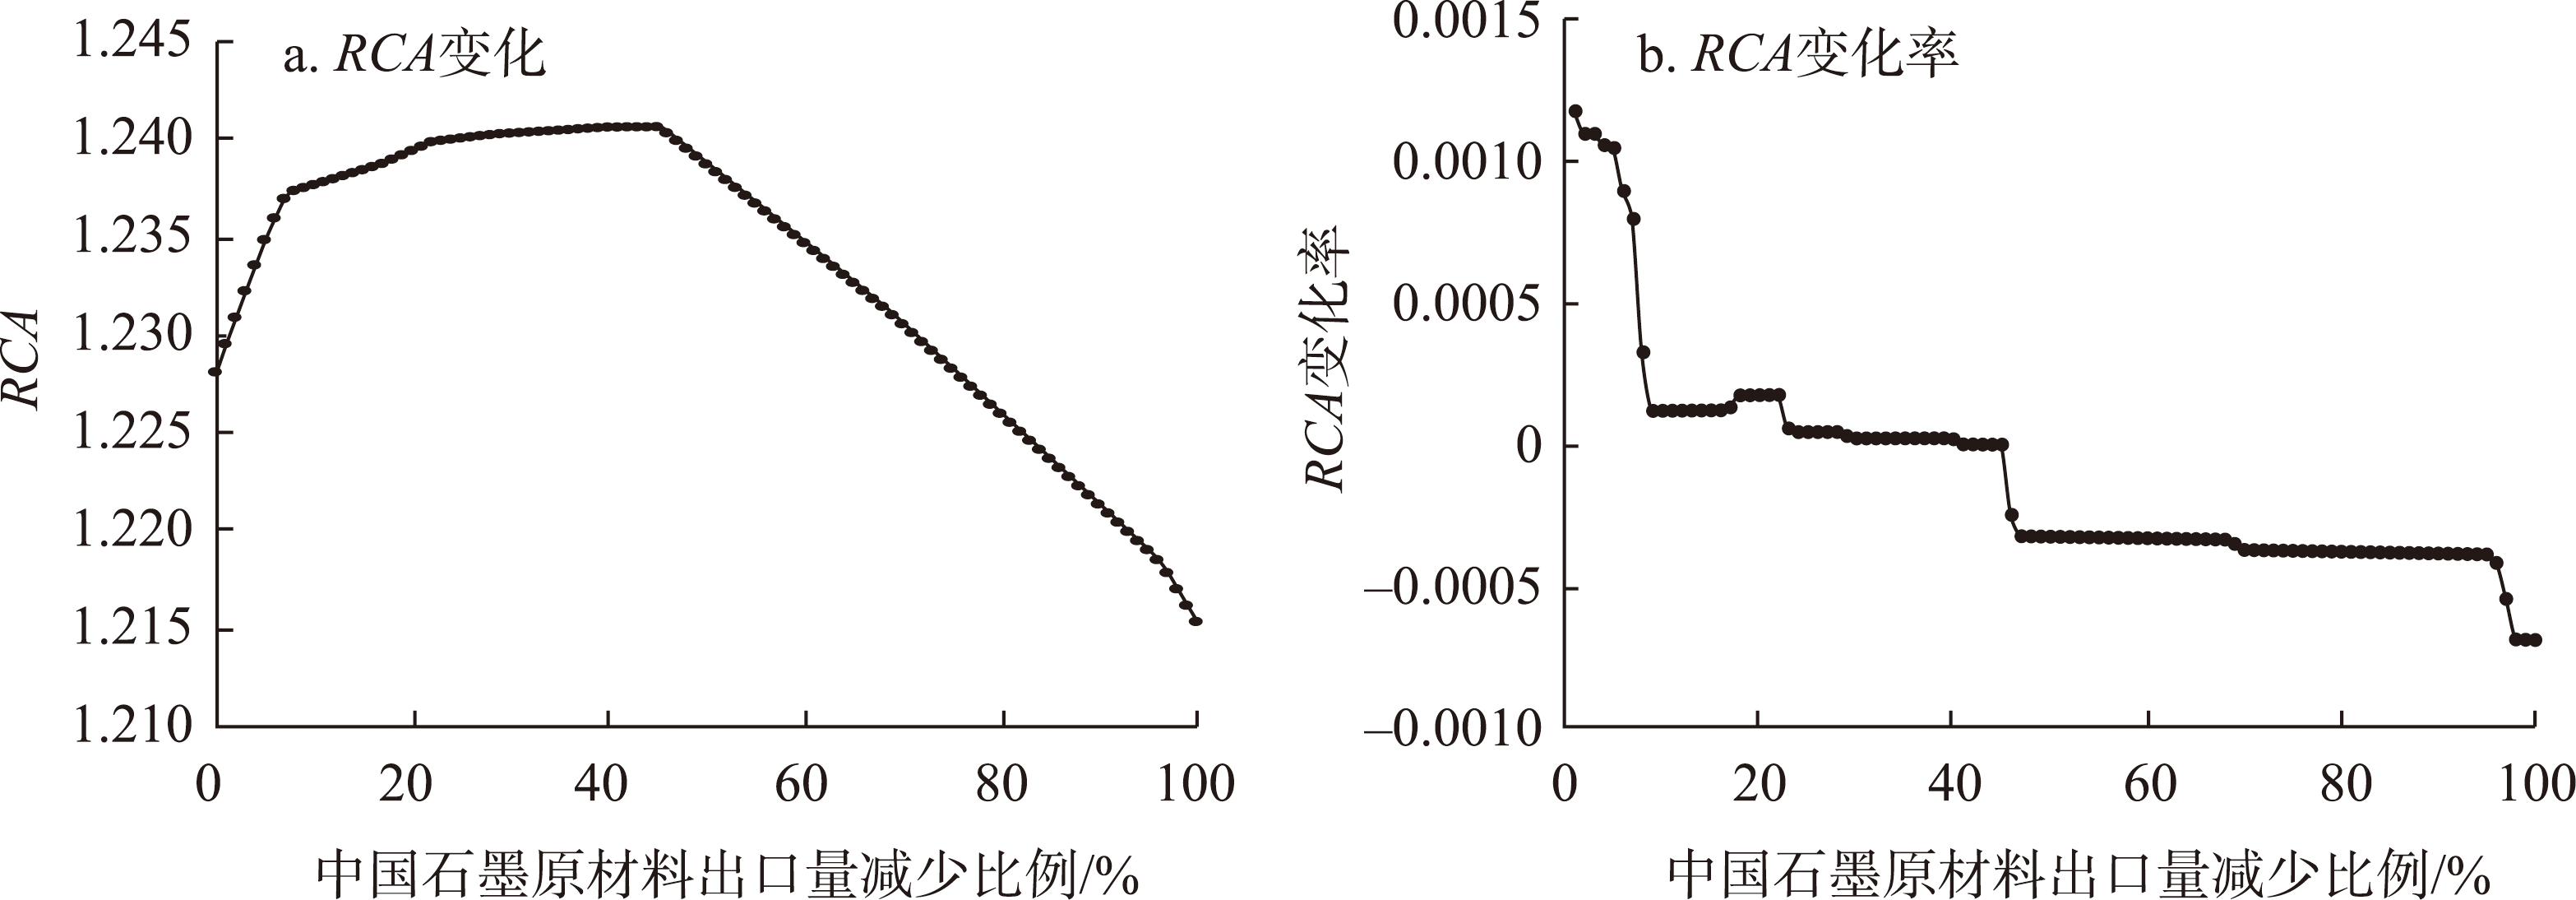
Figure 6
Changes and change rates of RCA of China’s graphite products with reduction in graphite raw material exports
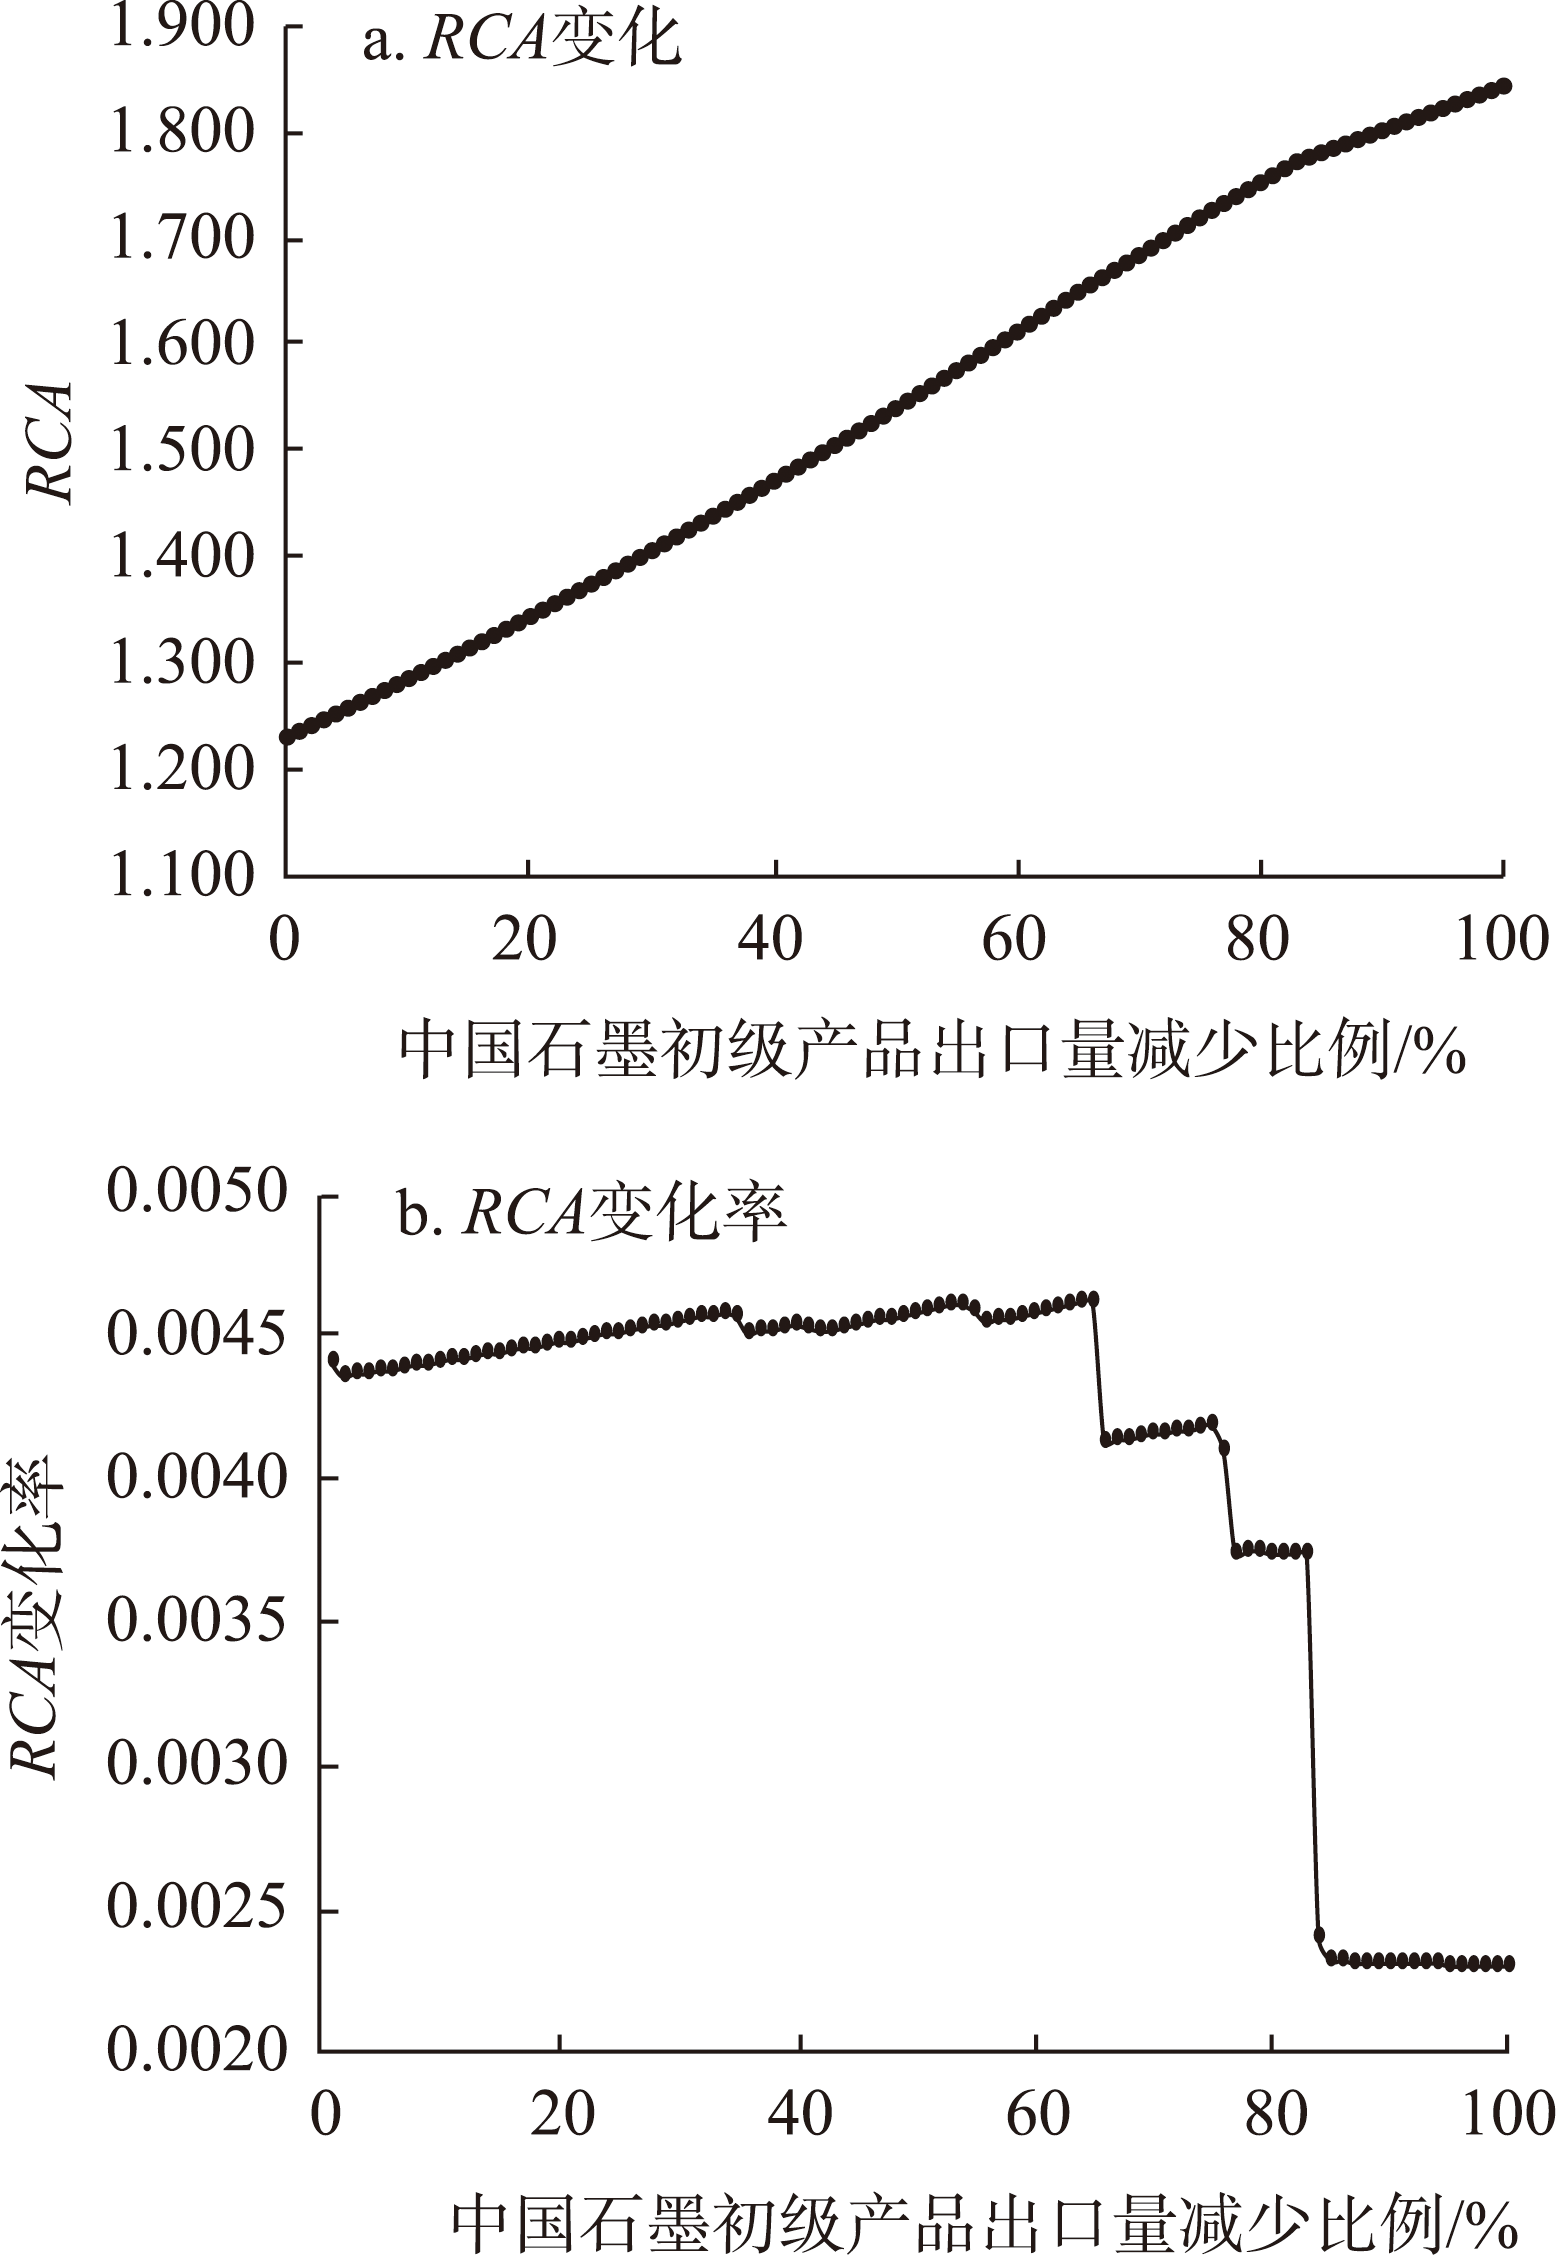
Figure 7
Changes and change rates of
RCA
of China’s graphite products with reduction in graphite primary product exports