×
模态框(Modal)标题
在这里添加一些文本
Close
Close
Submit
Cancel
Confirm
×
模态框(Modal)标题
×
Journal
Article
Figure
Search
EN
中文
Home
About Journal
Overview
Indexing & Honors
Open Access
Editorial Board
Guide for Authors
Browse
Current Issue
Online First
Archive
Highlights
Topic
Archive by Subject
Most Viewed
Most Download
Most Cited
E-mail Alert
RSS
Subscribe
Advertisement
Contact us
EN
中文
Figure/Table detail
Value analysis of the entire industrial chain of indium resources in China
GENG Biao, CHEN Jian, LI Zehong, JIANG Shuguang
Resources Science
, 2024, 46(
3
): 647-656. DOI:
10.18402/resci.2024.03.16
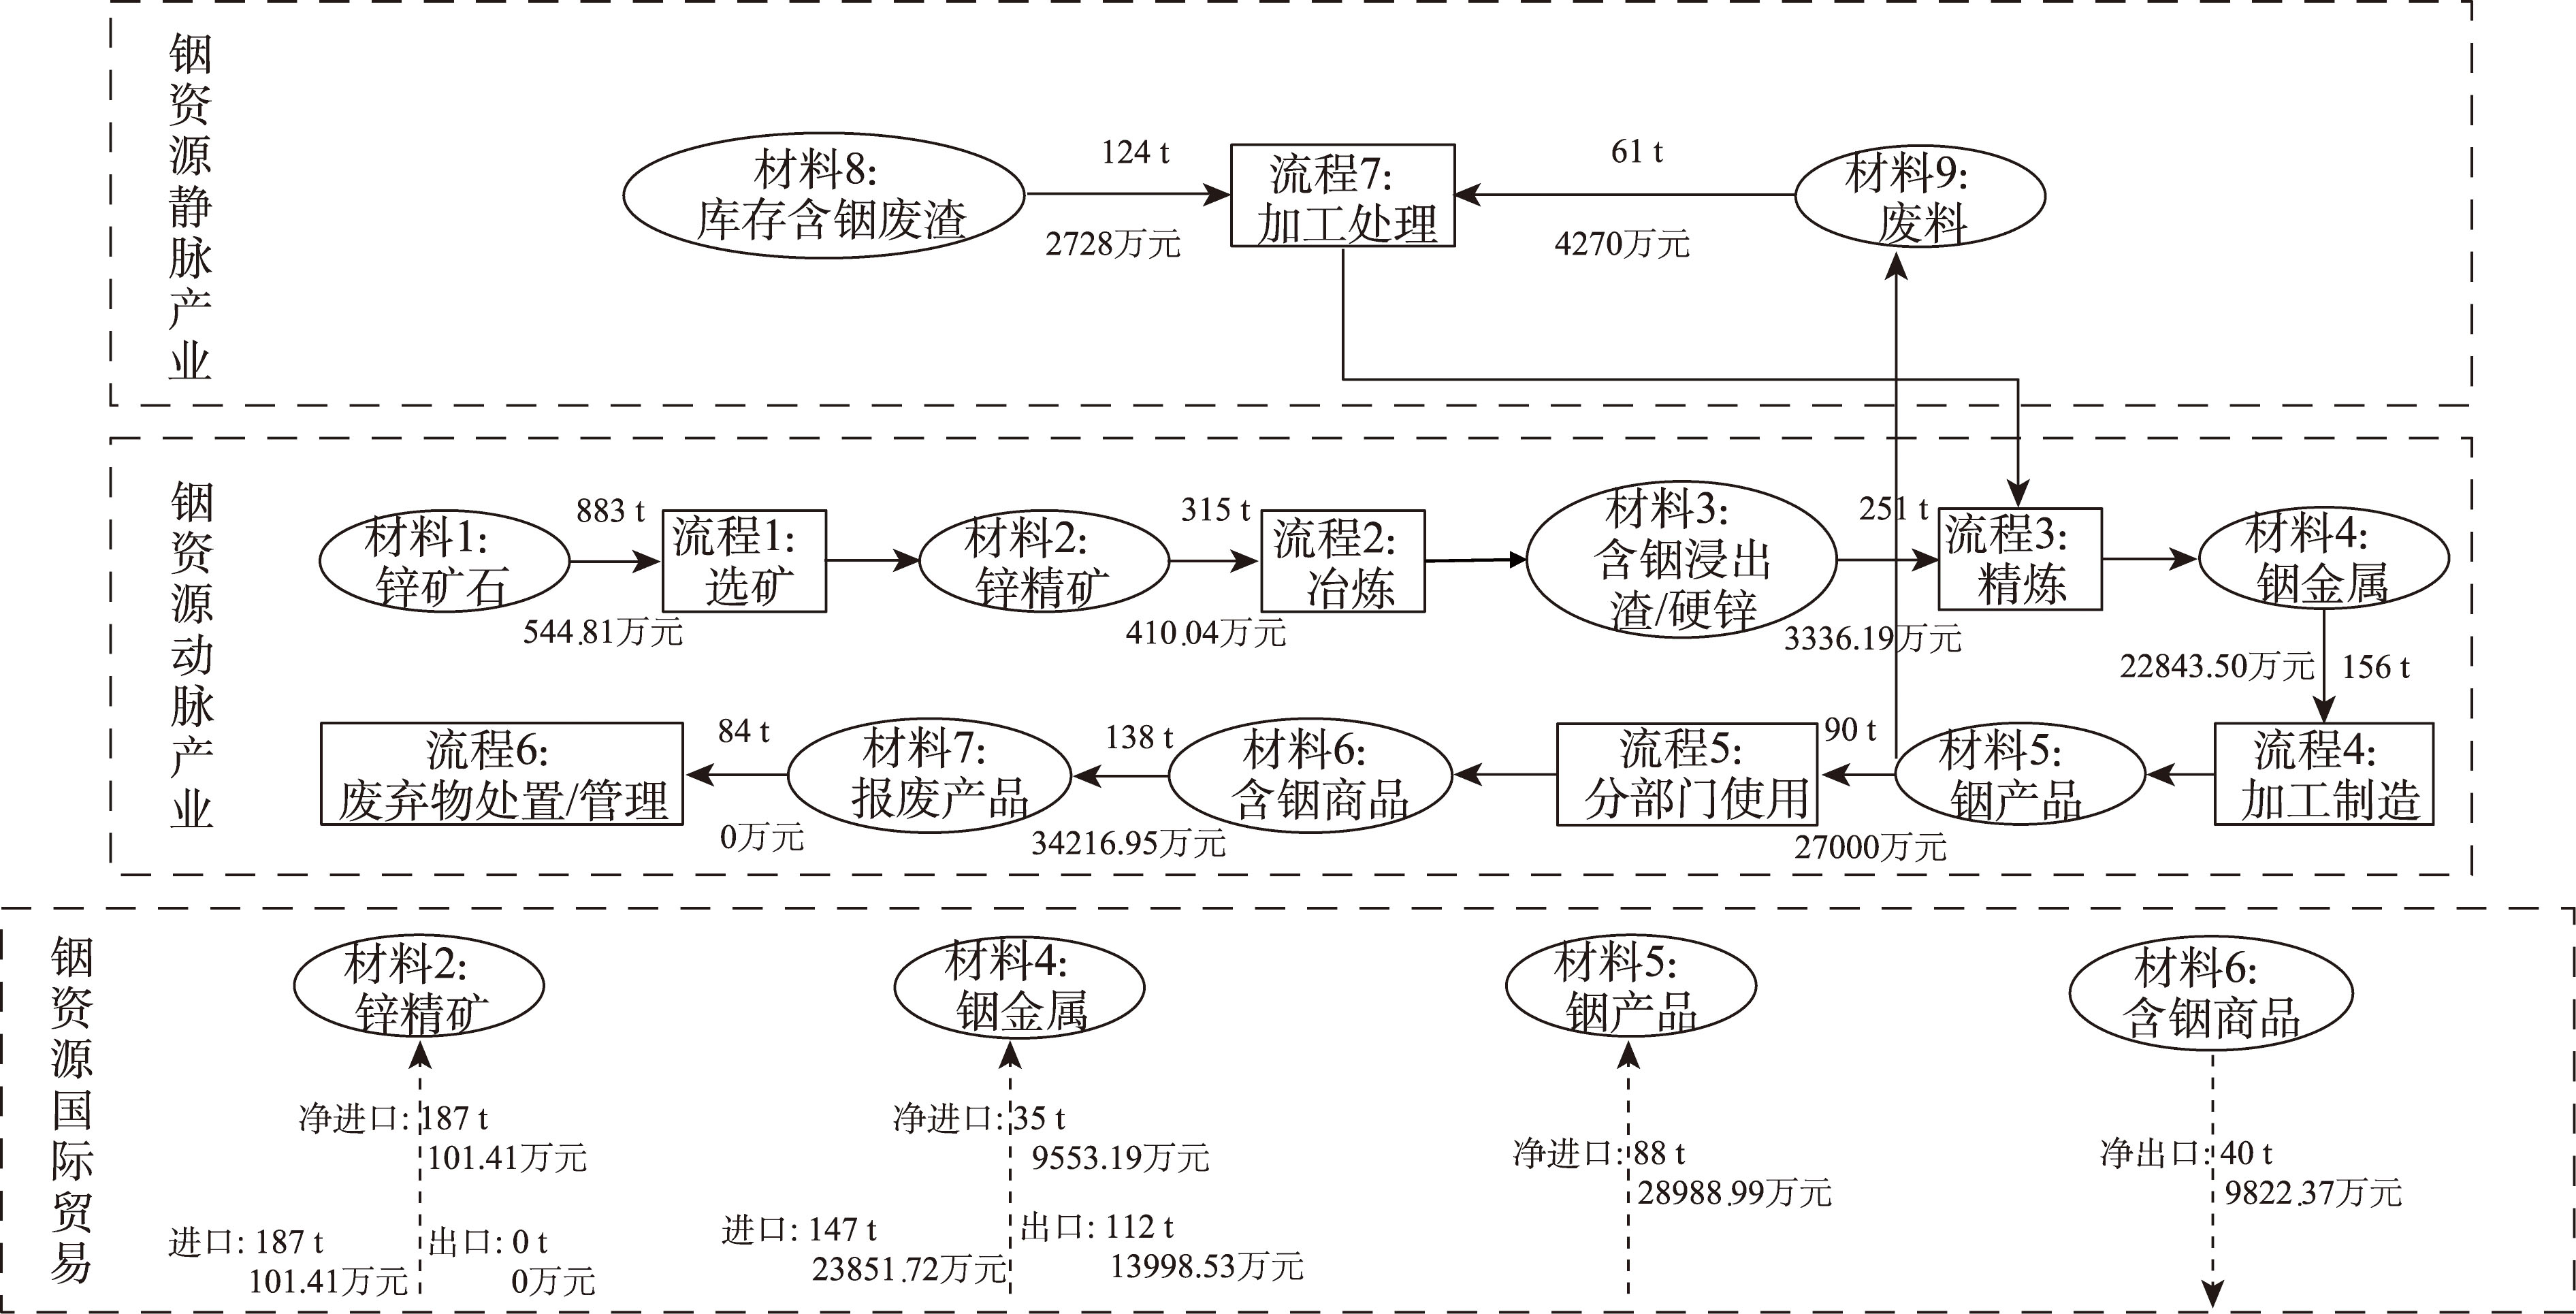
Figure 3
Value flow mapping of indium resources across the industry chain in China, 2019
Other figure/table from this article
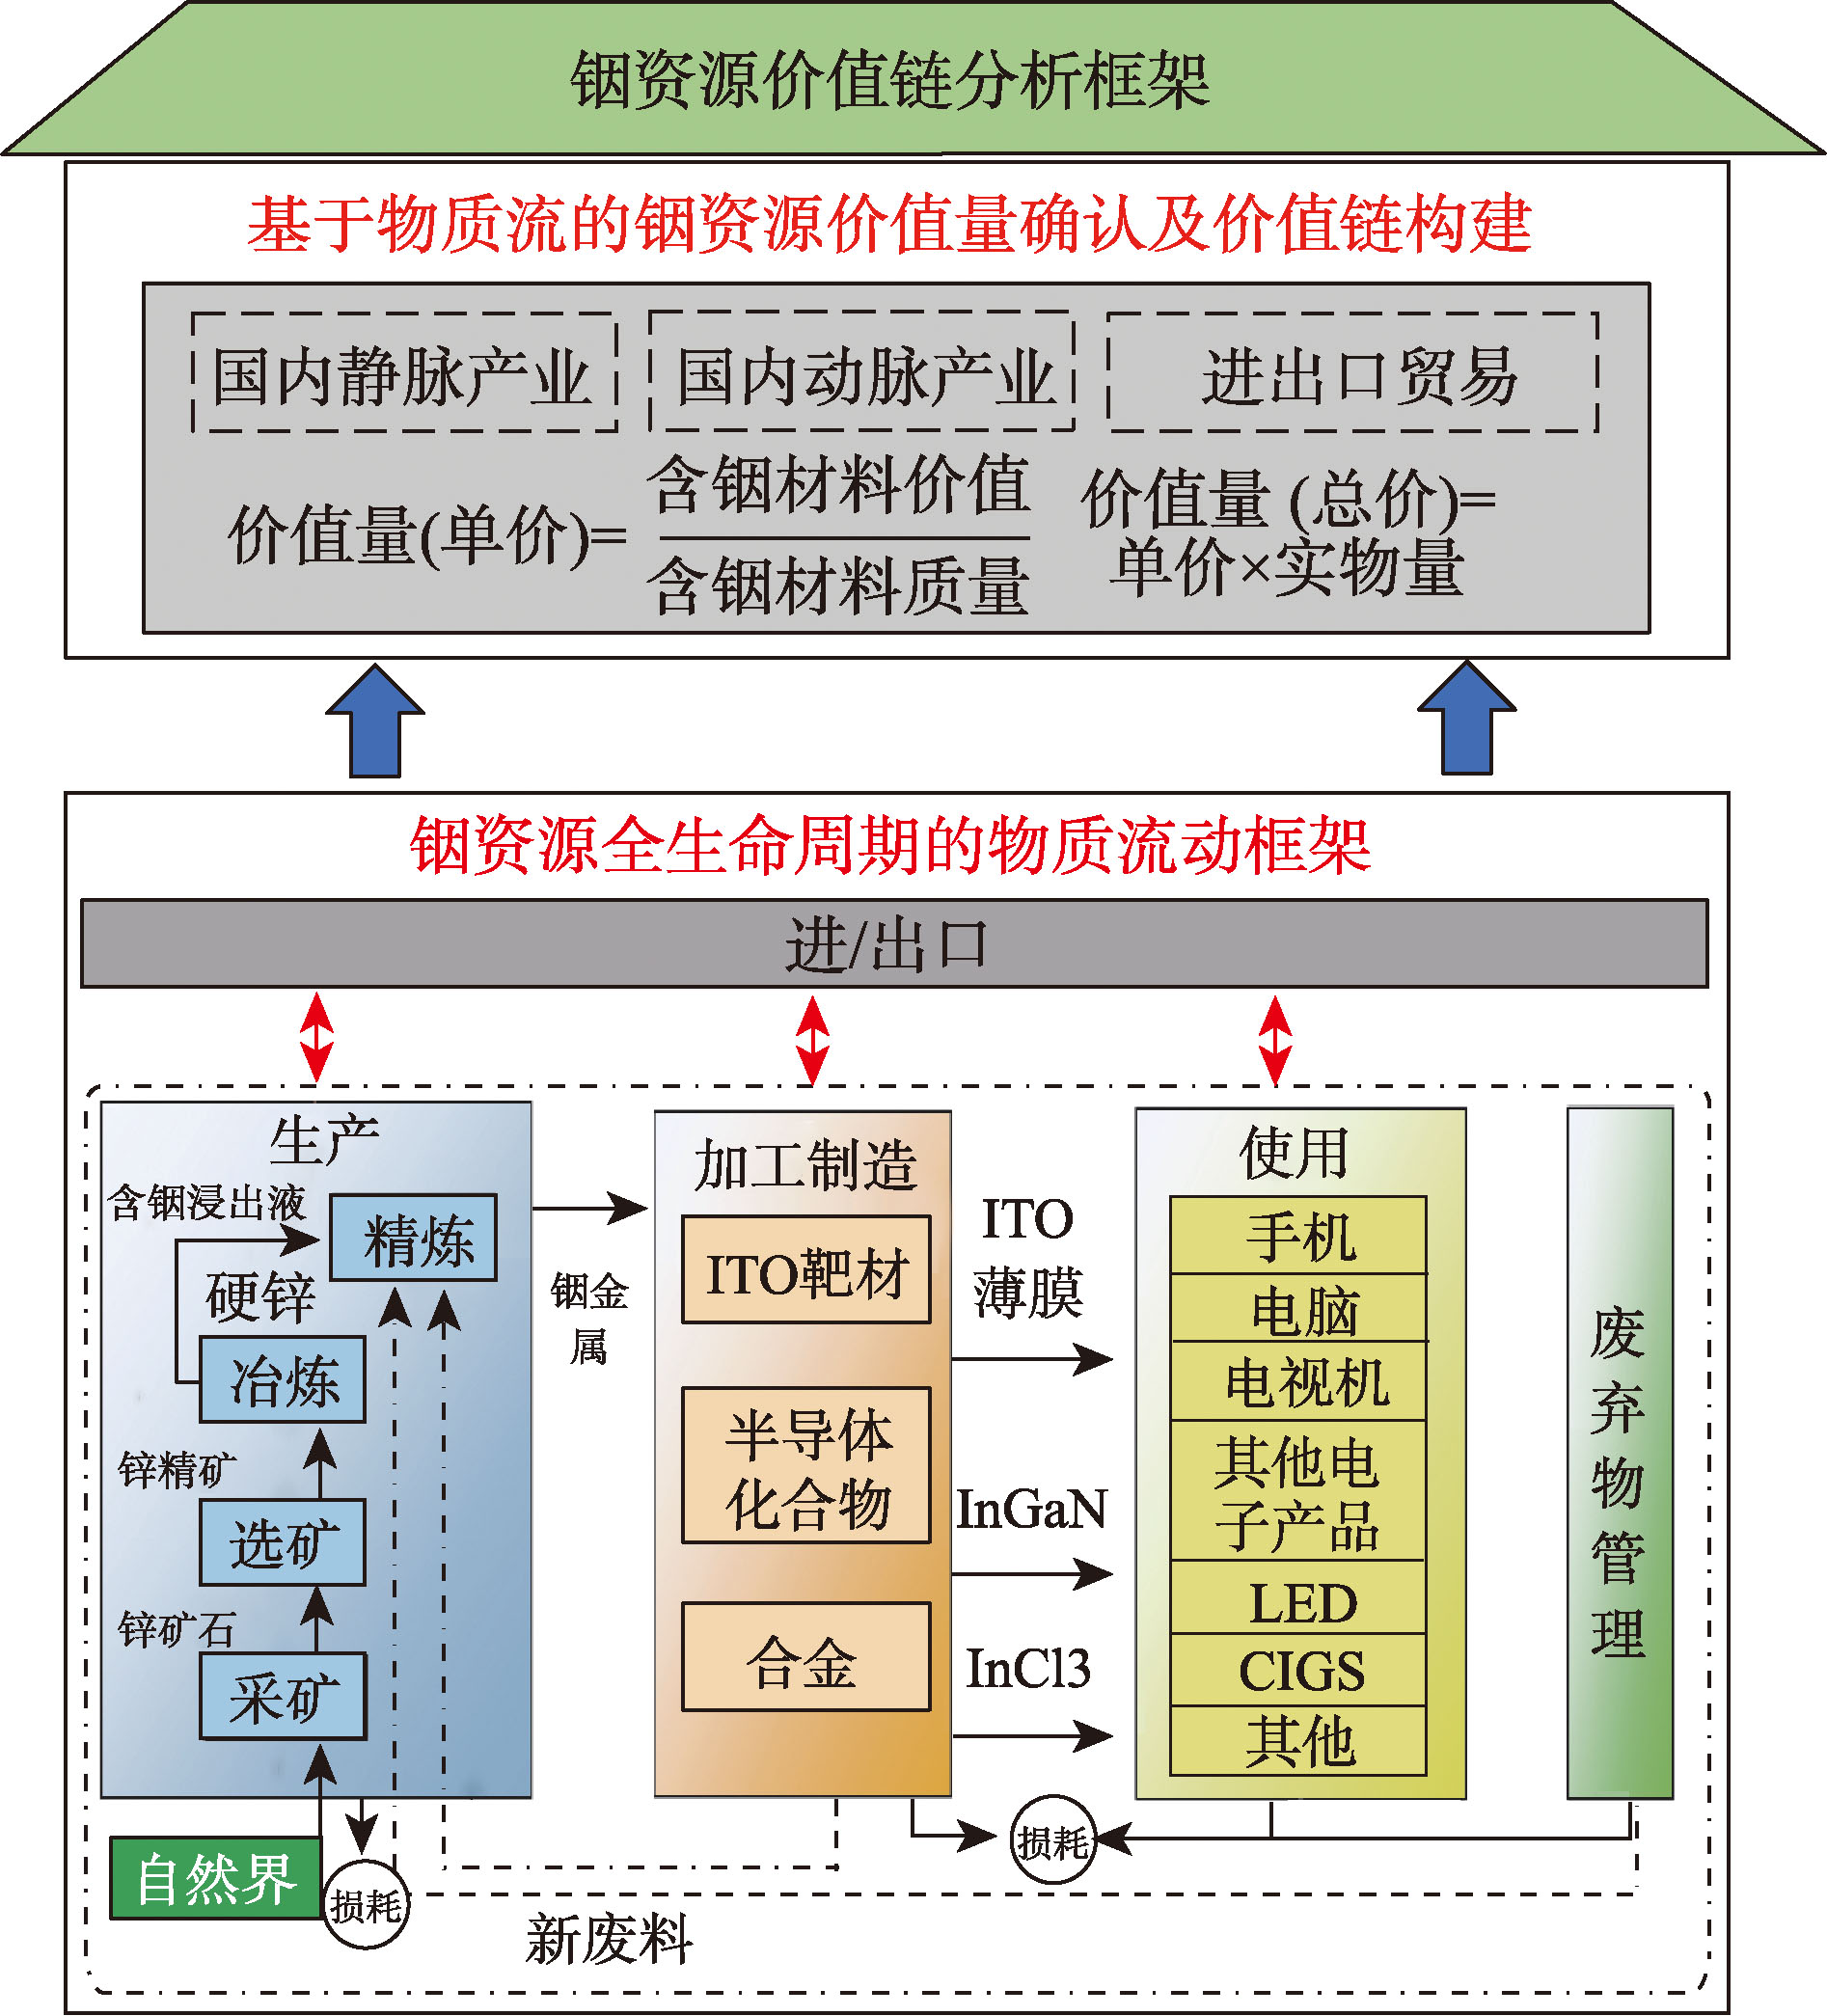
Figure 1
Research framework of indium resource value chain
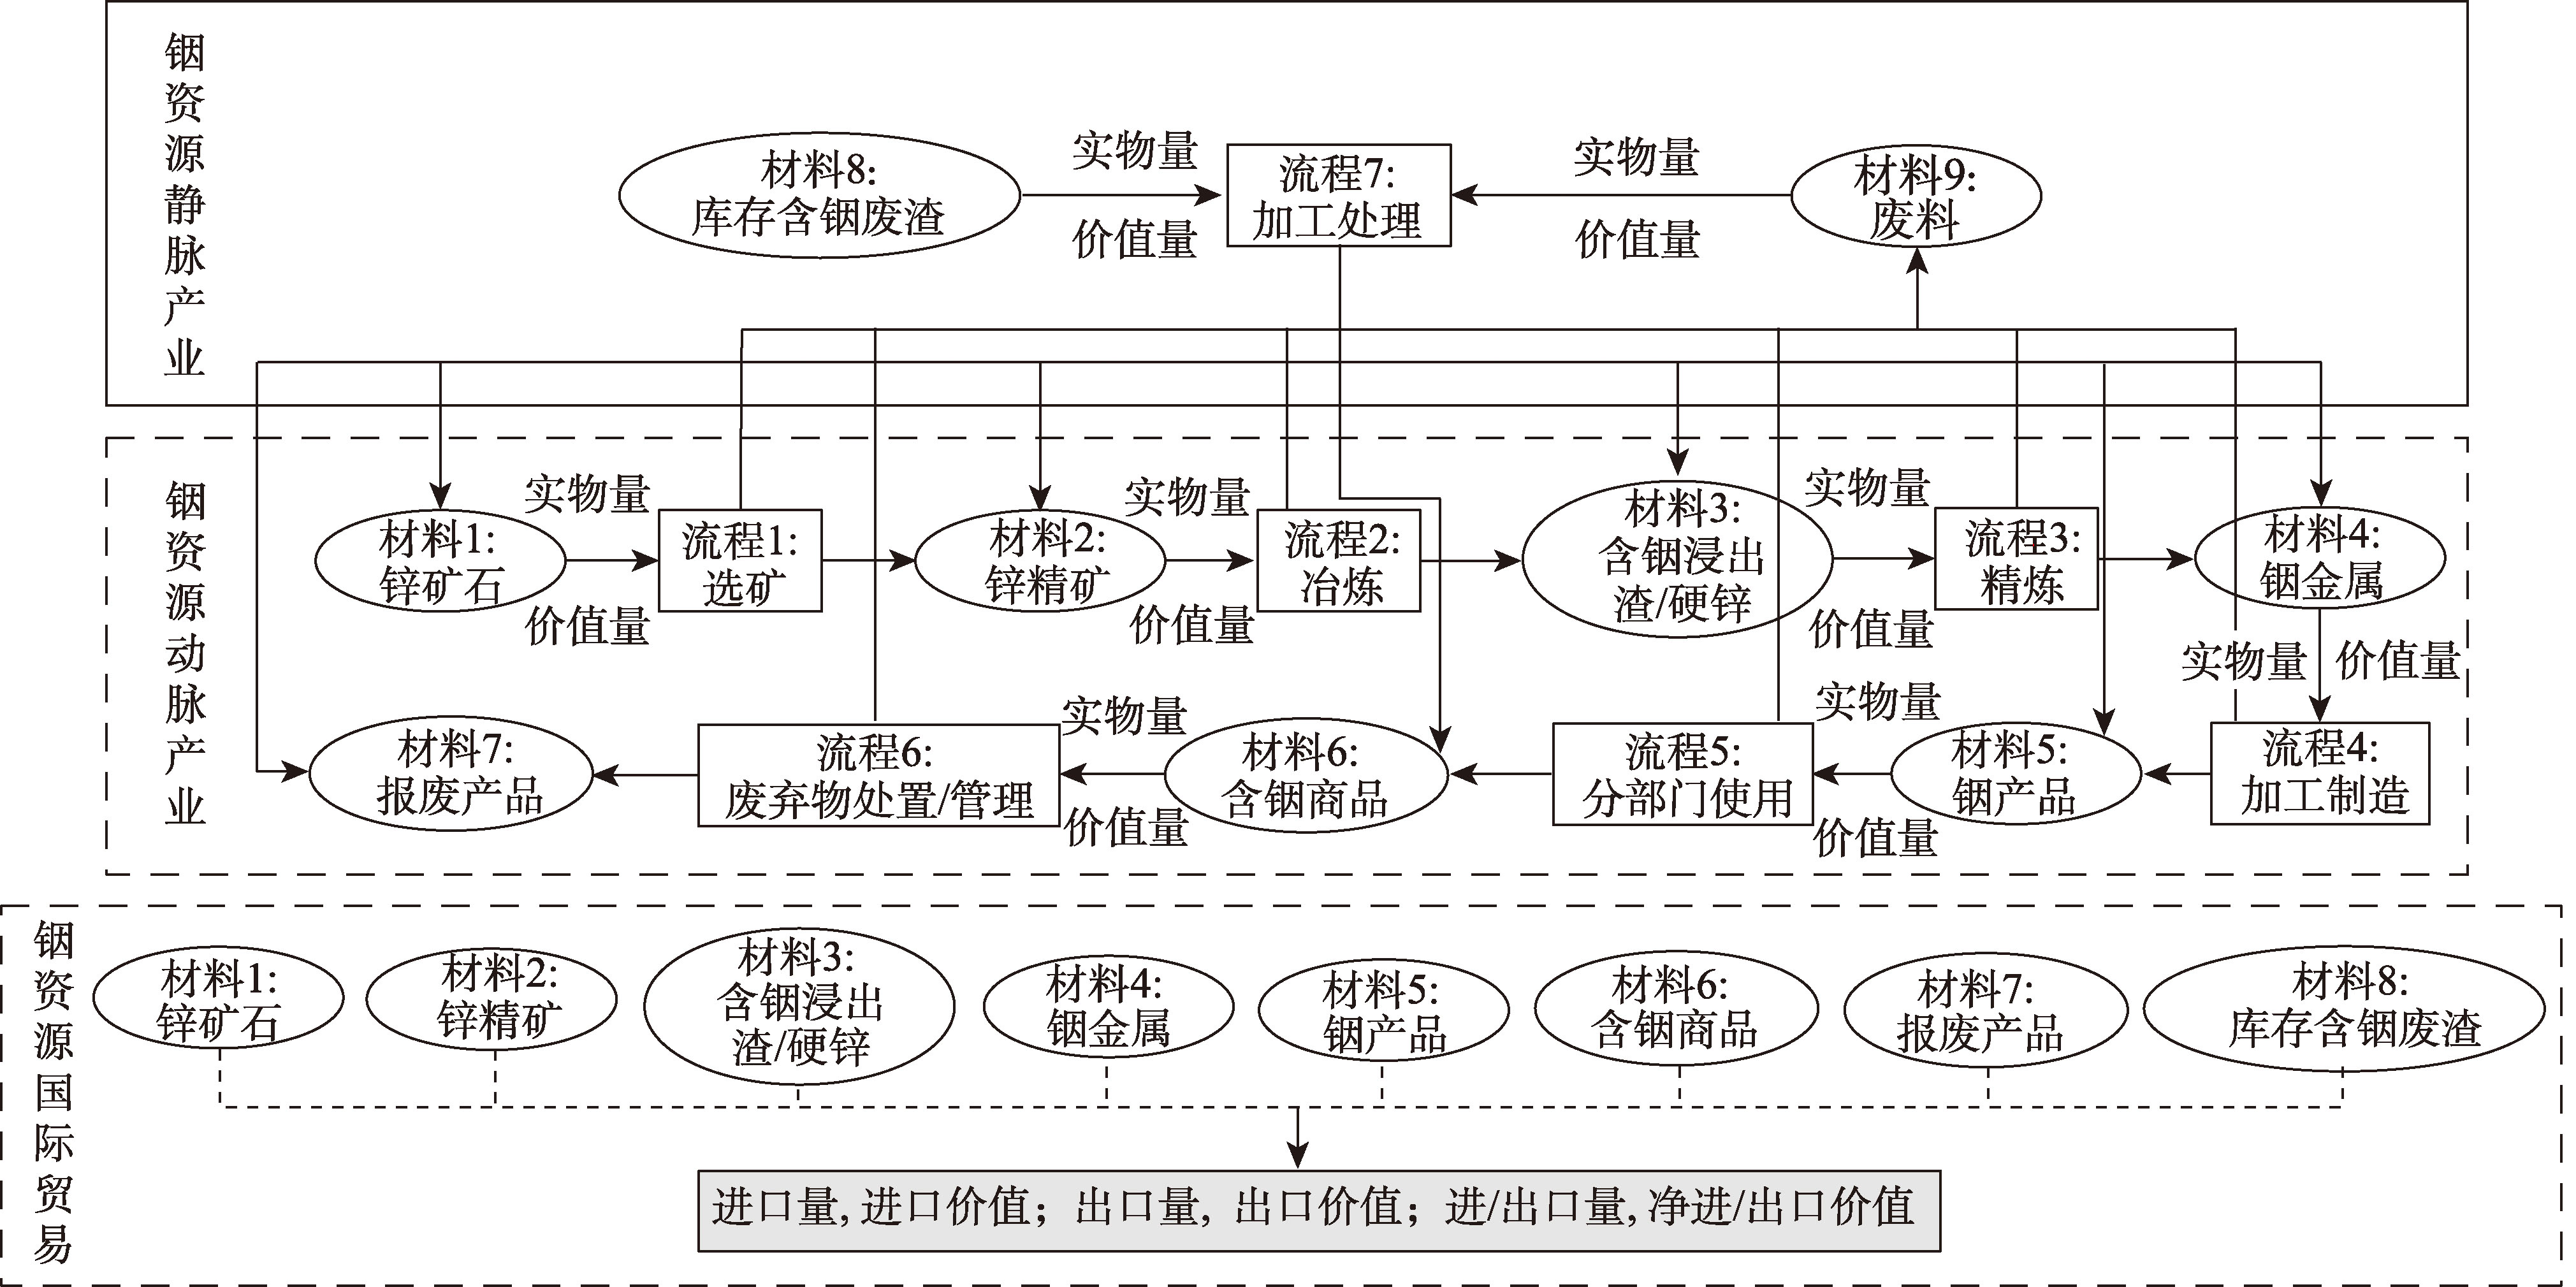
Figure 2
A value flow framework for three subsystems: arterial industry, venous industry and international trade of indium resources in China
Table 1
Unit price and value-added rate of indium in typical indium-containing end products, 2019
Table 2
Data Sheet on Indium-Containing Resources in Representative End Products
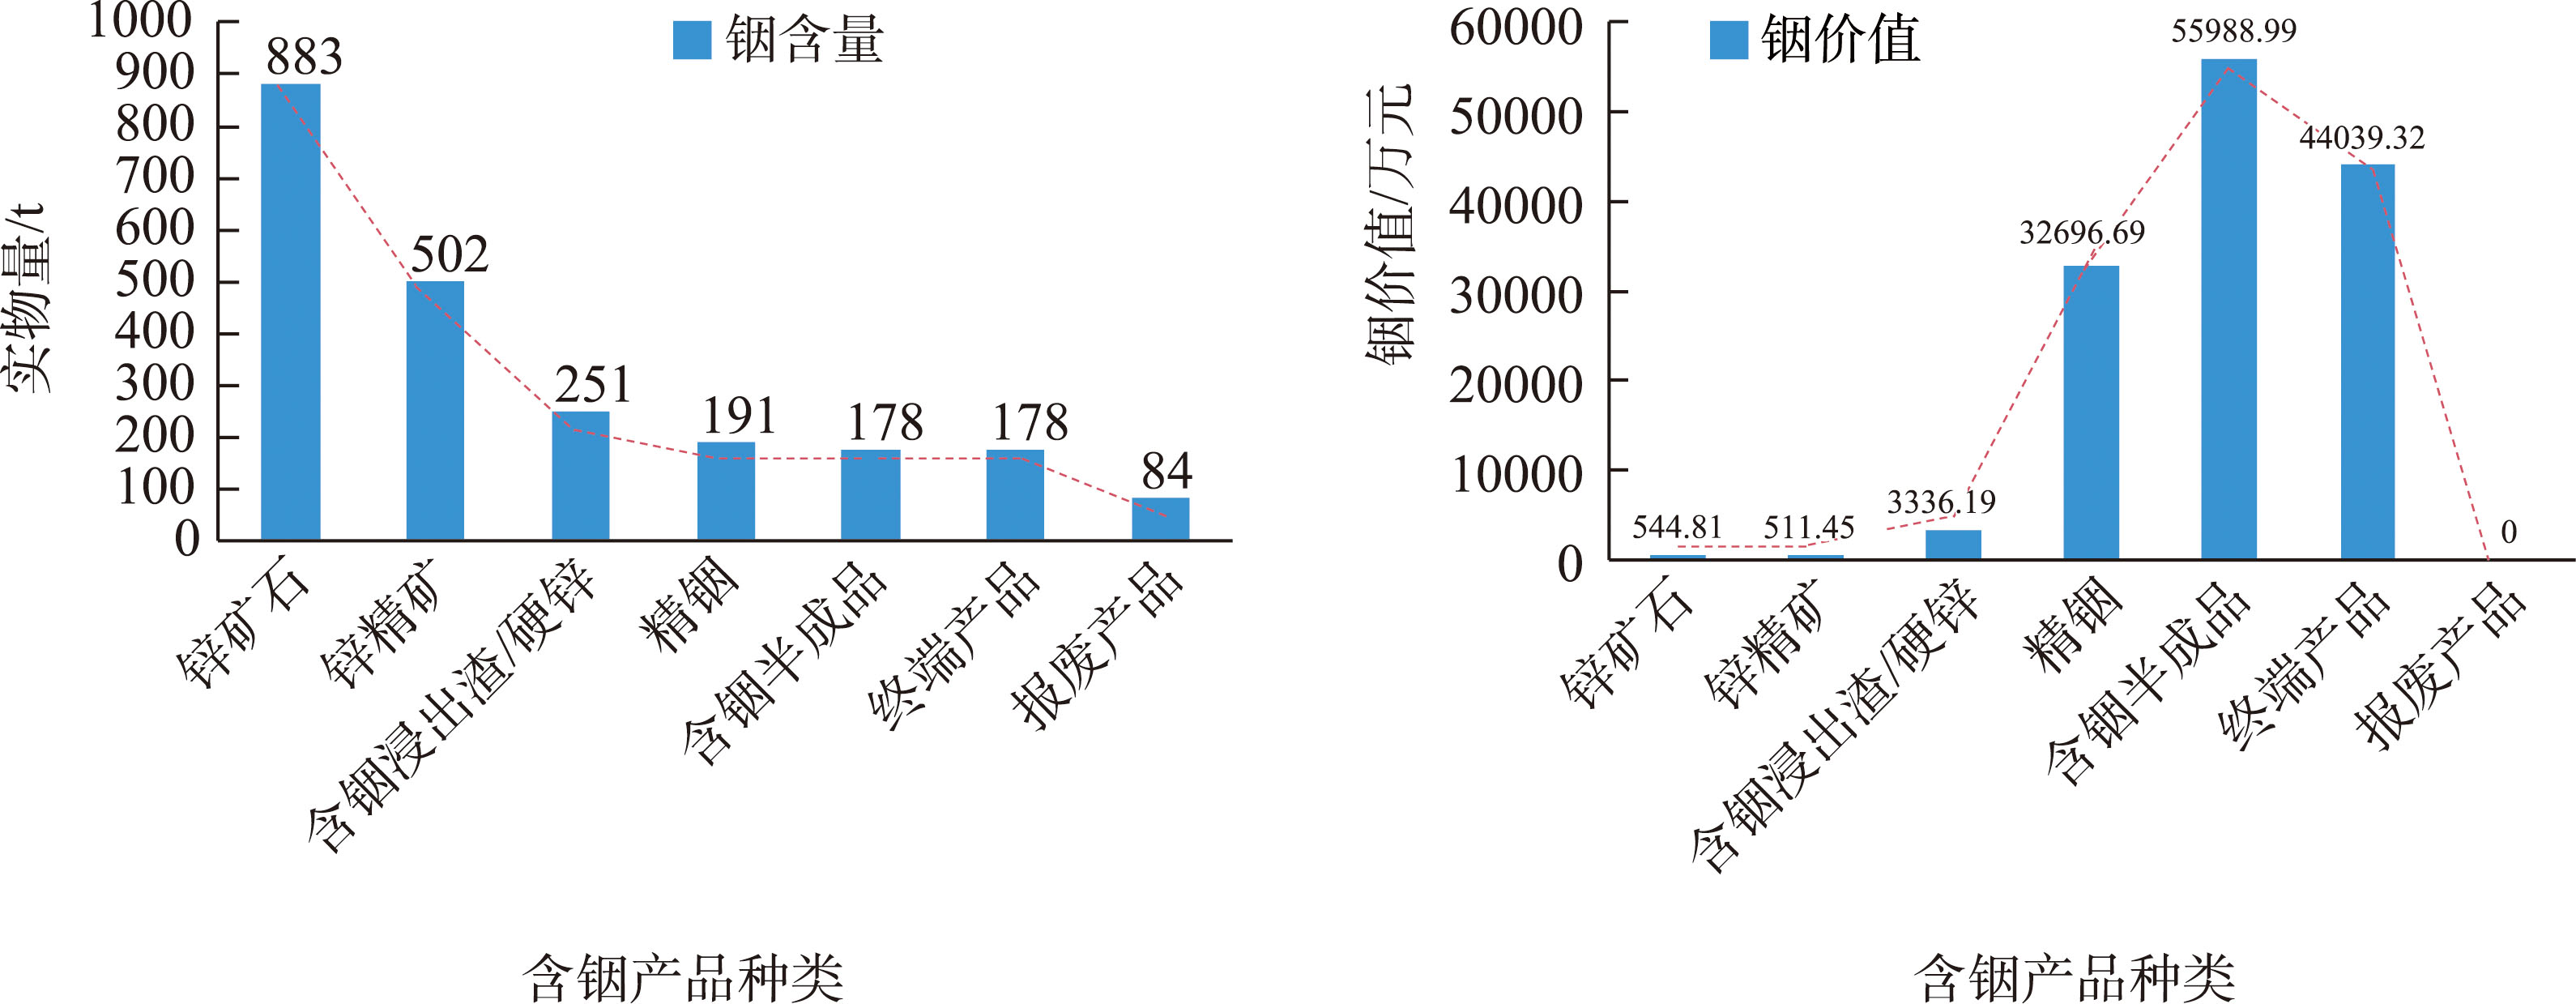
Figure 4
Indium resource physical quantity inverted triangle state and indium resource value triangle state, 2019
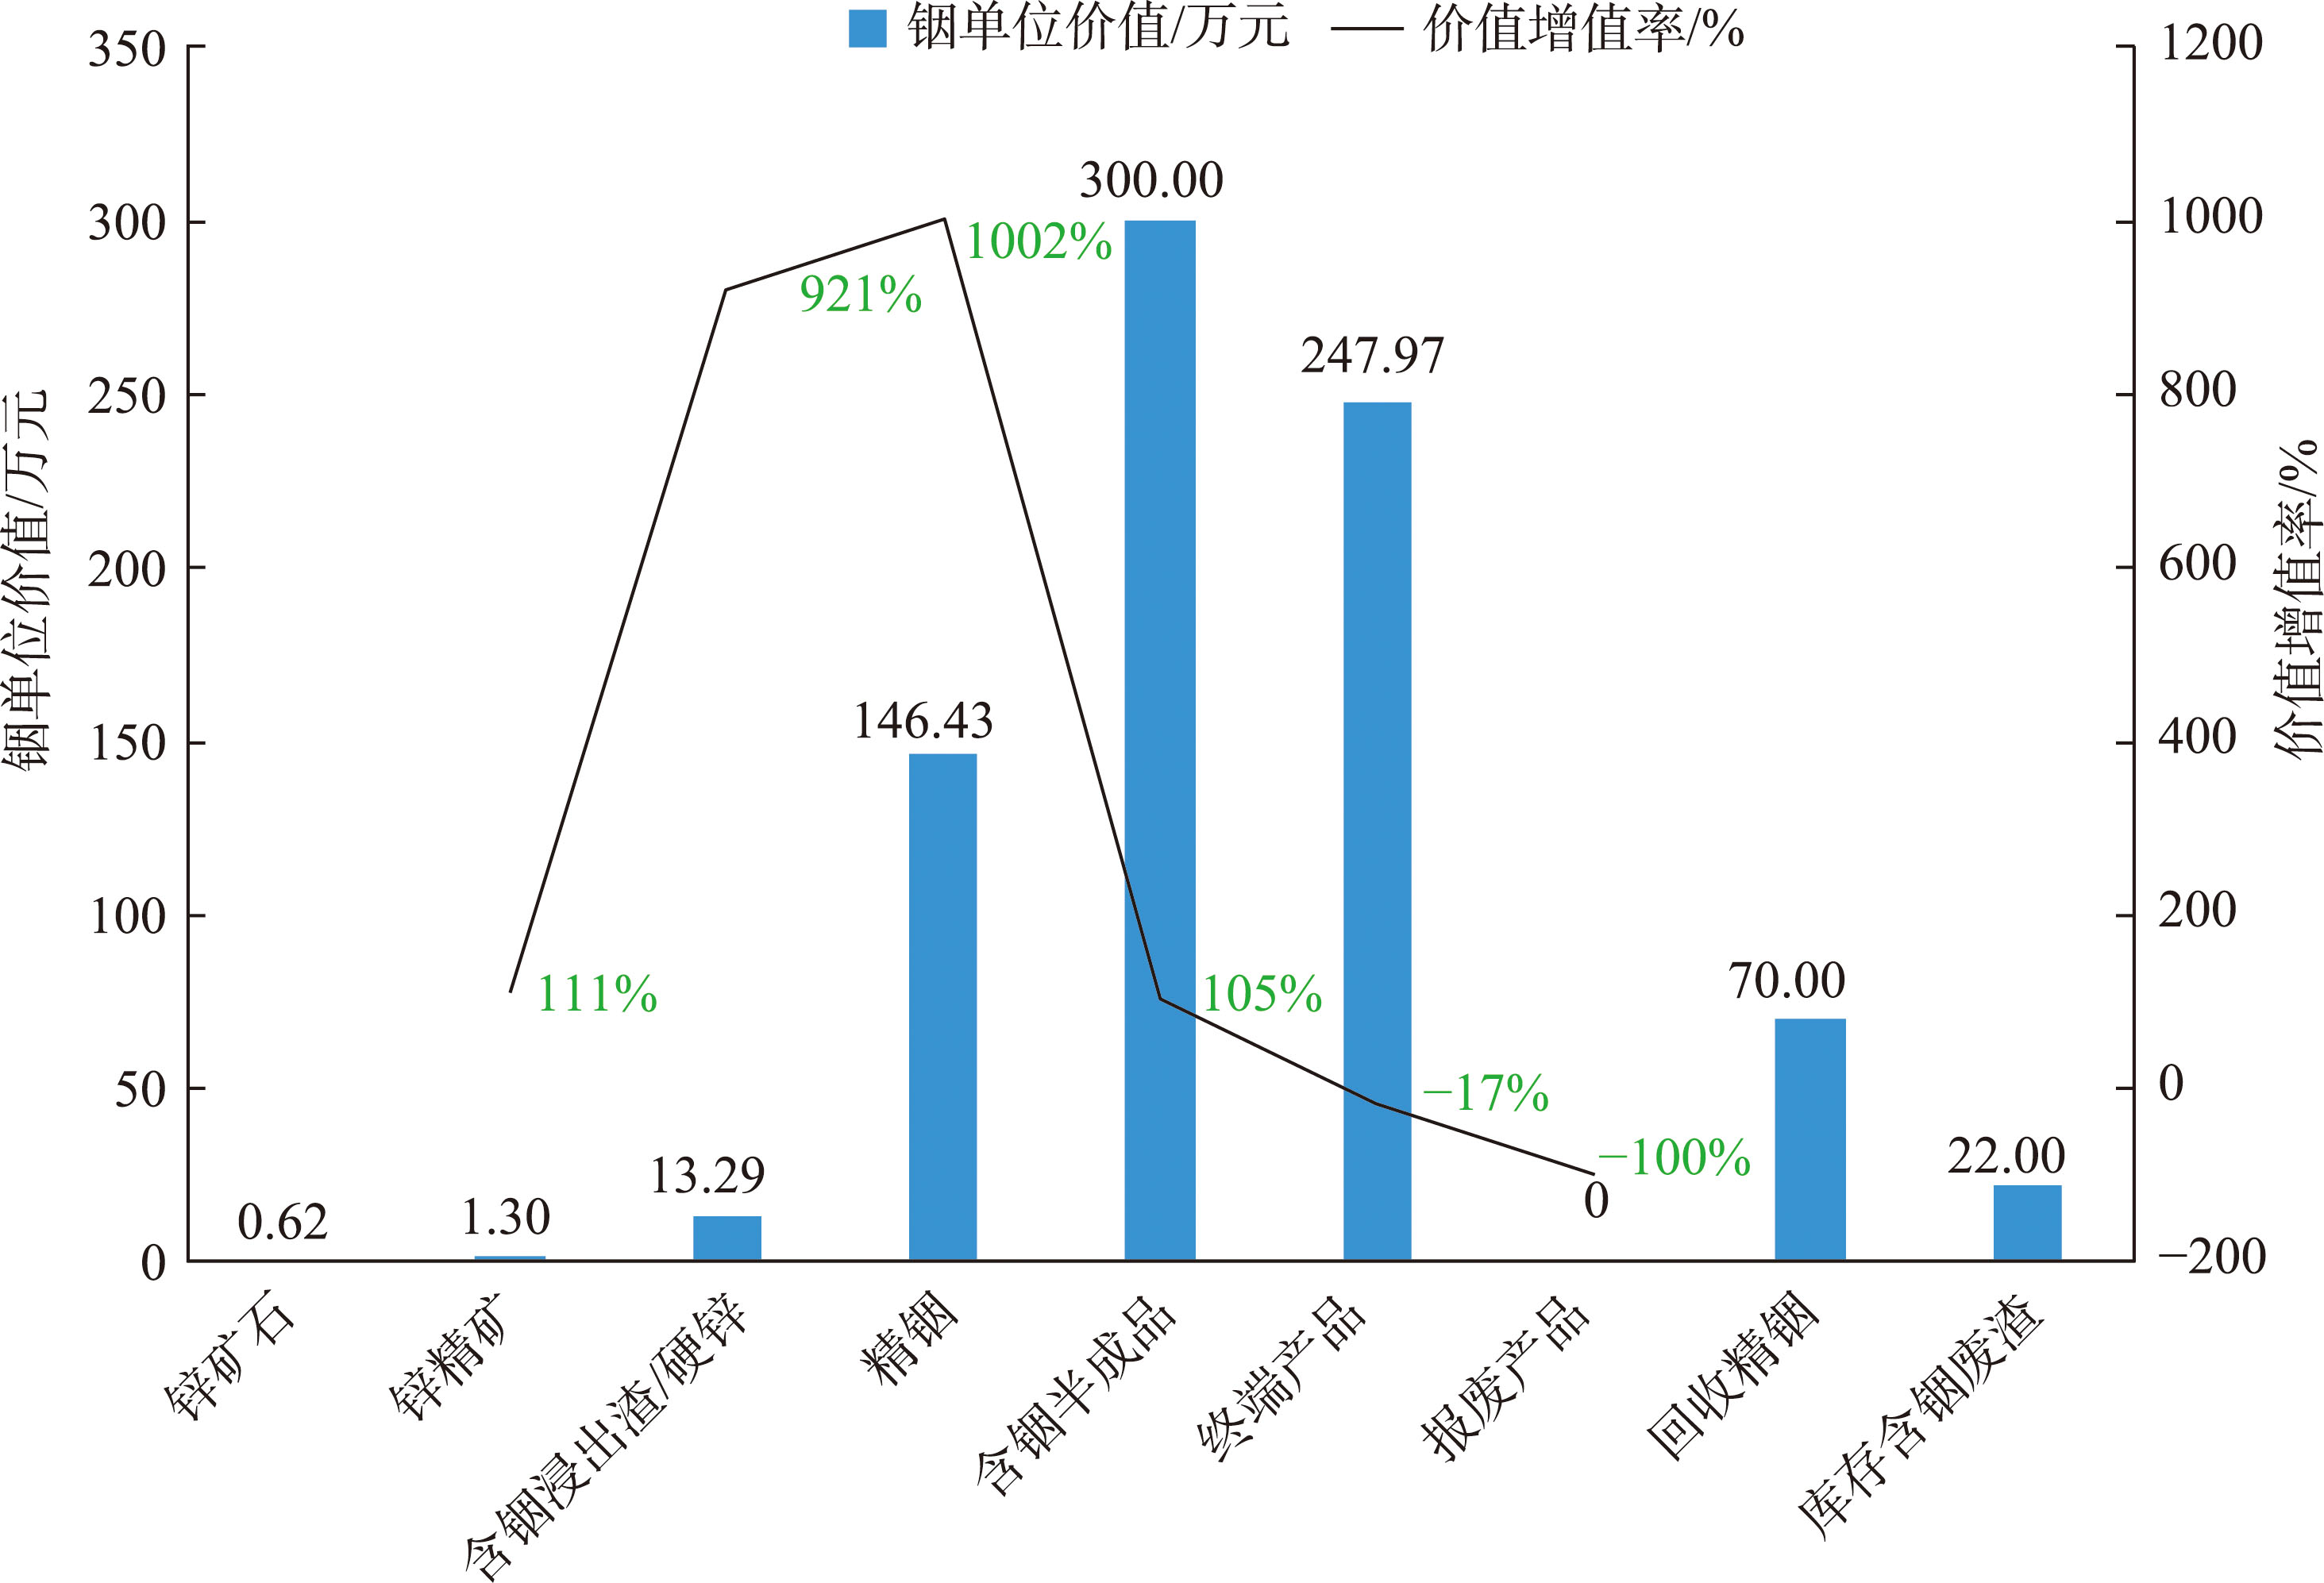
Figure 5
Unit value and value appreciation rate of main indium containing materials
Table3
Value-added rate of each segment in the complete industrial chain of indium resources