×
模态框(Modal)标题
在这里添加一些文本
Close
Close
Submit
Cancel
Confirm
×
模态框(Modal)标题
×
Journal
Article
Figure
Search
EN
中文
Home
About Journal
Overview
Indexing & Honors
Open Access
Editorial Board
Guide for Authors
Browse
Current Issue
Online First
Archive
Highlights
Topic
Archive by Subject
Most Viewed
Most Download
Most Cited
E-mail Alert
RSS
Subscribe
Advertisement
Contact us
EN
中文
Figure/Table detail
Patrol pattern mining for UAV trajectory
XIN Rui, SHI Yan, WANG Jiaoe, ZHU Qianle, XU Chenchen
Resources Science
, 2025, 47(
8
): 1689-1701. DOI:
10.18402/resci.2025.08.07
属性
时间区间
莫兰指数
高度
夜间
0.9998
晨间
0.9966
日间
0.9710
瞬时速度
夜间
0.5367
晨间
0.4846
日间
0.3271
Table 7
Moran’s
I
index for different time periods
Other figure/table from this article
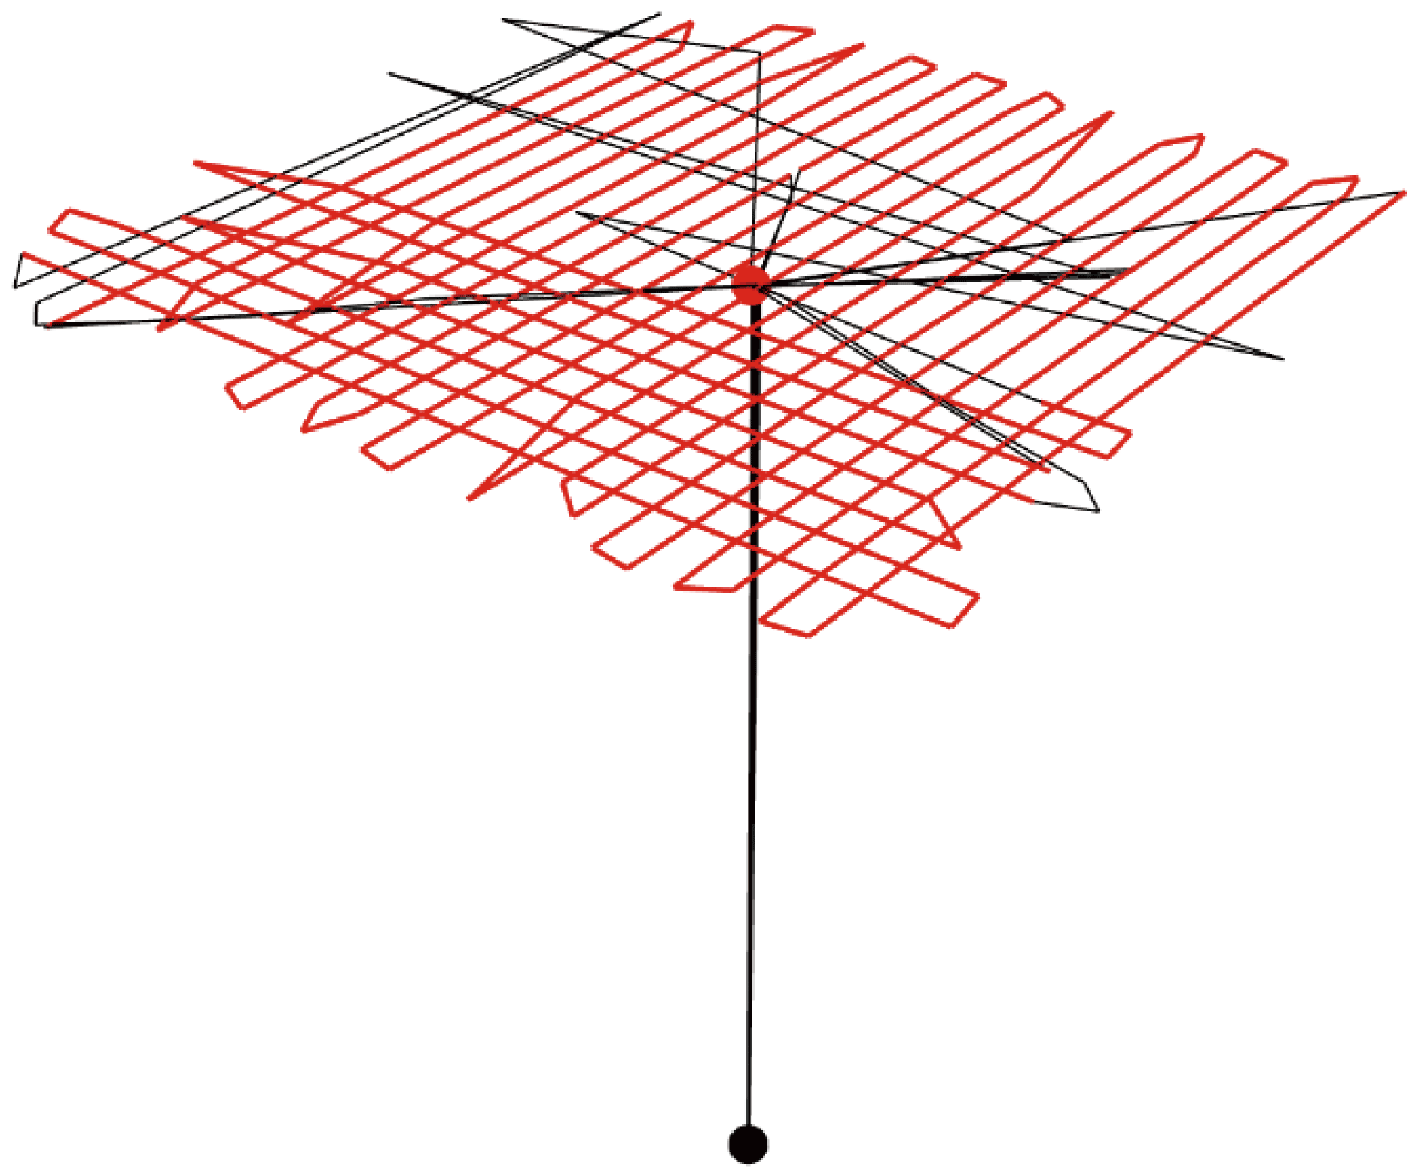
Figure 1
Example of patrol trajectory
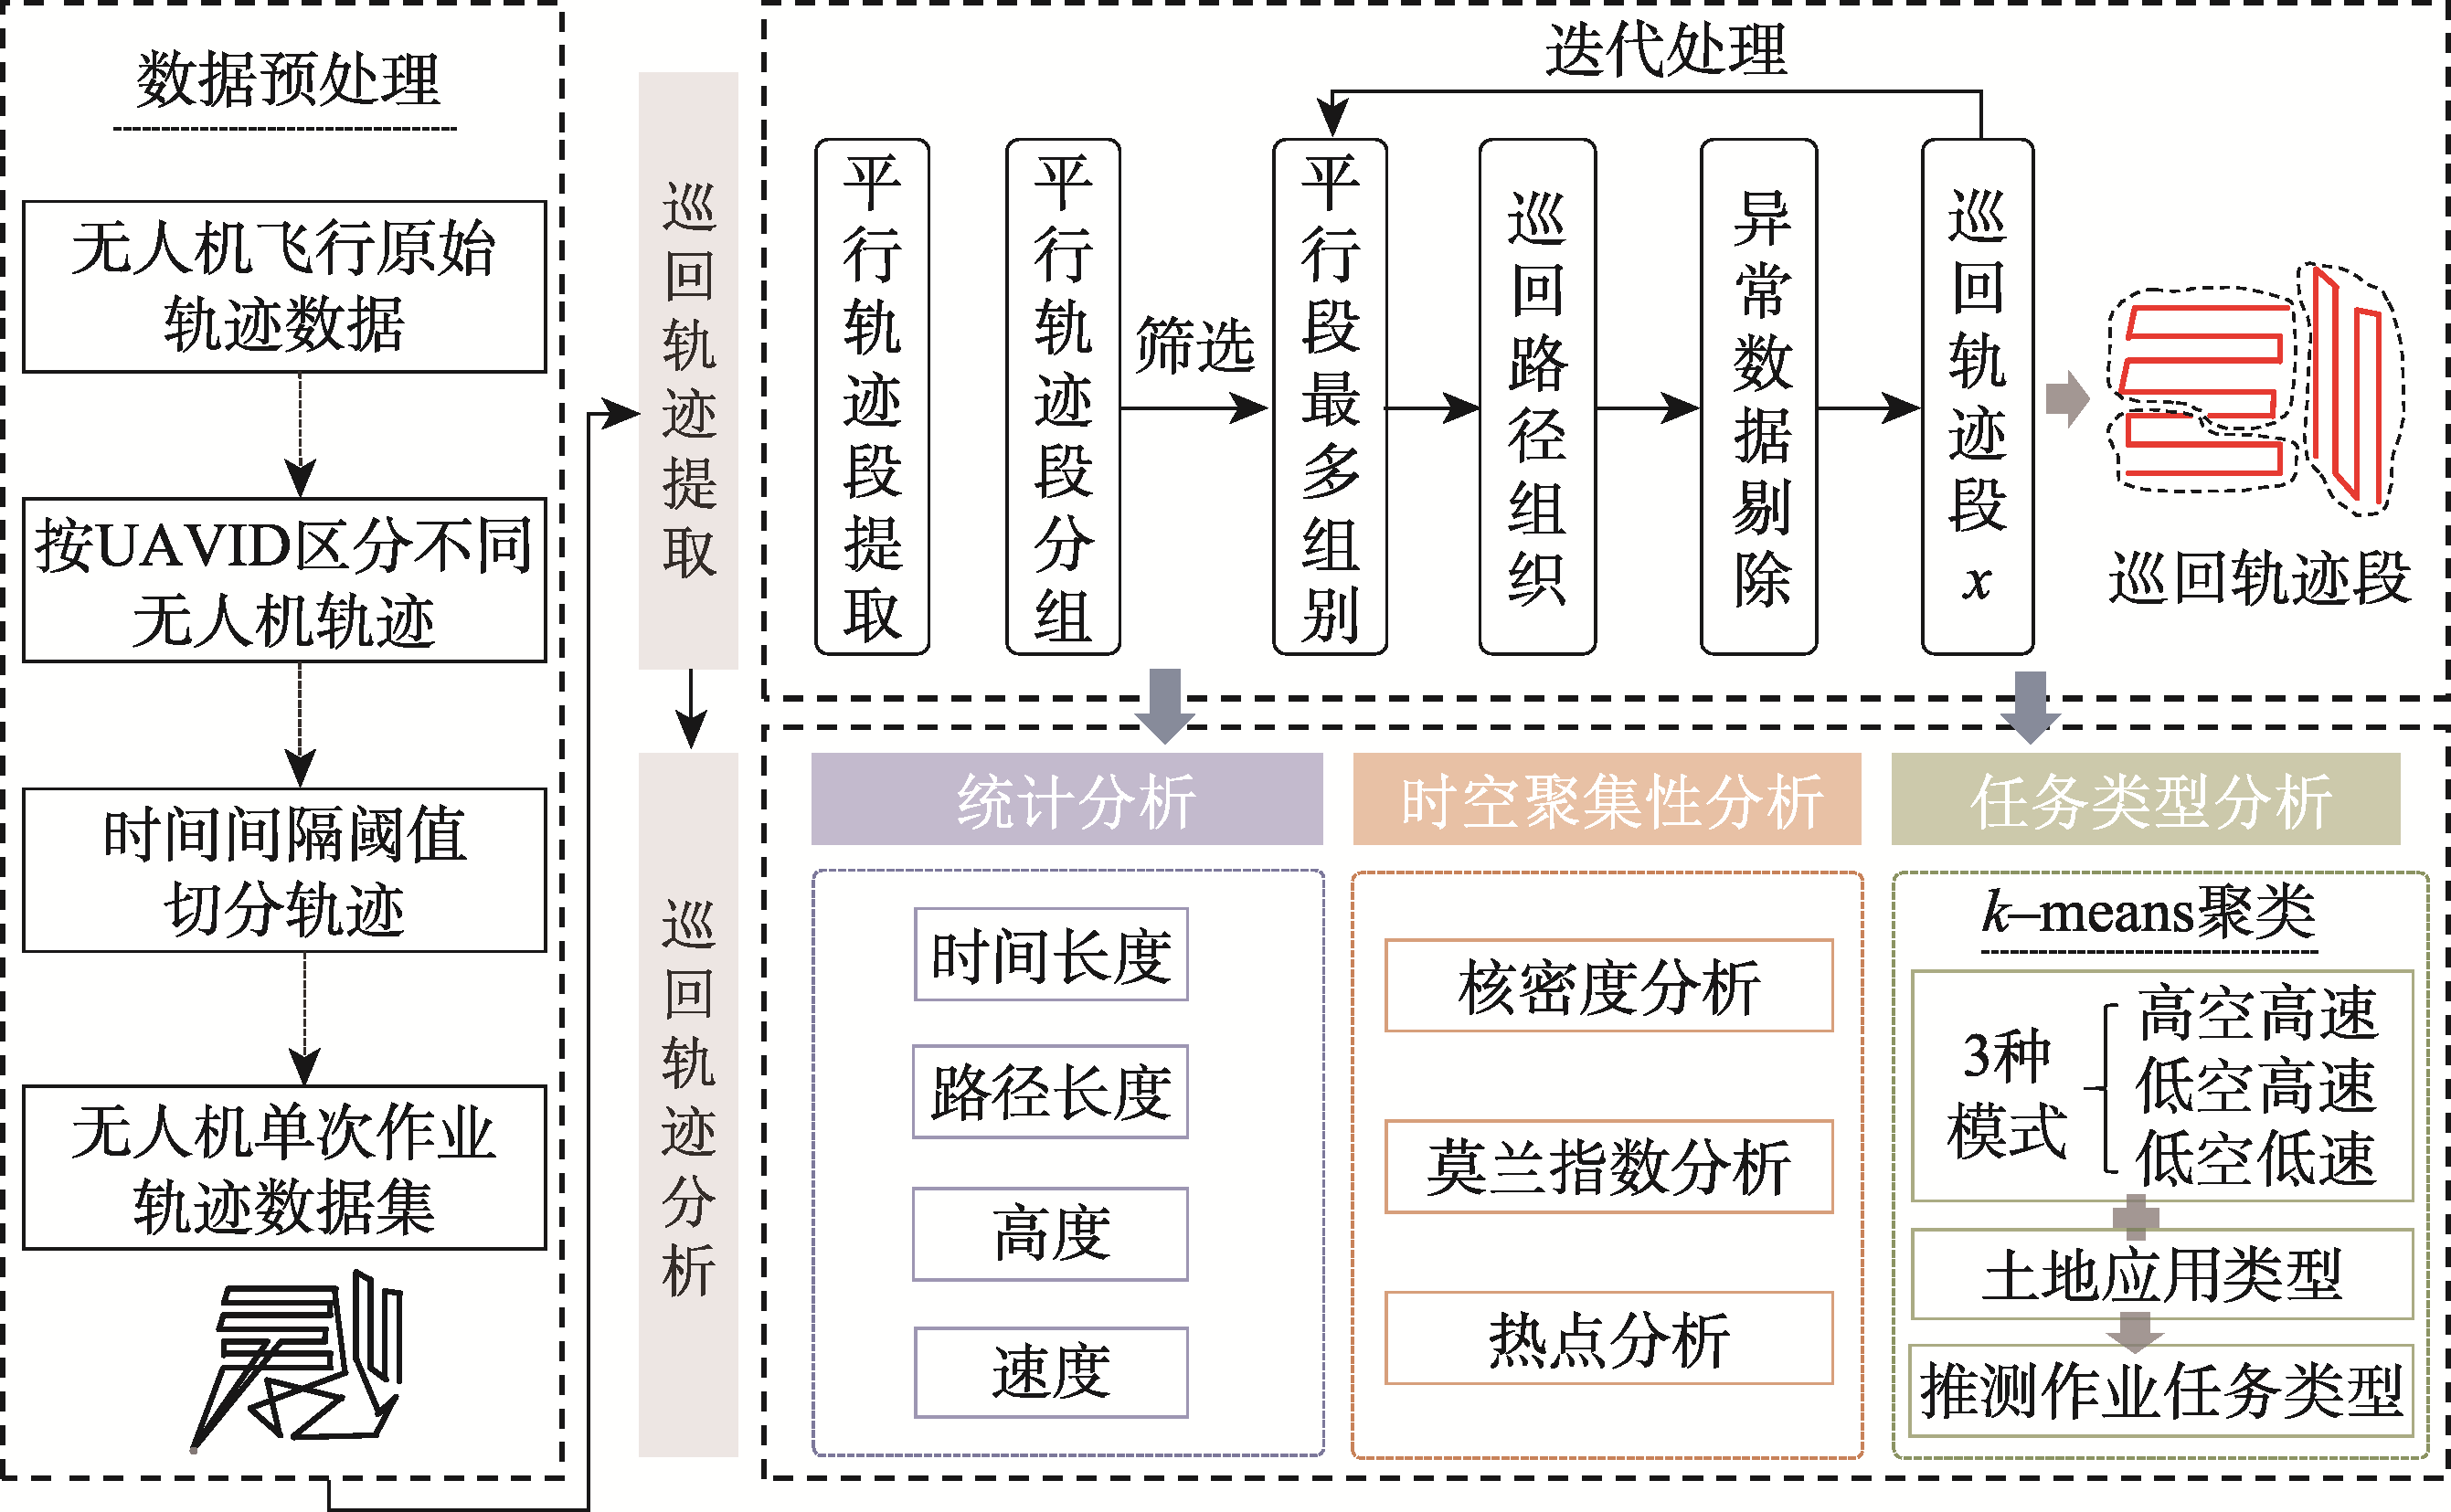
Figure 2
Framework of research method
Table 1
Information of data samples used in this study
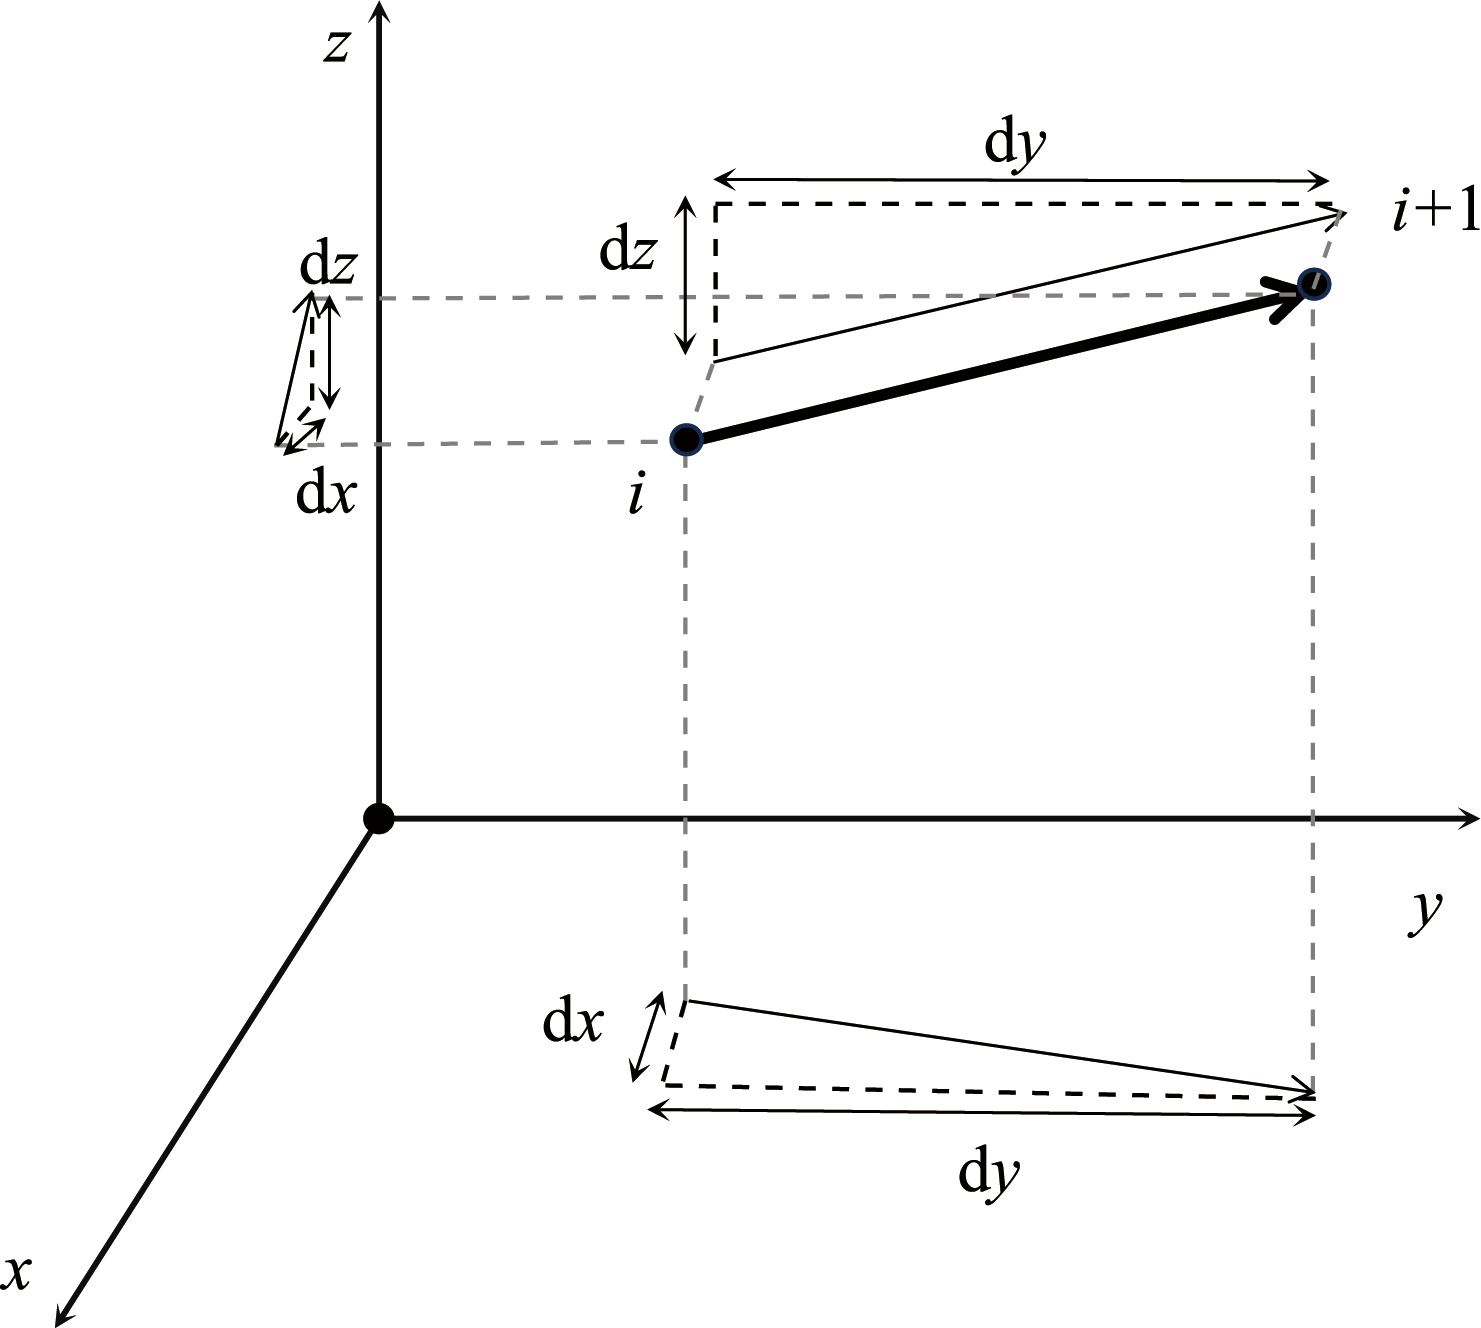
Figure 3
Schematic diagram of UAV trajectory slope calculation
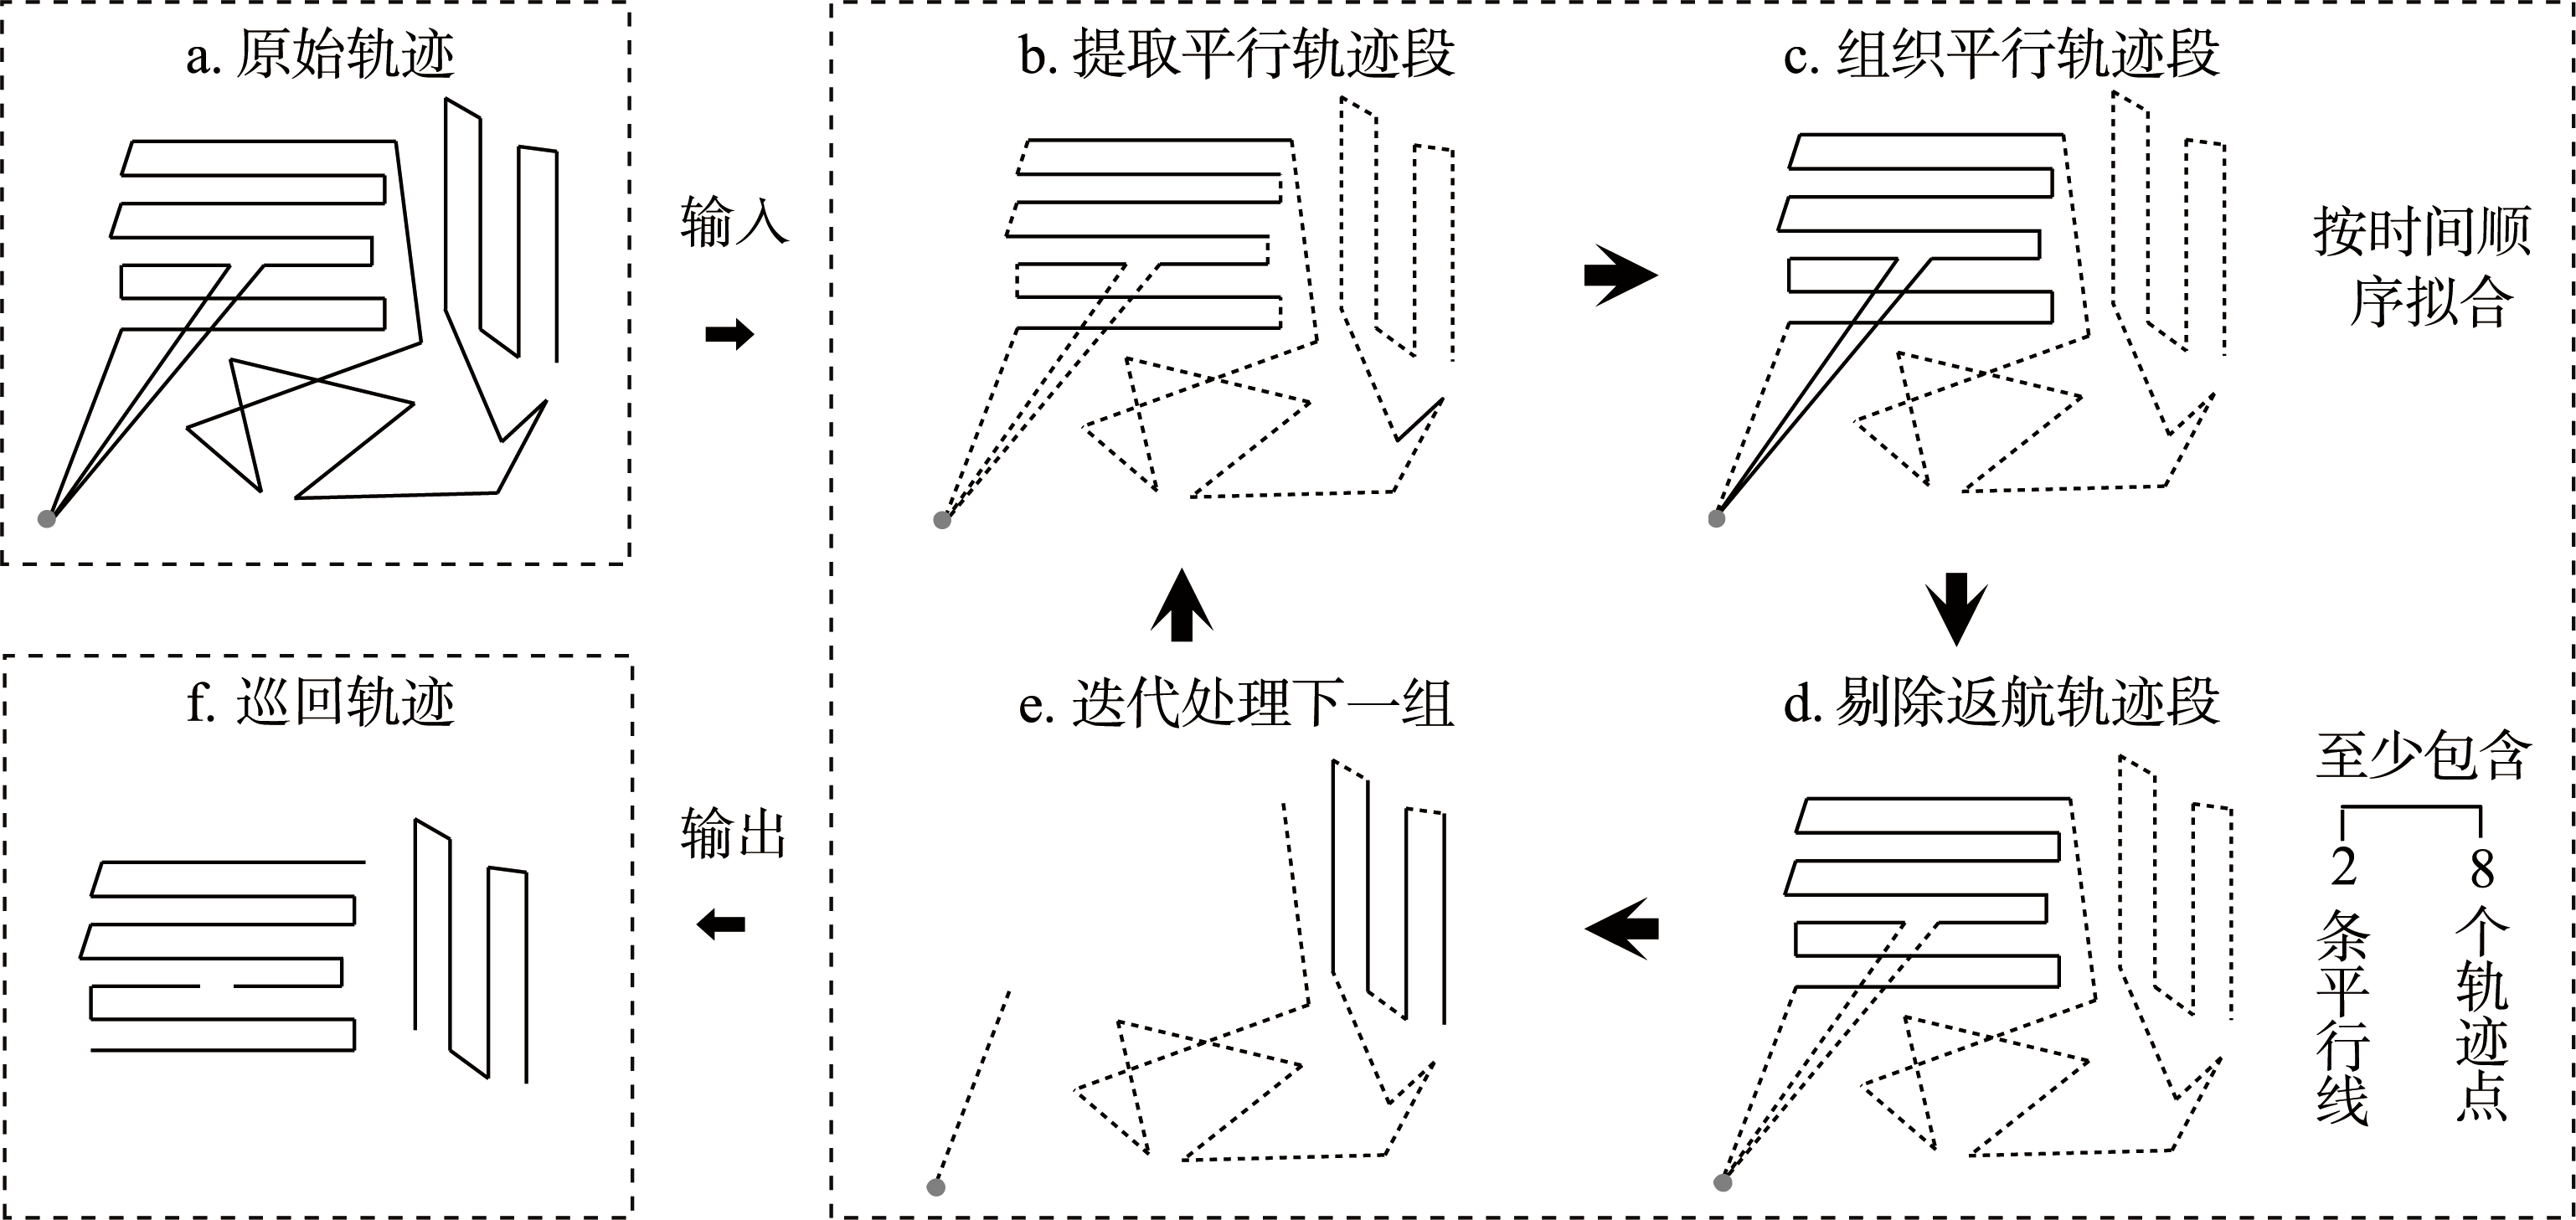
Figure 4
Patrol trajectory extraction process
Table 2
Results of patrol trajectory extraction
Table 3
Accuracy evaluation of patrol trajectory extraction
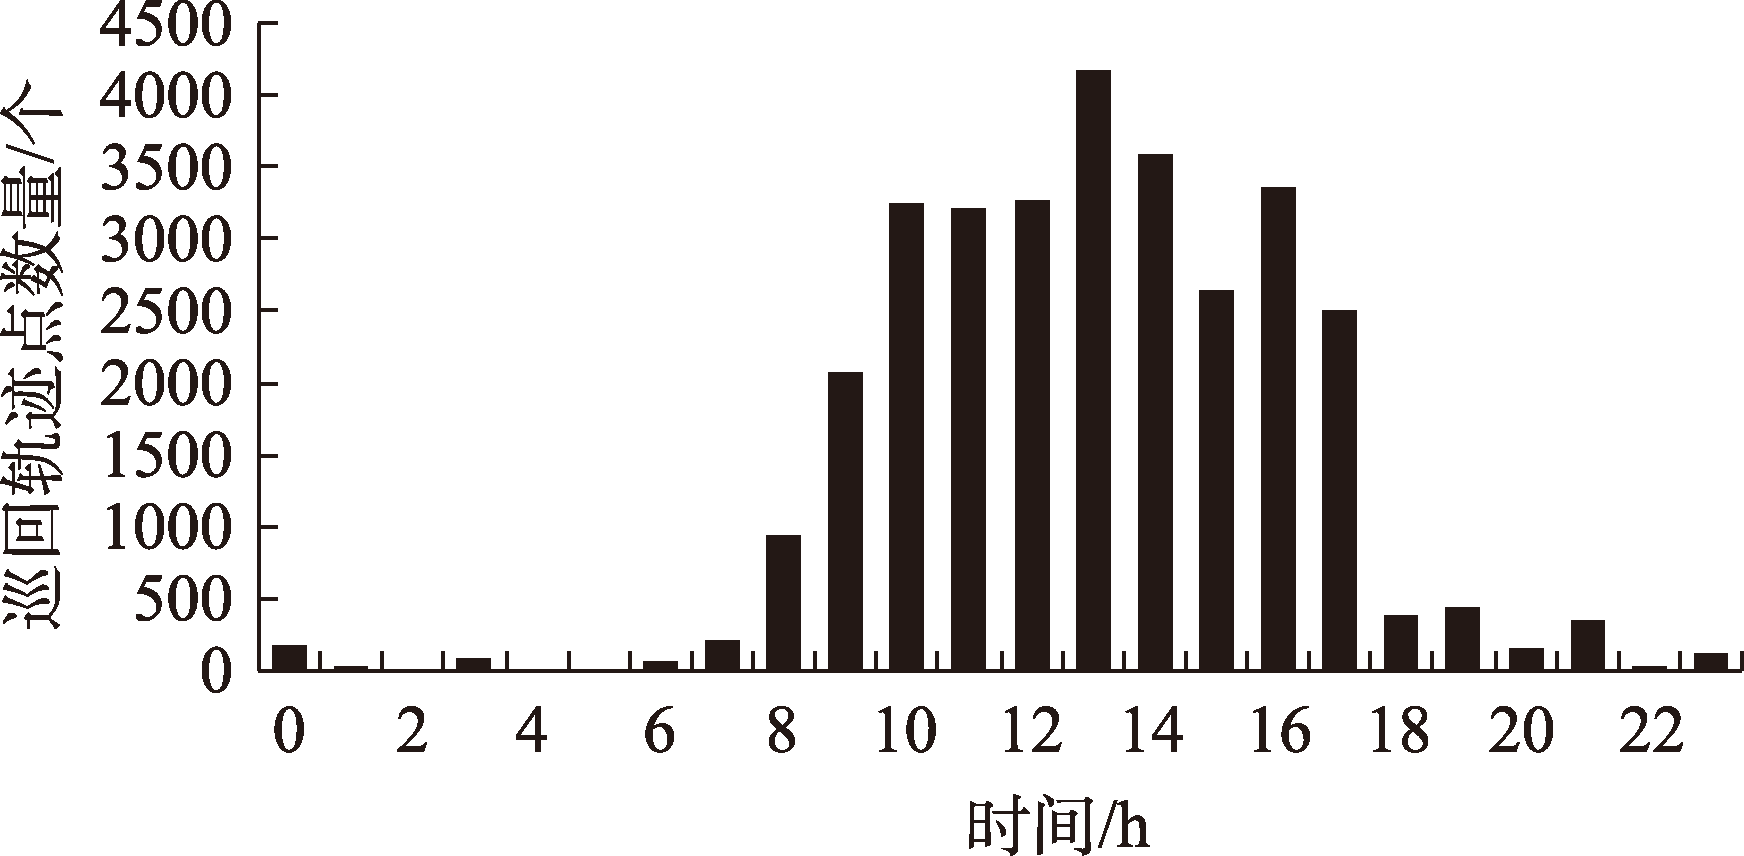
Figure 5
Distribution of number of patrol trajectory points at different times
Table 4
Distribution of total duration and total path length of all patrol trajectories in single operation
Table 5
Distribution of duration and path length of single patrol trajectory segments
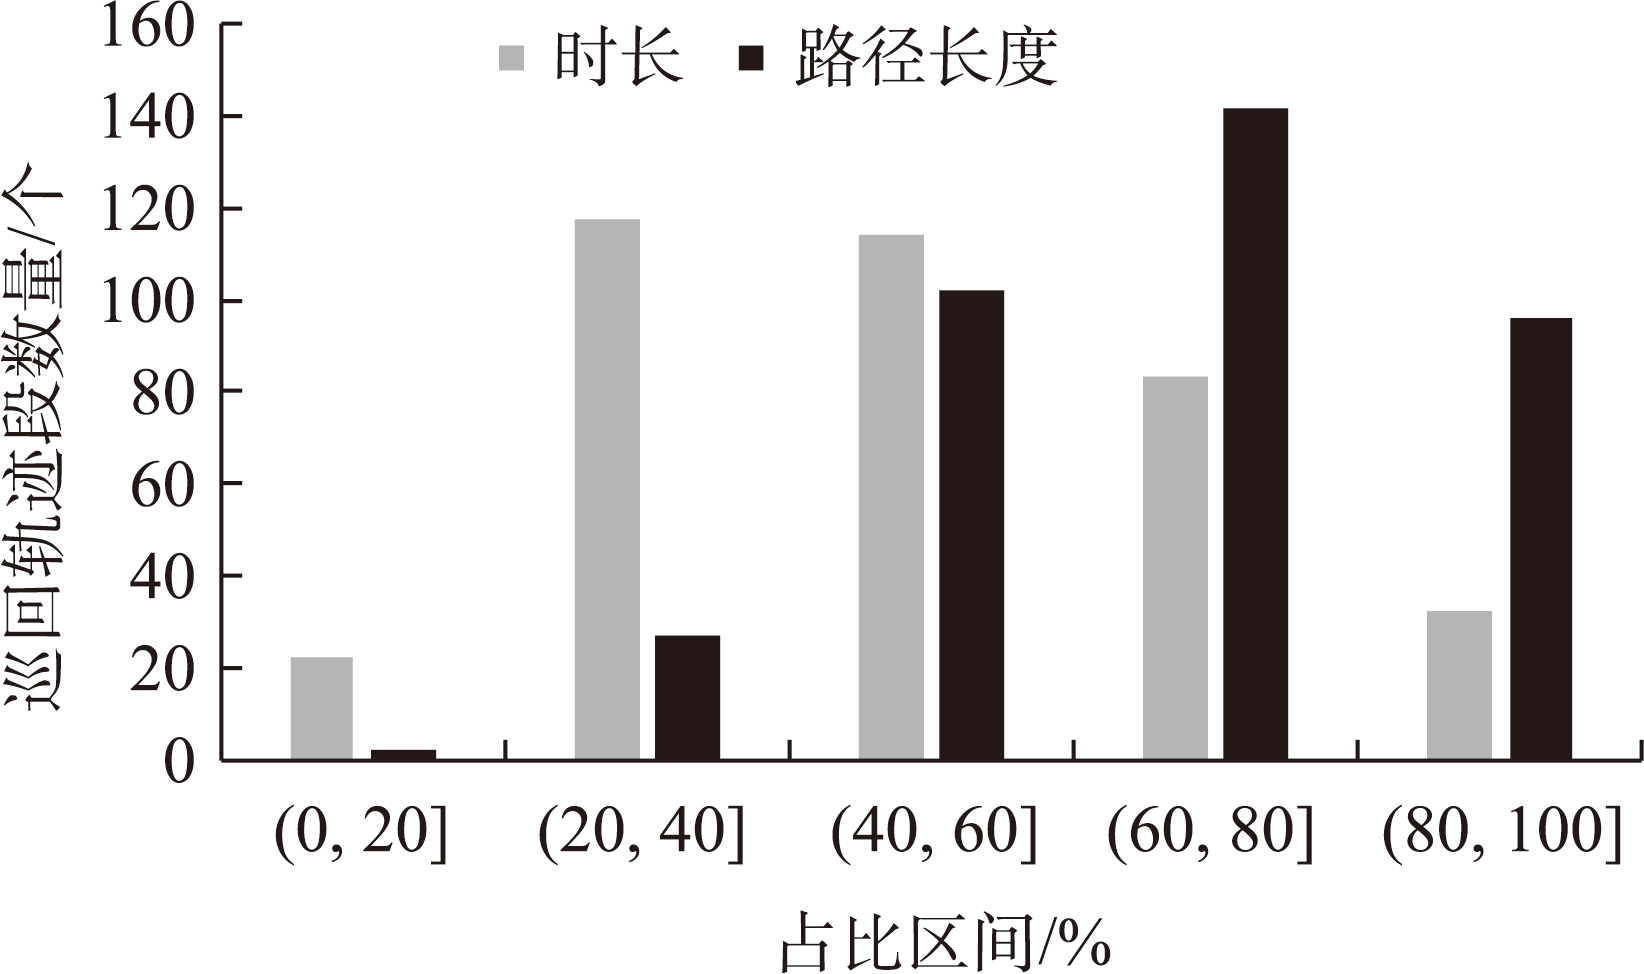
Figure 6
Proportional distribution of total patrol trajectory duration (path length) in total flight duration (path length)
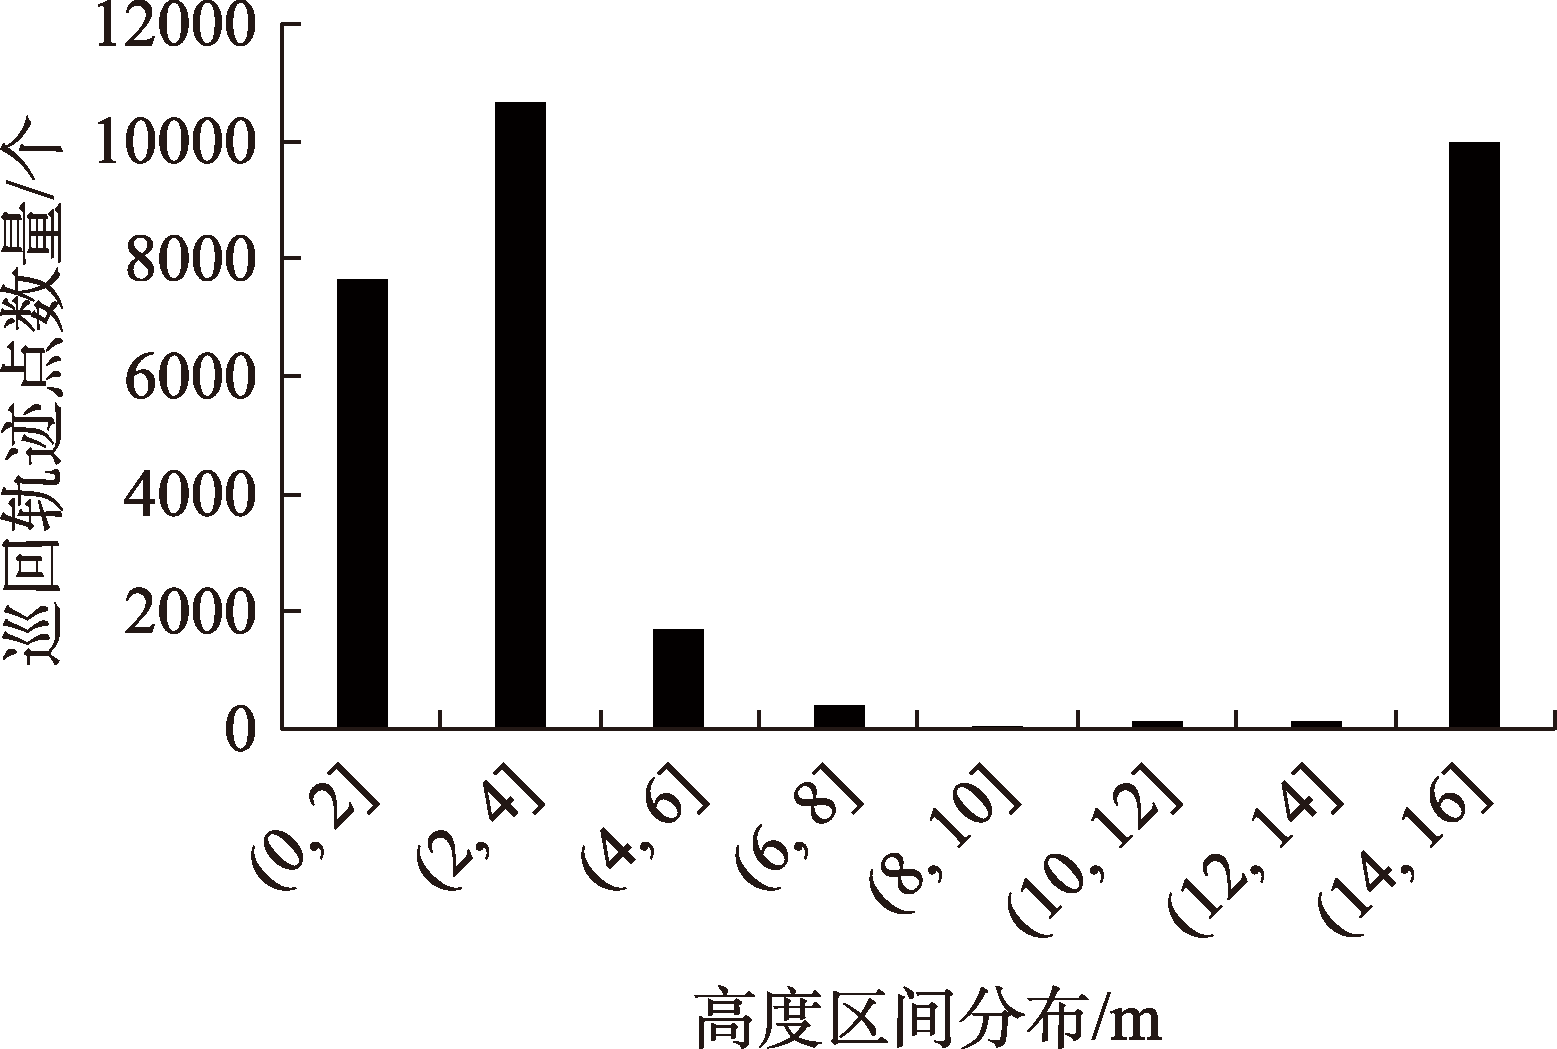
Figure 7
Altitude distribution of patrol trajectory points
Table 6
Proportion of trajectory points in different instantaneous speed intervals
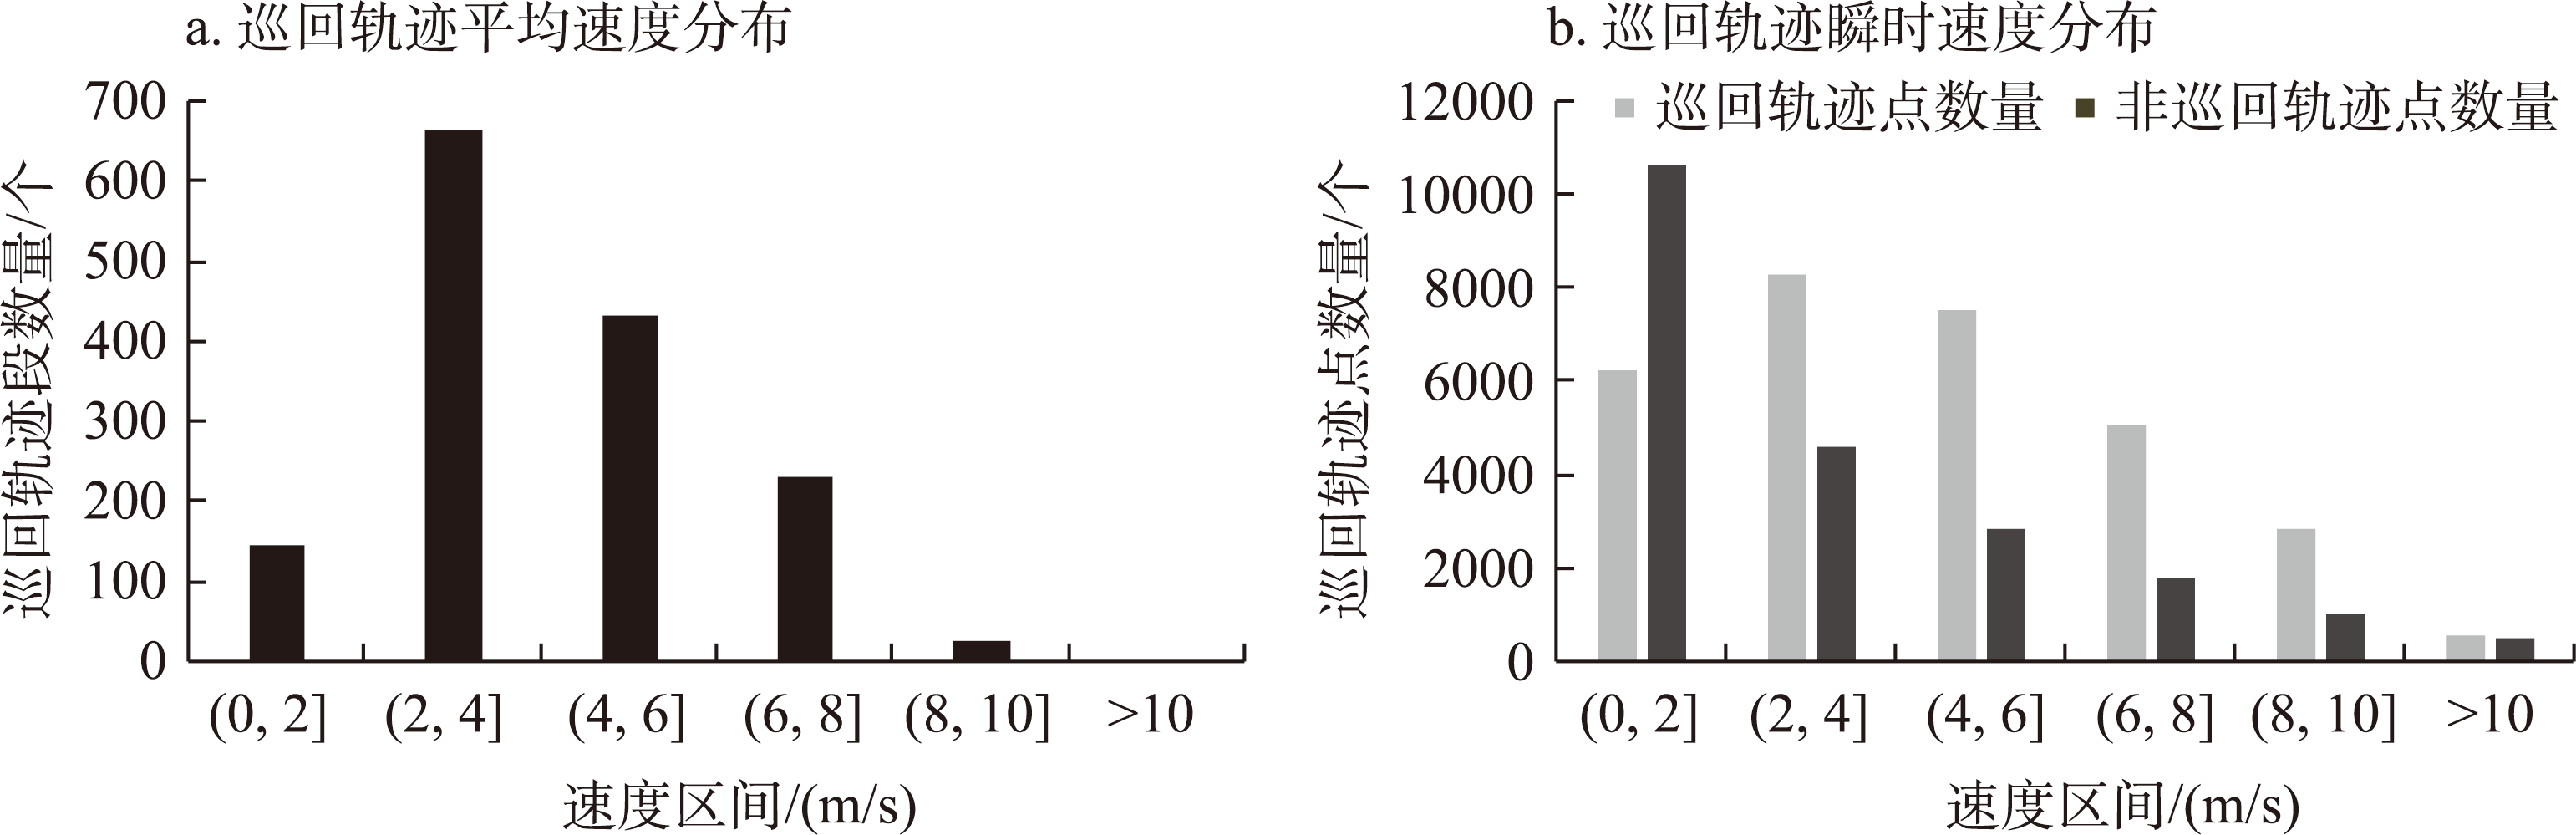
Figure 8
Speed distribution of patrol trajectories
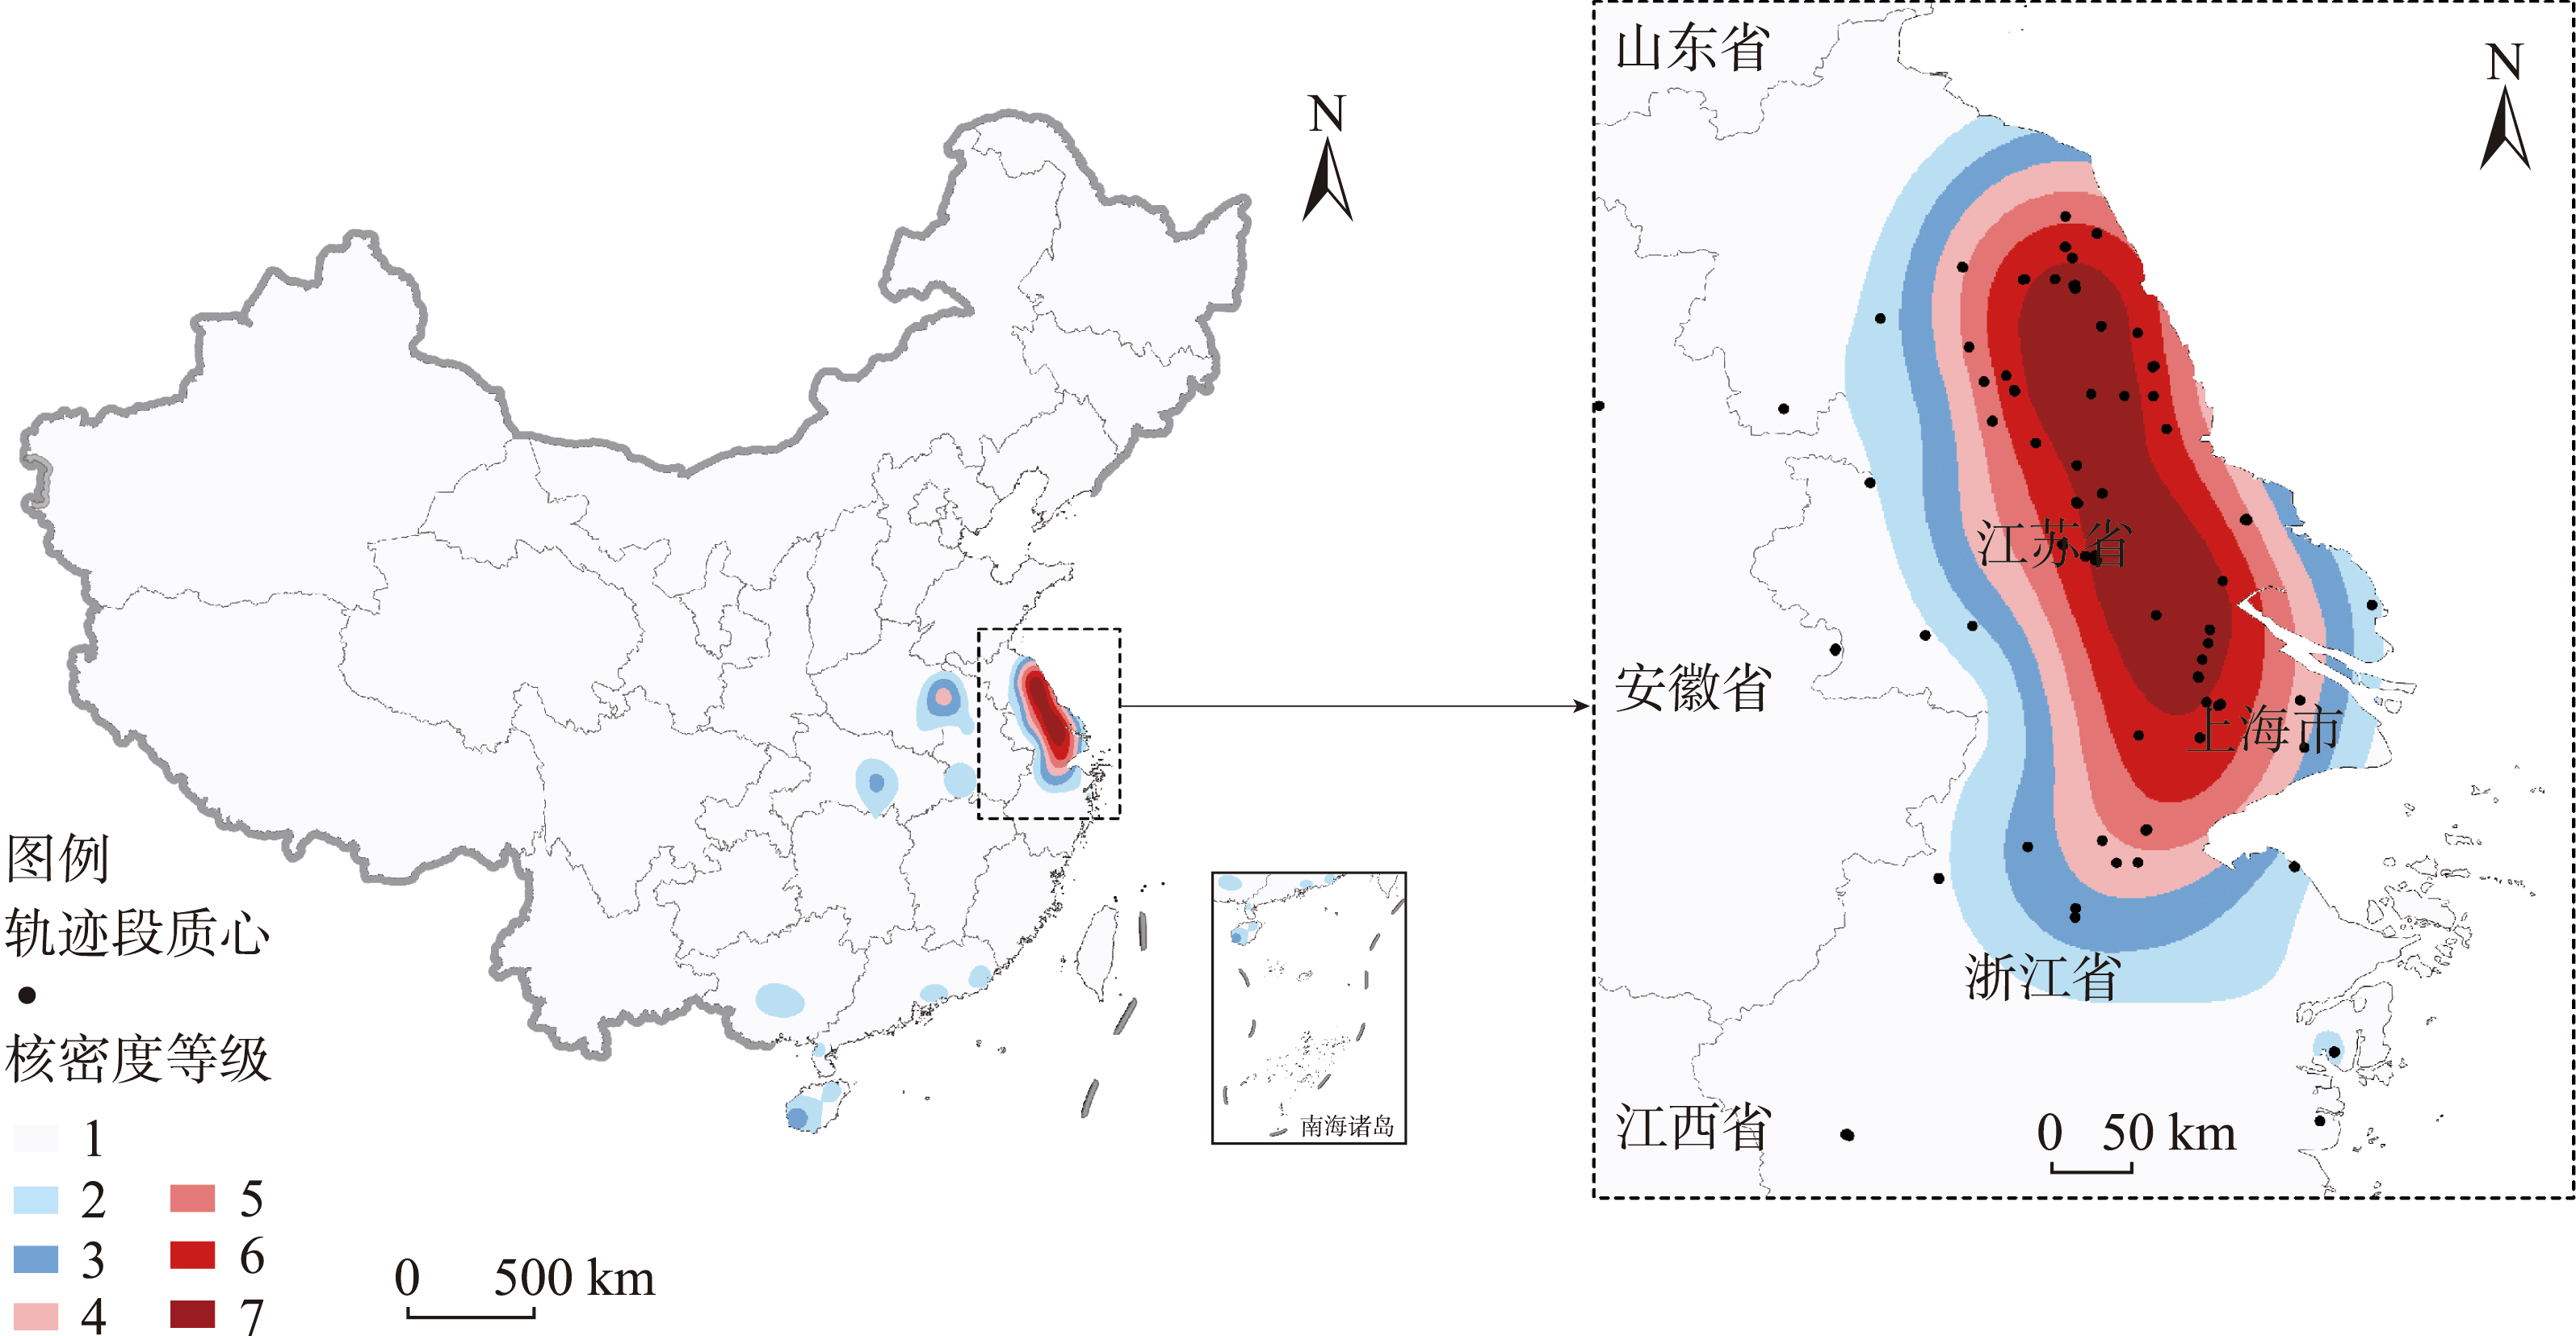
Figure 9
Distribution of kernel density centroids
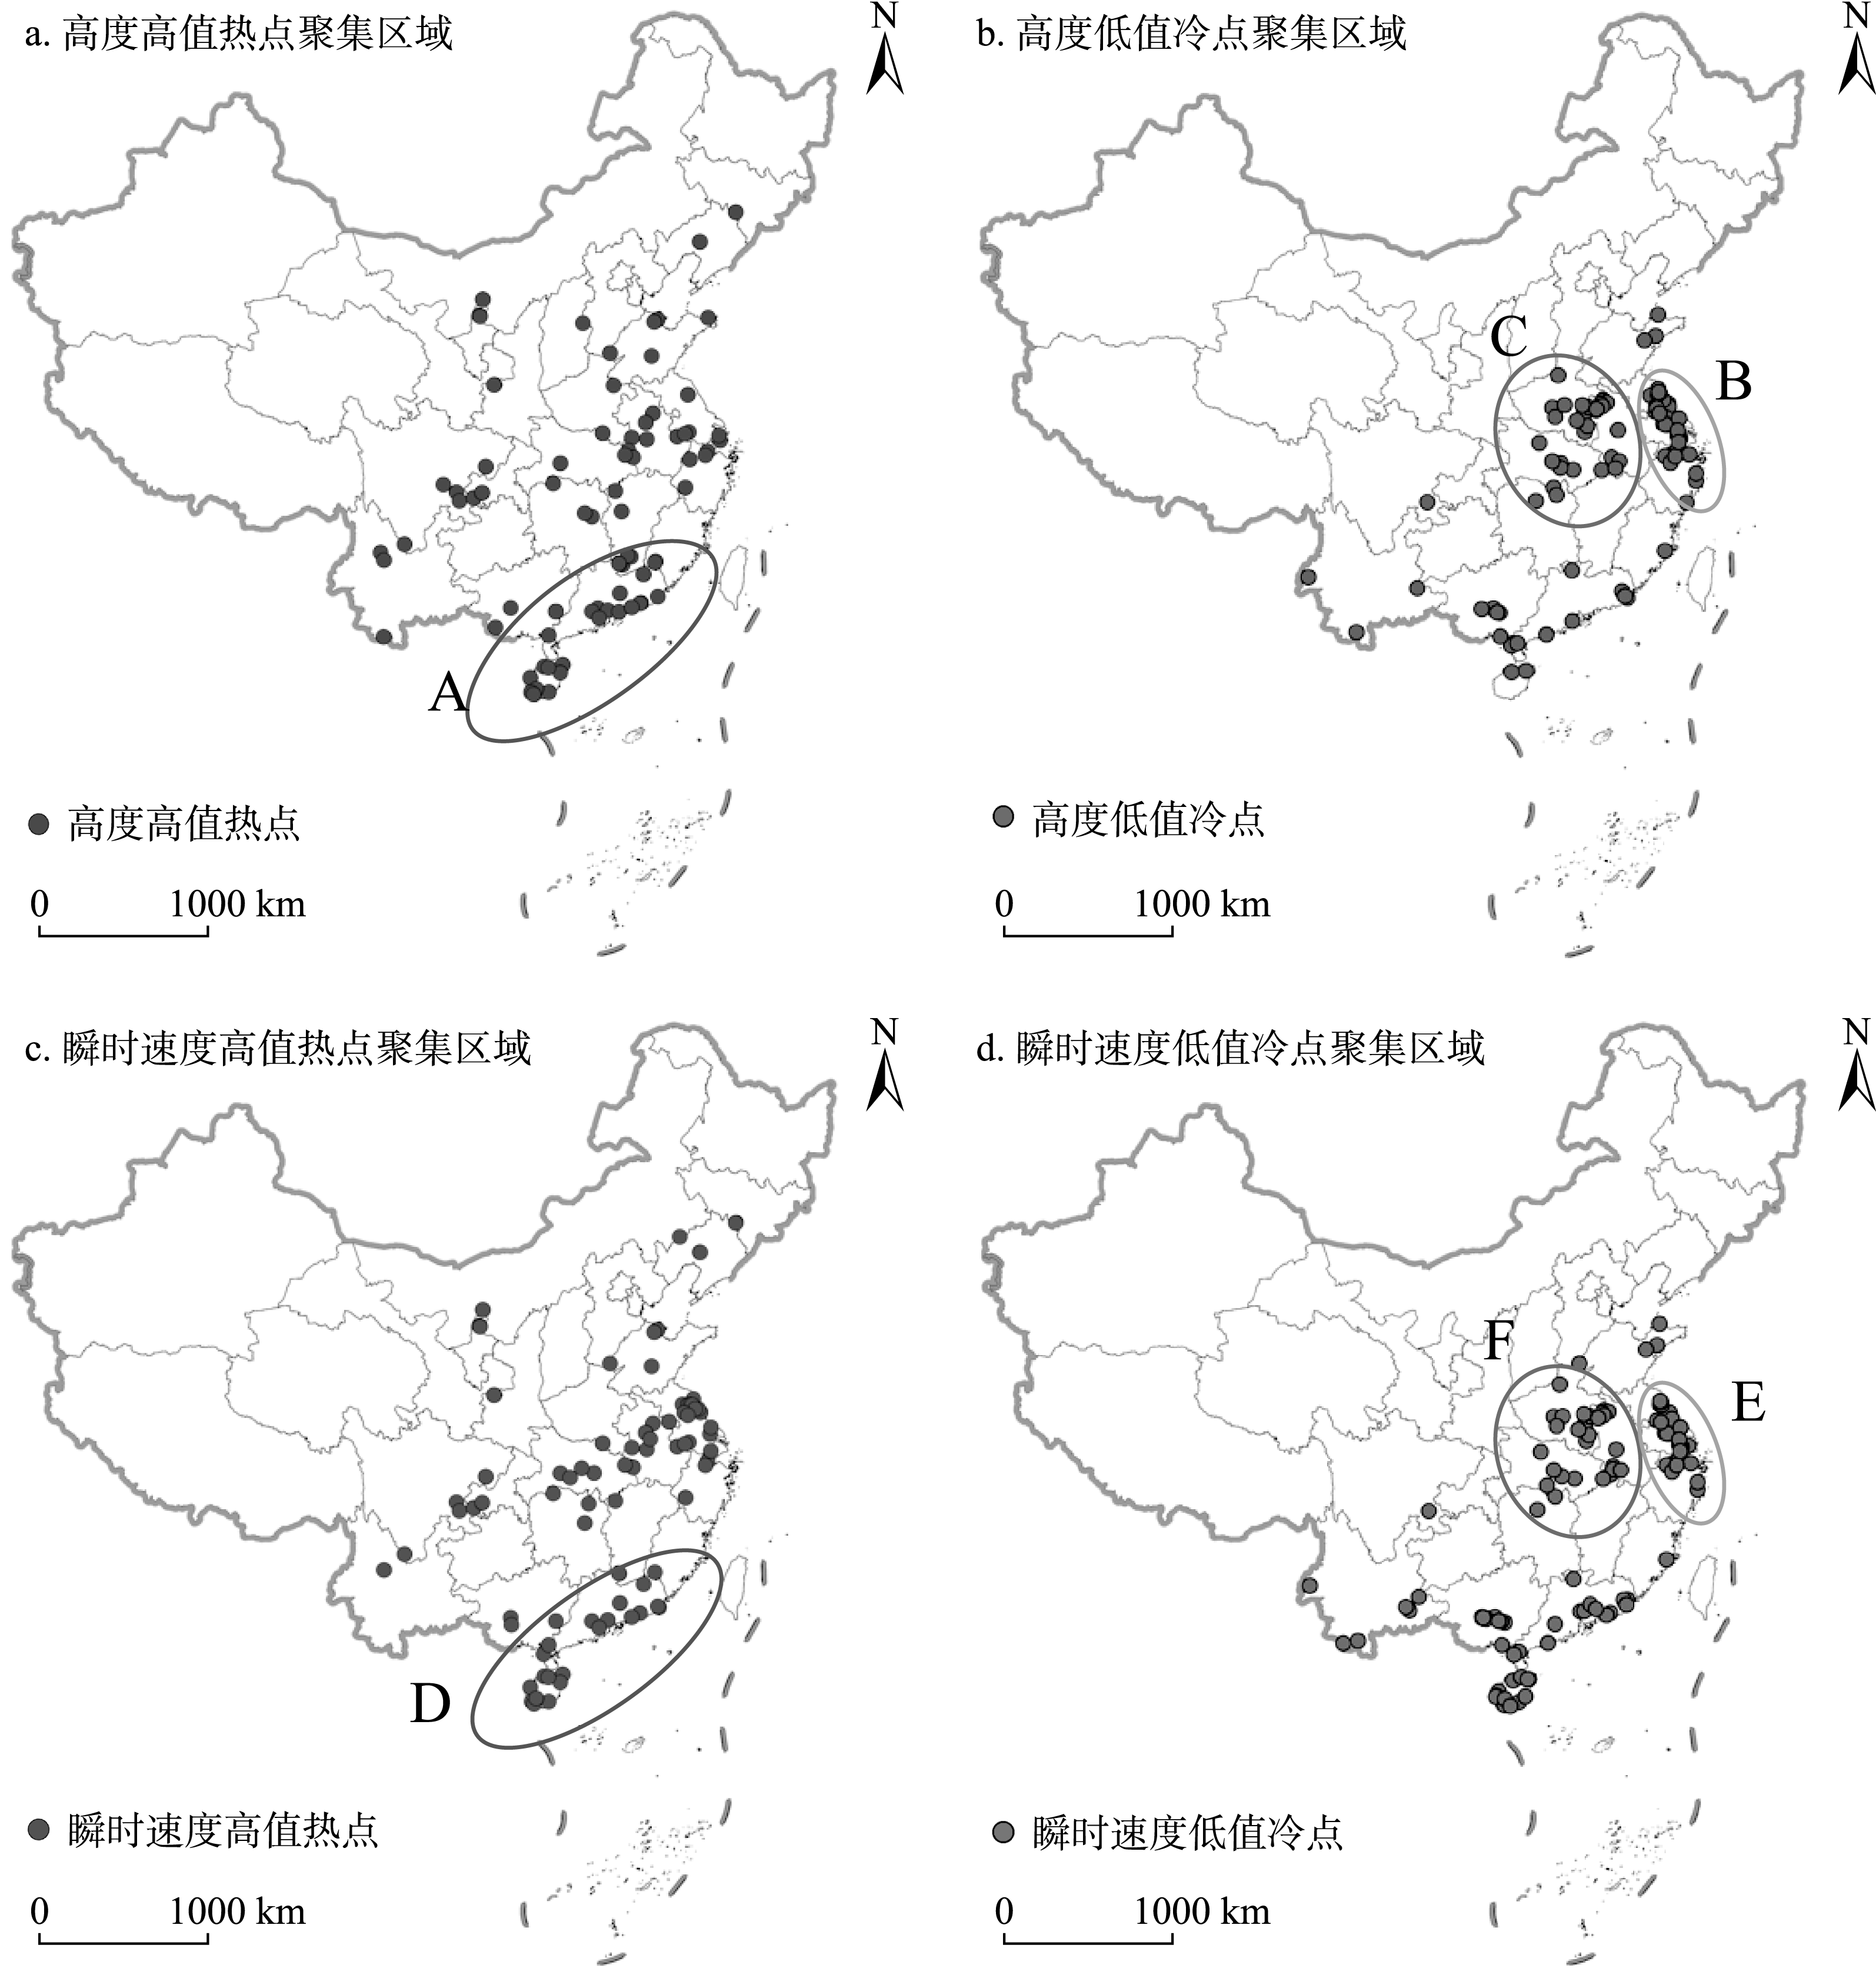
Figure 10
Spatial distribution of cold and hot spots of patrol trajectory points
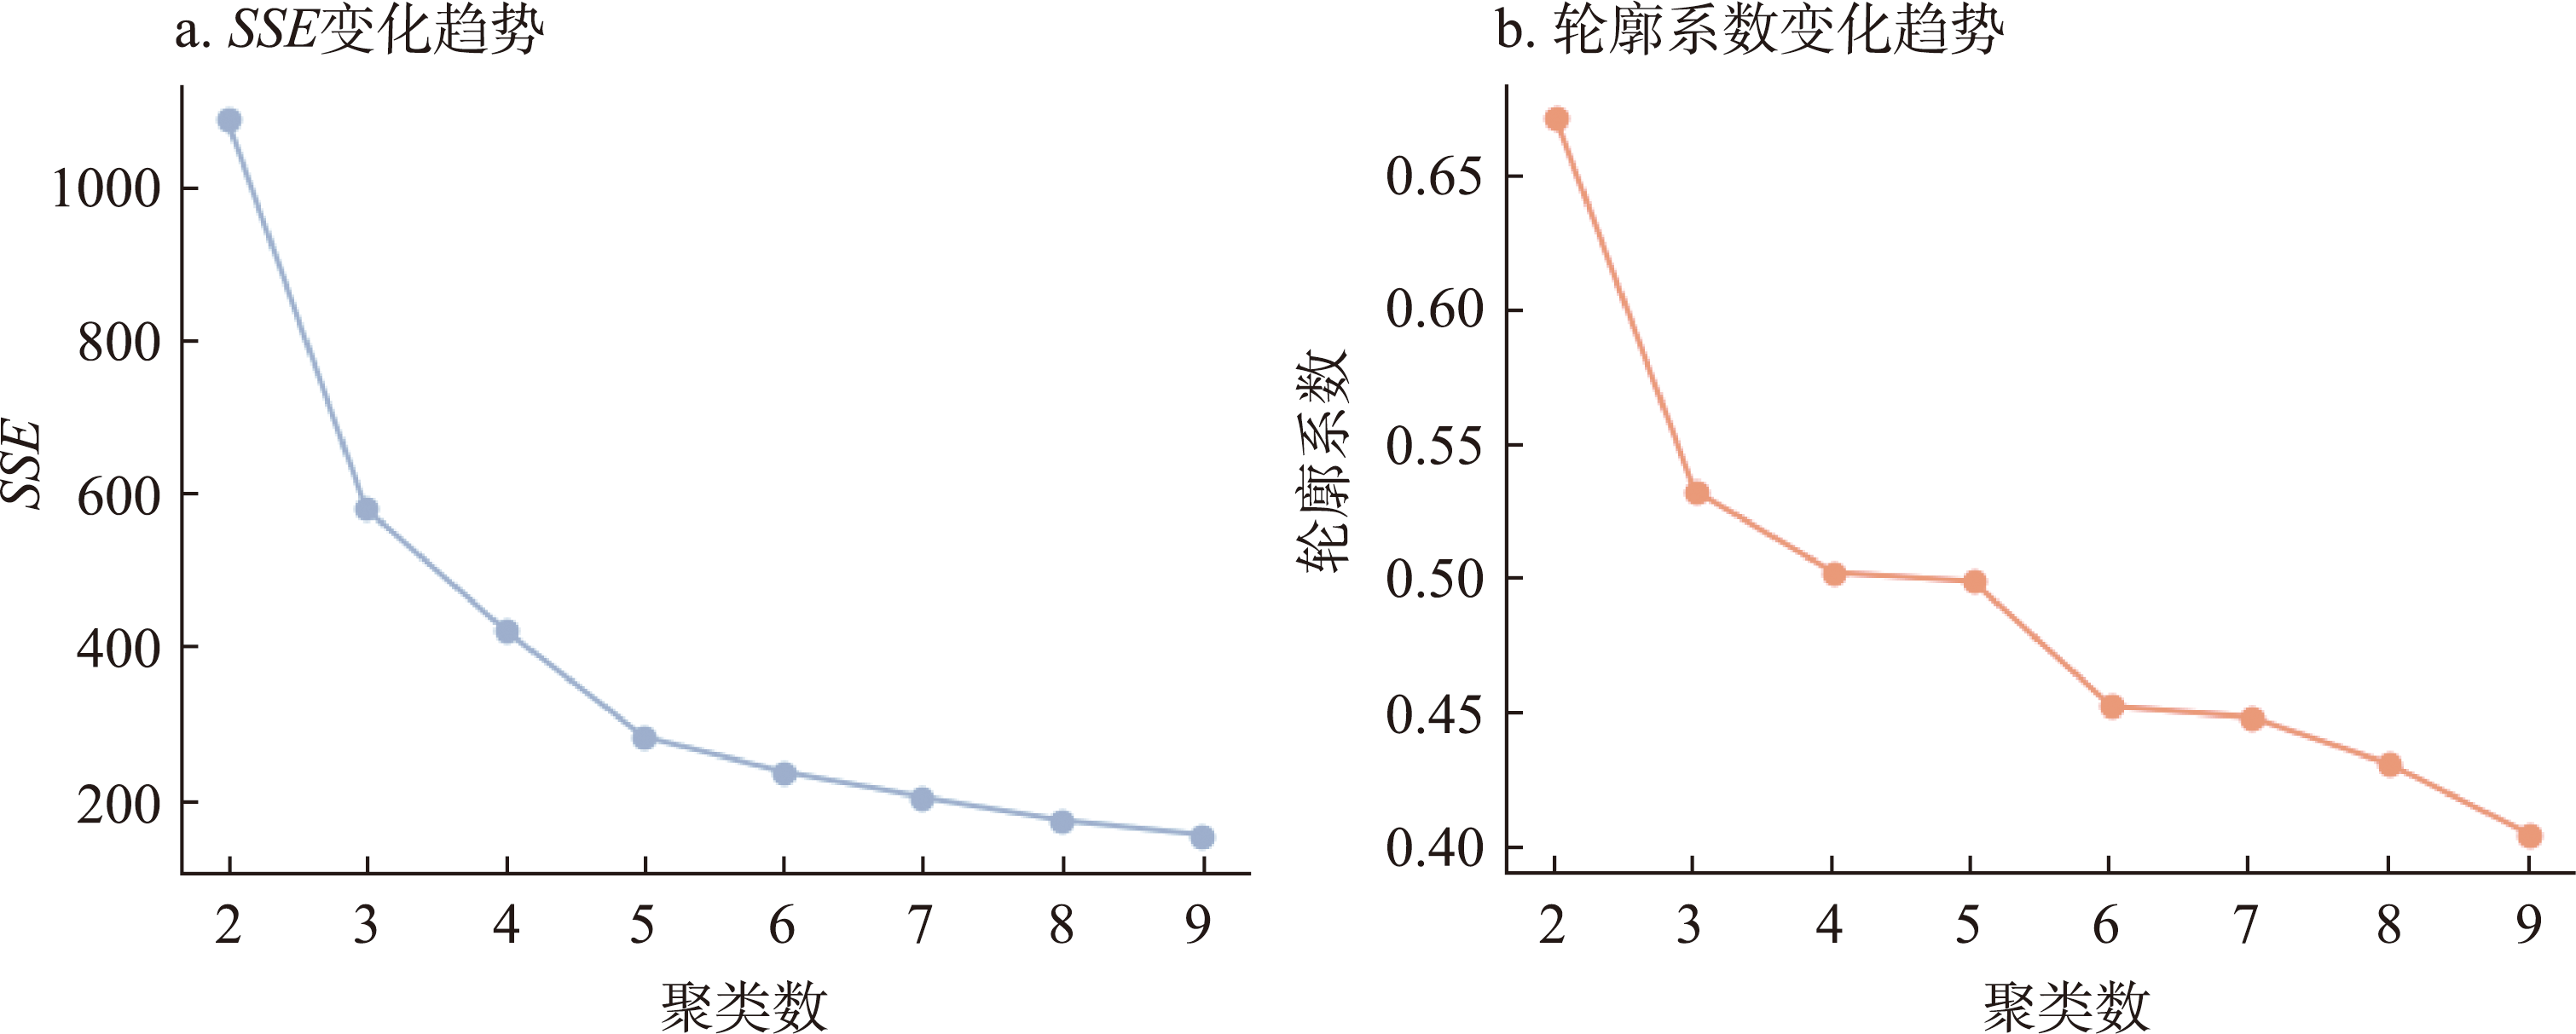
Figure 11
Results of elbow method and silhouette coefficient
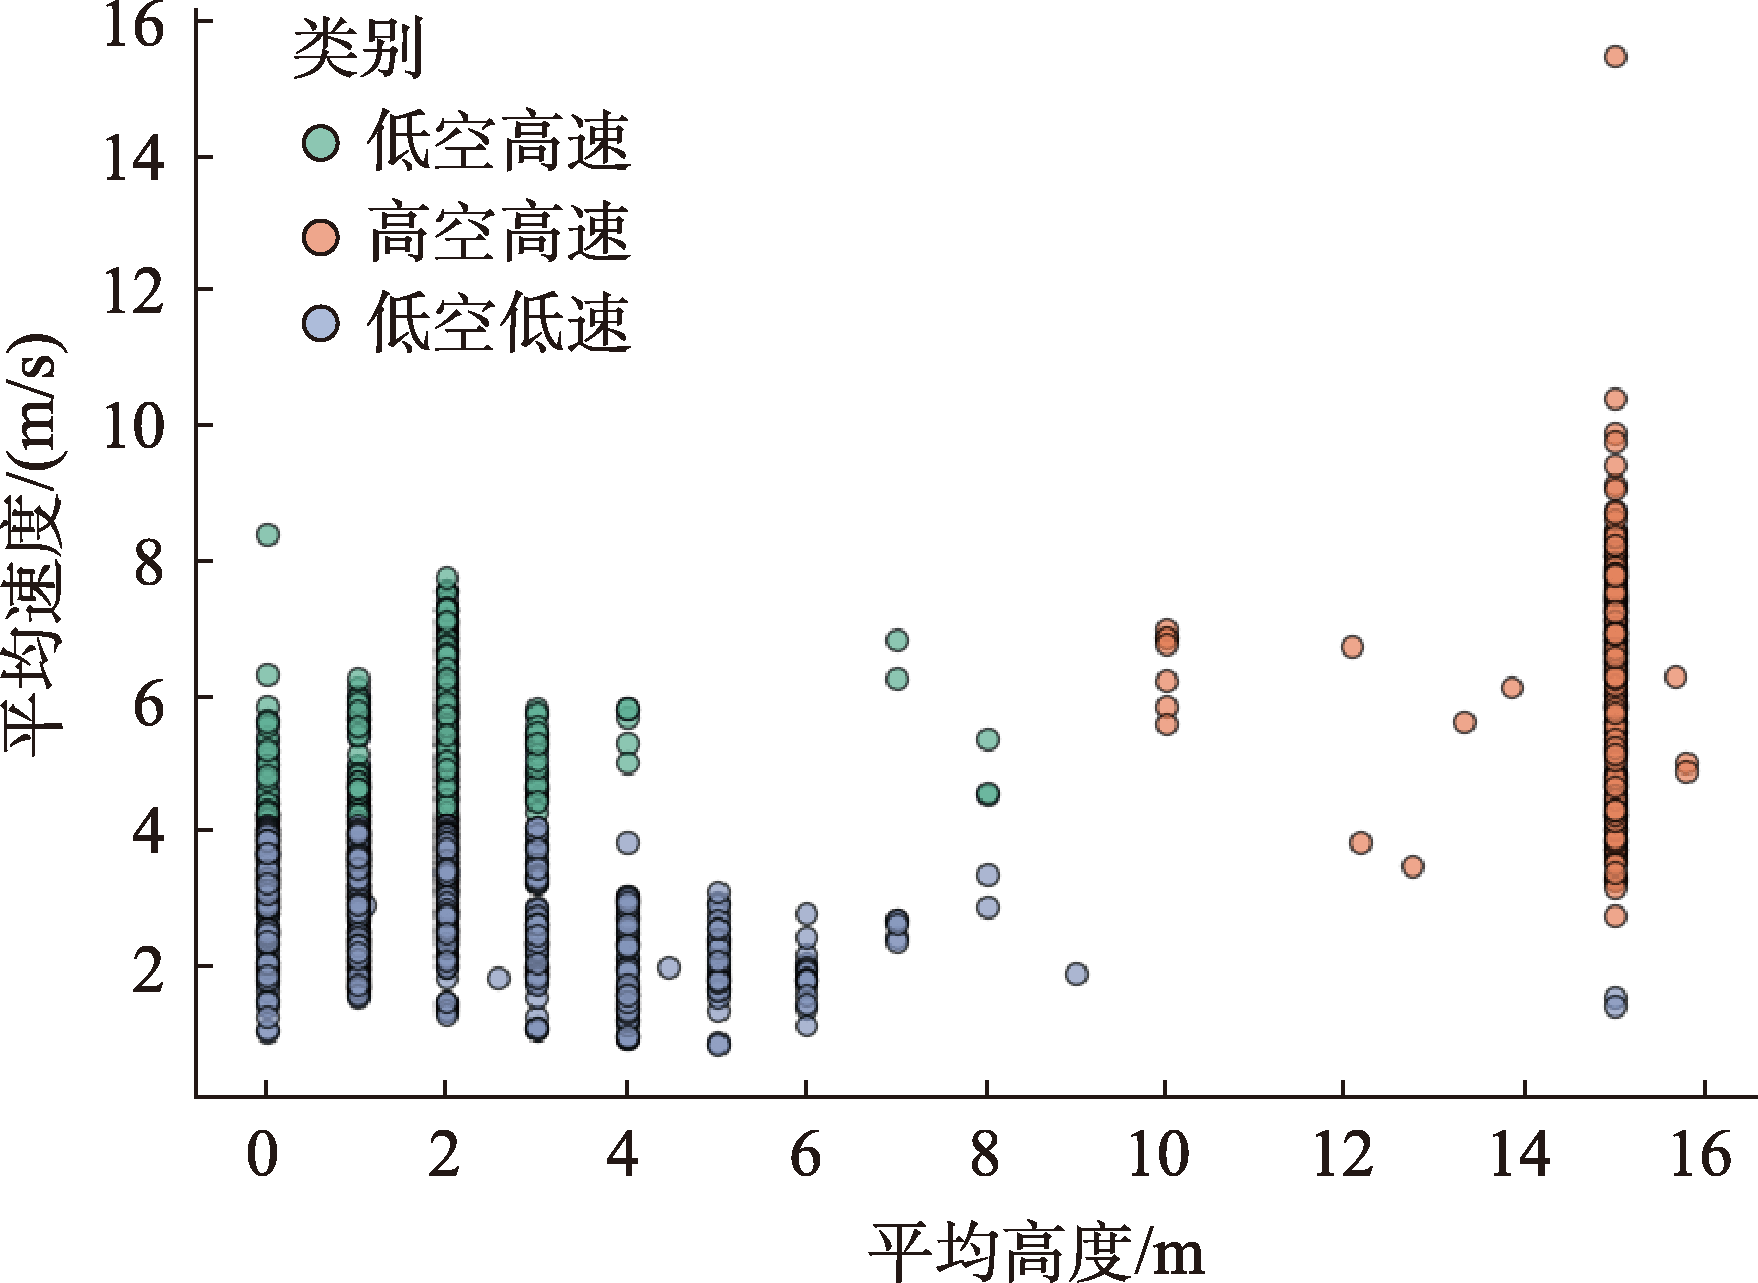
Figure 12
Scatter distribution of classification results
Table 8
Distribution of flight pattern quantities under different land types (units)