×
模态框(Modal)标题
在这里添加一些文本
Close
Close
Submit
Cancel
Confirm
×
模态框(Modal)标题
×
Journal
Article
Figure
Search
EN
中文
Home
About Journal
Overview
Indexing & Honors
Open Access
Editorial Board
Guide for Authors
Browse
Current Issue
Online First
Archive
Highlights
Topic
Archive by Subject
Most Viewed
Most Download
Most Cited
E-mail Alert
RSS
Subscribe
Advertisement
Contact us
EN
中文
Figure/Table detail
Multi-scenario simulation and spatial pattern optimization of supply and demand matching of ecosystem services in coal resource-based cities
MING Li, CHANG Jiang, LI Cheng
Resources Science
, 2024, 46(
10
): 2078-2091. DOI:
10.18402/resci.2024.10.13
数据名称
分辨率/m
数据来源
土地利用数据
30
中国科学院资源与环境科学数据中心
DEM数据
30
地理空间数据云
NDVI数据
30
国家生态科学数据中心
气象数据
1000
国家青藏高原科学数据中心
土壤数据
1000
国家青藏高原科学数据中心
社会经济数据
国家省市统计局、省市统计年鉴和水资源公报等
Table 1
Data sources
Other figure/table from this article
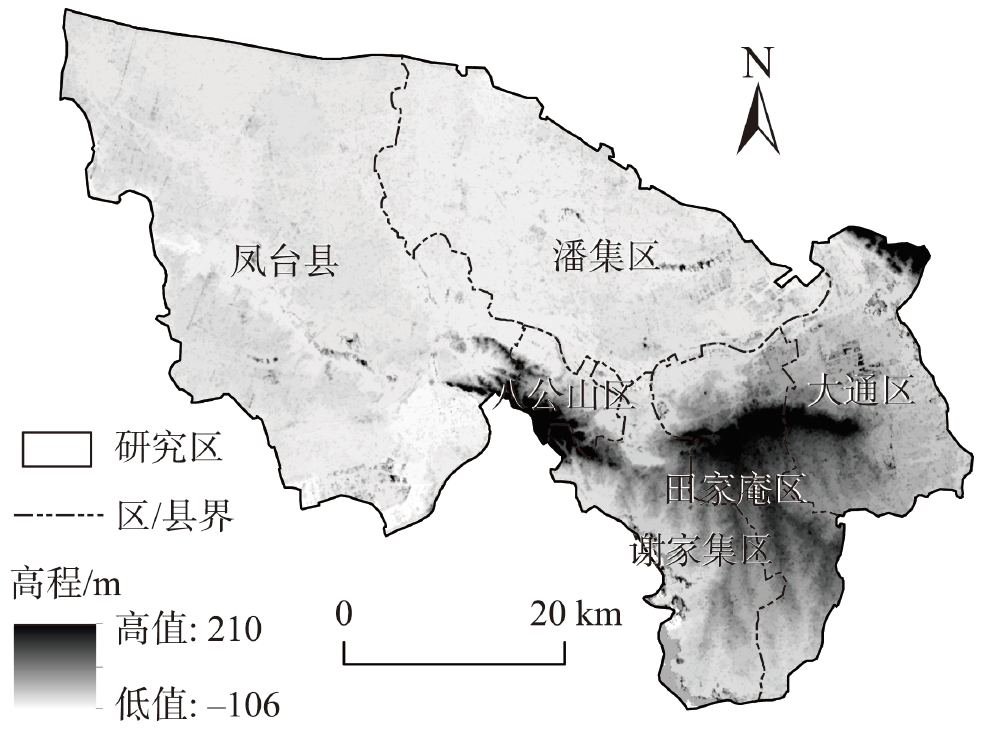
Figure 1
The study area
Table 2
Driving factors of the PLUS model
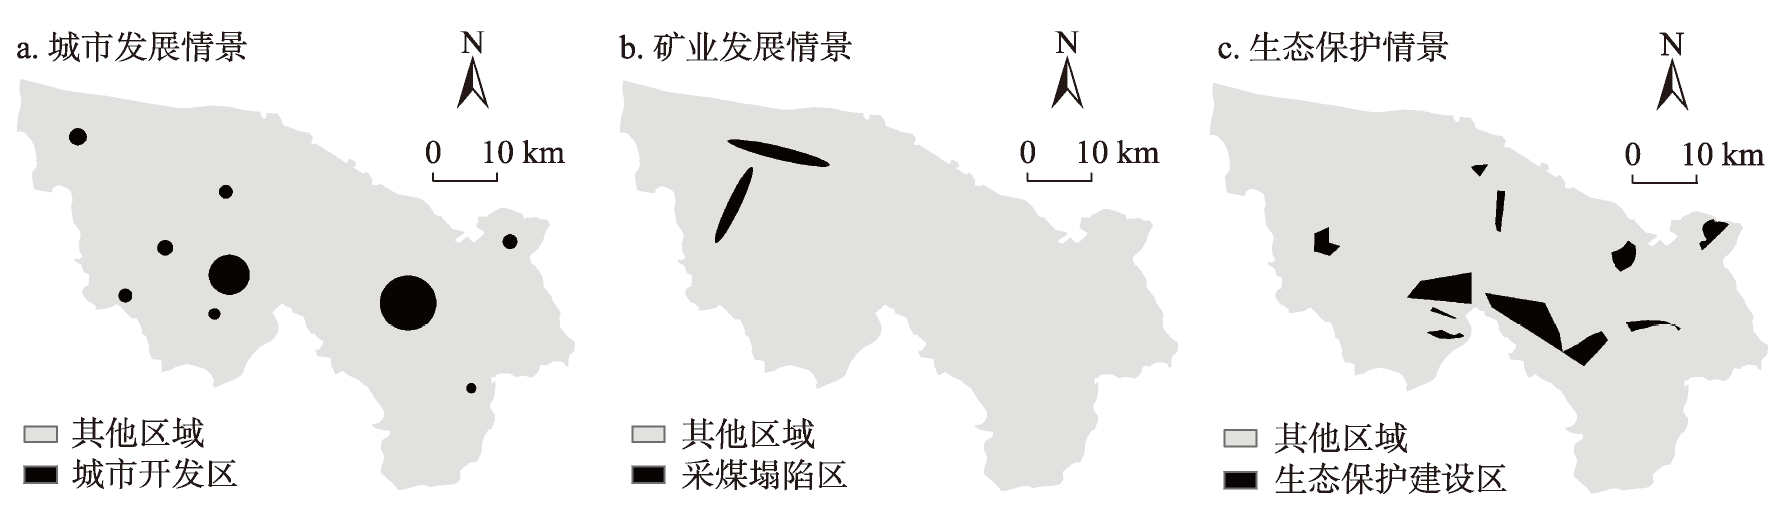
Figure 2
The setting of development zones under different development scenarios
Table 3
Different land use types’ neighborhood indicators of Huainan City under four development scenarios
Figure 3
Spatial distribution of supply-demand matching of ecosystem services in Huainan City, 2020
Table 4
Areal comparison of land use types under four development scenarios in Huainan City, 2035 (km
2
)
Figure 4
Land use probability maps under four development scenarios of Huainan City, 2035
Figure 5
Supply-demand patterns of six ecosystem services and comprehensive service under four different development scenarios, 2035
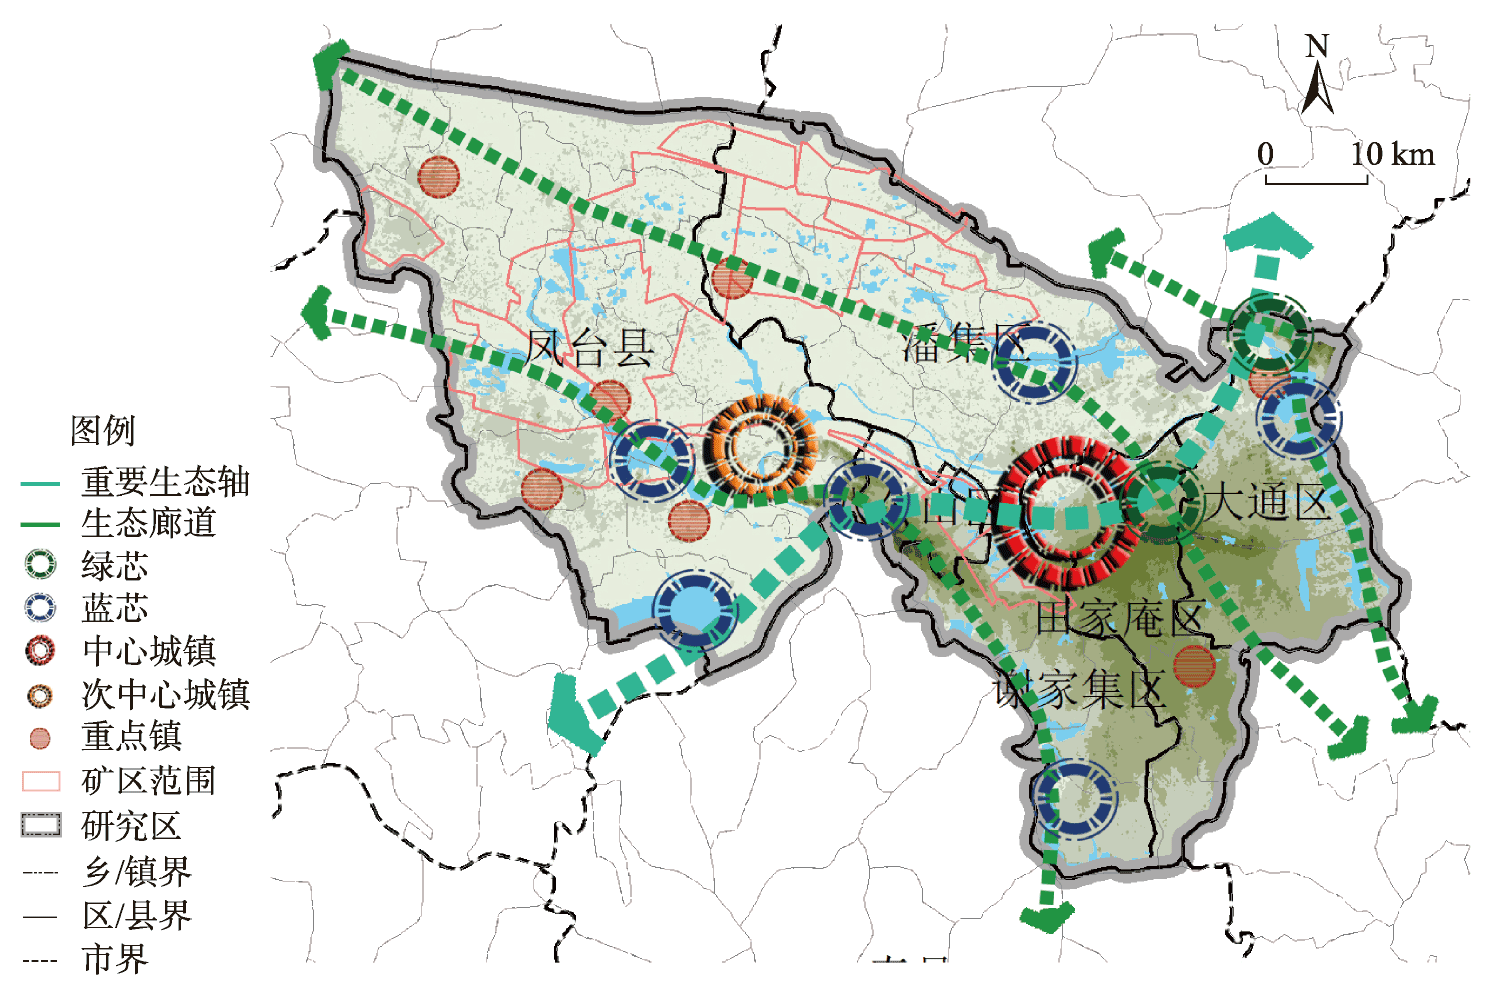
Figure 6
Ecological protection and urban development patterns of Huainan City based on the supply-demand of ecosystem services