×
模态框(Modal)标题
在这里添加一些文本
Close
Close
Submit
Cancel
Confirm
×
模态框(Modal)标题
×
Journal
Article
Figure
Search
EN
中文
Home
About Journal
Overview
Indexing & Honors
Open Access
Editorial Board
Guide for Authors
Browse
Current Issue
Online First
Archive
Highlights
Topic
Archive by Subject
Most Viewed
Most Download
Most Cited
E-mail Alert
RSS
Subscribe
Advertisement
Contact us
EN
中文
Figure/Table detail
Dynamic characteristics and differentiation of construction land supply in shrinking small and medium-sized cities
ZHOU Zhen, CHEN Hao, WANG Lei
Resources Science
, 2024, 46(
2
): 321-335. DOI:
10.18402/resci.2024.02.07
特征量
计算公式
变量含义
绝对量
A
Q
F
i
=
∑
t
=
1
T
S
i
,
t
T
式中:
AQF
i
为城市样本
i
在研究期的绝对水平;
S
i
,
t
为样本
i
在年份
t
的取值;
T
为年份跨度
趋势
T
F
i
=
∑
t
=
1
T
S
i
,
t
-
S
t
¯
t
-
T
2
∑
t
=
1
T
t
-
T
2
2
式中:
TF
i
为样本
i
在研究期指标的长期变动趋势;
S
t
¯
为样本
i
在
T
年间的平均值
波动性
V
F
i
=
∑
t
=
1
T
S
i
,
t
-
S
t
¯
2
T
-
1
X
t
¯
=
∑
t
=
1
T
S
i
,
t
T
式中:
VF
i
为样本
i
在研究期指标随时间变化的波动程度
偏度
S
C
F
i
=
∑
t
=
1
T
S
i
,
t
-
S
t
¯
3
T
σ
i
3
σ
i
=
∑
t
=
1
T
S
i
,
t
-
S
t
¯
2
T
式中:
SCF
i
为样本
i
在研究期指标的对称性;
σ
i
为样本
i
在
T
年间的年际标准差
峰度
K
C
F
i
=
∑
t
=
1
T
S
i
,
t
-
S
t
¯
4
T
σ
i
4
-
3
式中:
KCF
i
为样本
i
在研究期分布曲线的陡峭程度
Table 2
Temporal feature extraction
Other figure/table from this article
Table 1
List of shrinking small and medium-sized cities
Table 3
Influencing factors of construction land supply in shrinking small and medium-sized cities
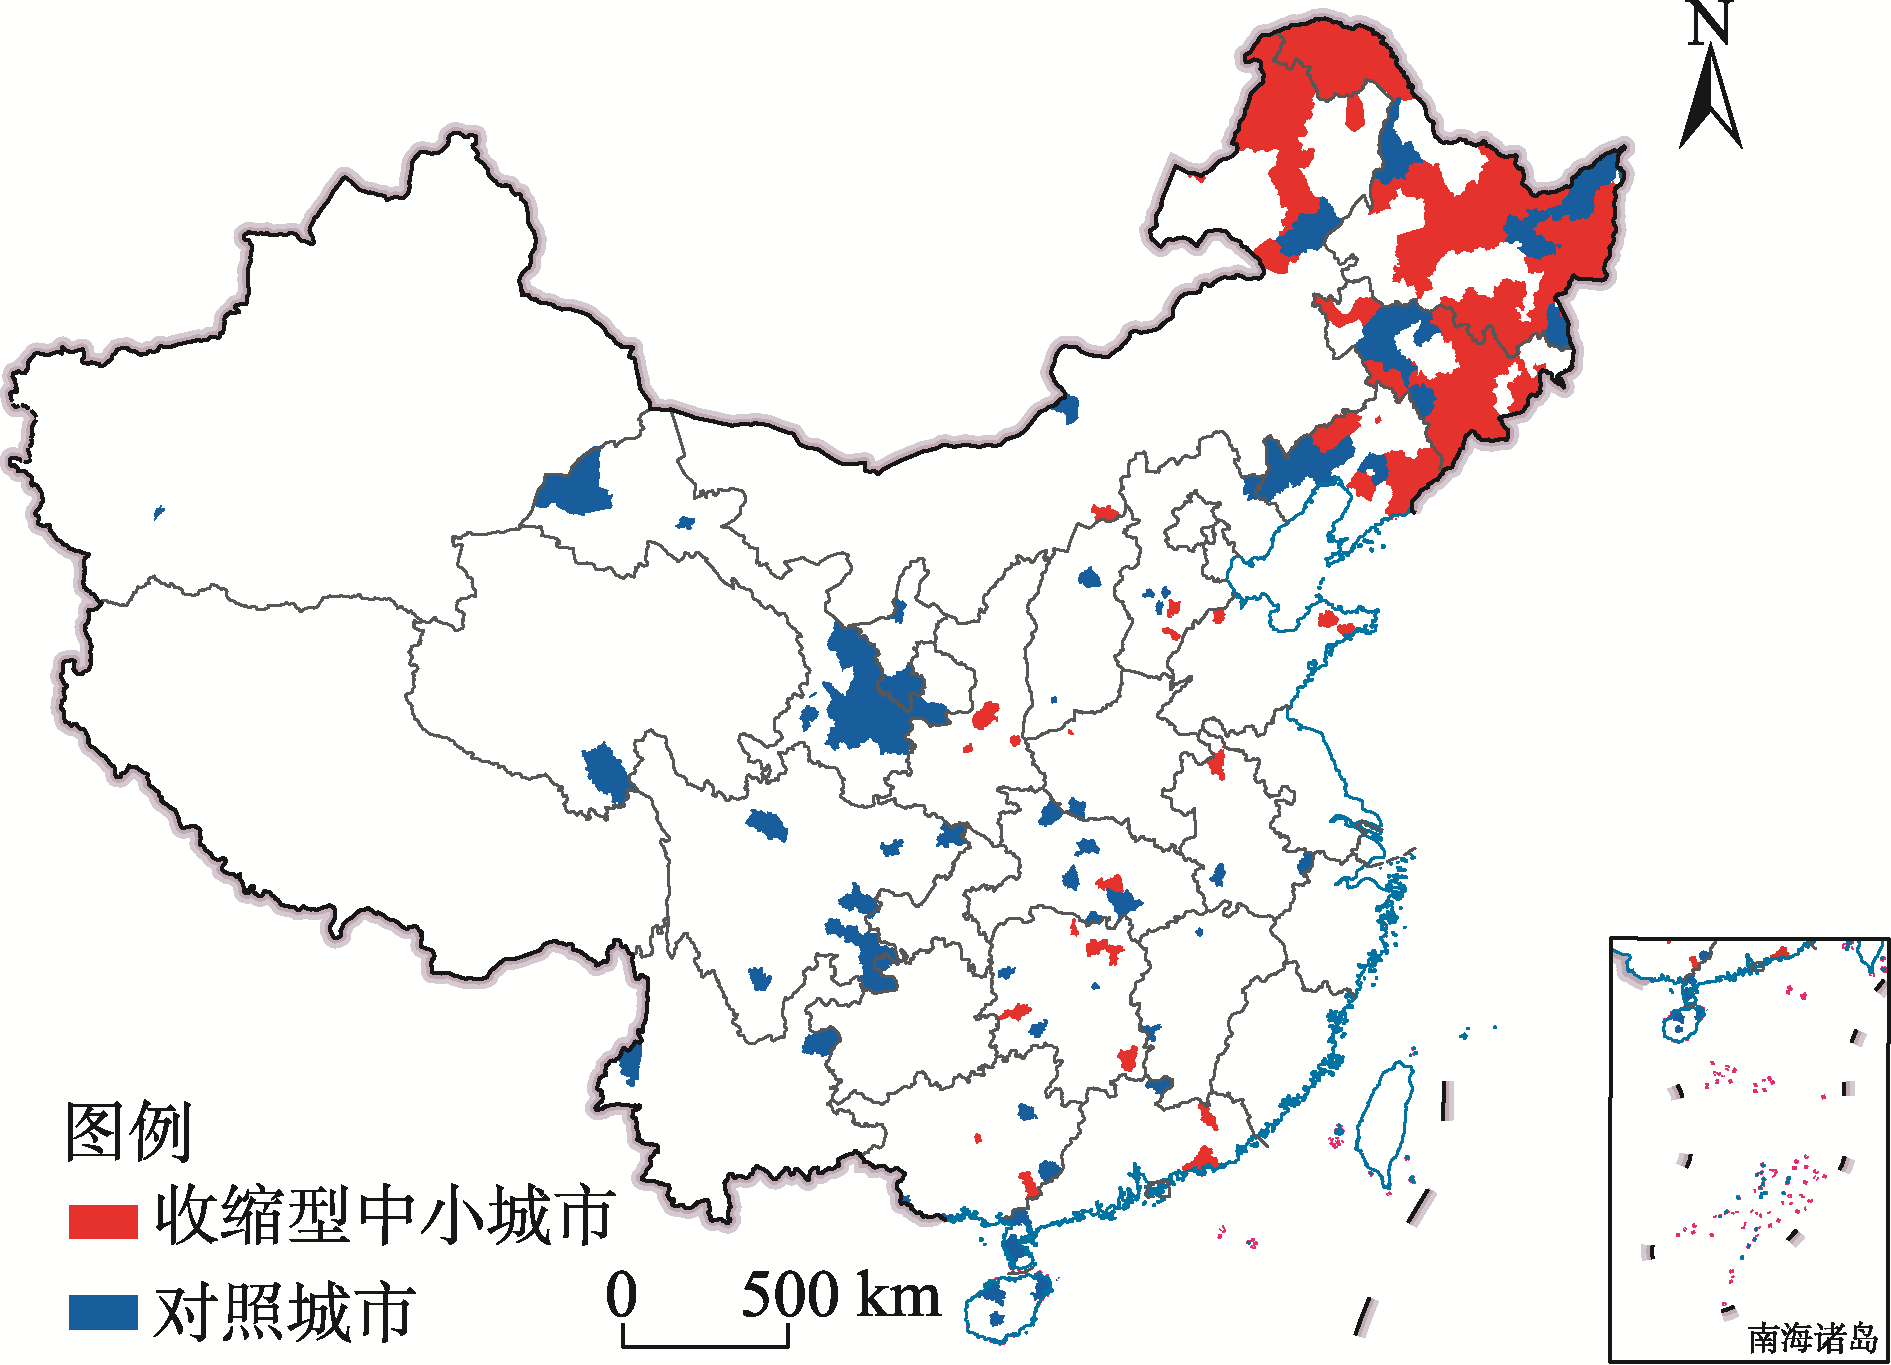
Figure 1
Distribution of shrinking small and medium-sized cities and reference cities
Table 4
Balance test of propensity score matching
Table 5
Dynamic and static characteristics of land supply indicators of shrinking small and medium-sized cities and reference cities, 2010-2020
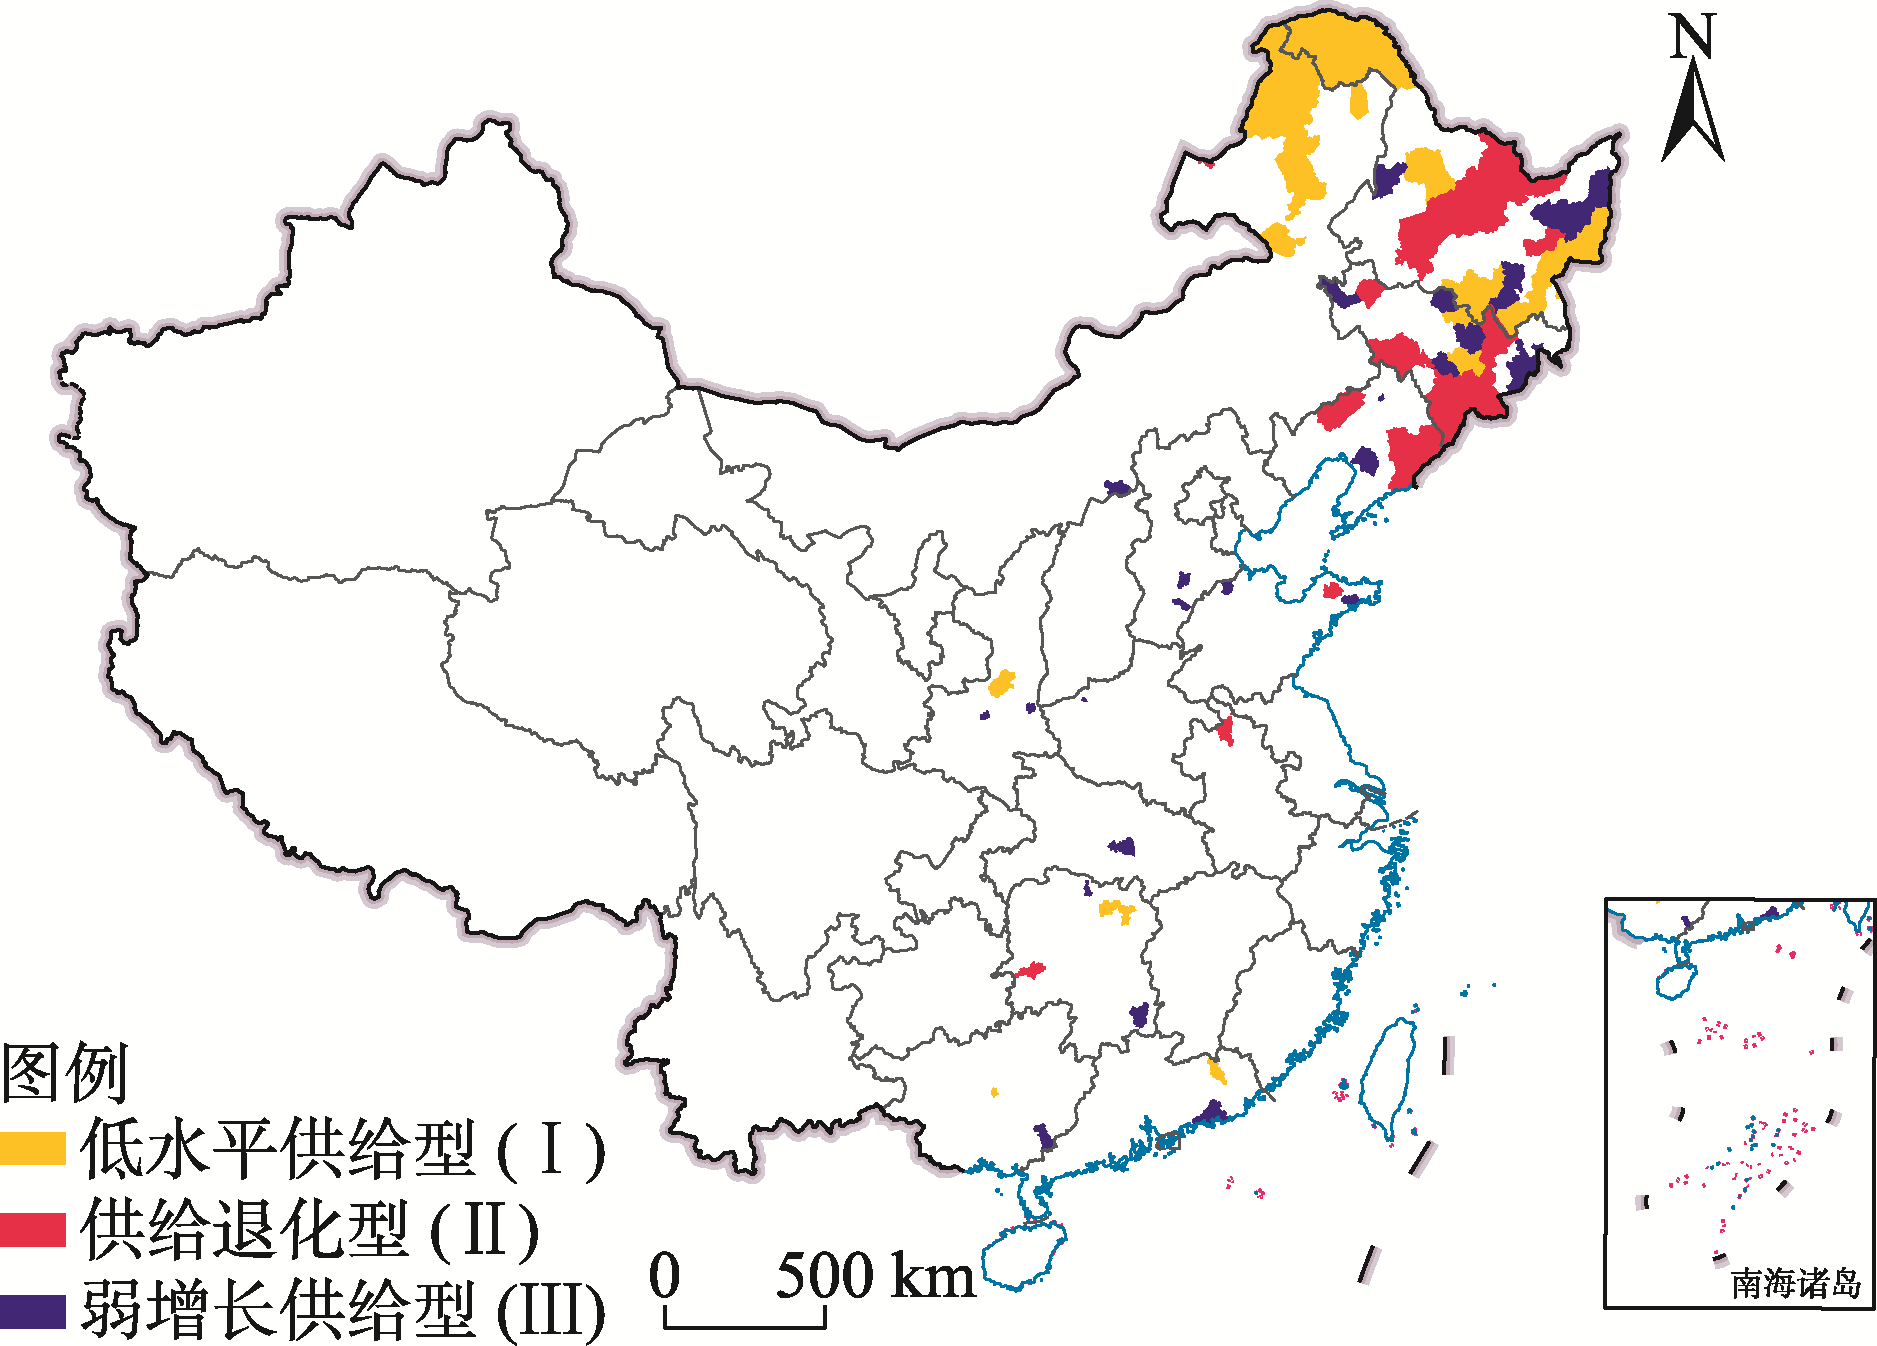
Figure 2
Panel clustering results
Table 6
Comparison of construction land supply indicators of three types of shrinking small and medium-sized cities
Table 7
Fundamentals of three types of cities
Table 8
Logistic regression parameter estimation results of inter-group difference
Table 9
Logistic regression parameter estimation results of intra-group difference