
Dynamic benchmark setting for steel industry from the perspective of stable expansion of carbon market:Based on survey data from steel enterprises in Shanxi Province
Received date: 2024-03-23
Revised date: 2024-09-13
Online published: 2025-05-12
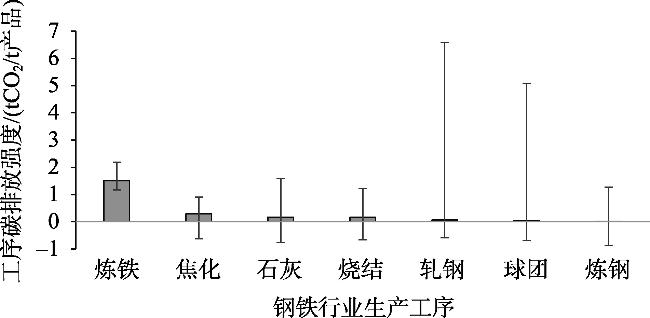
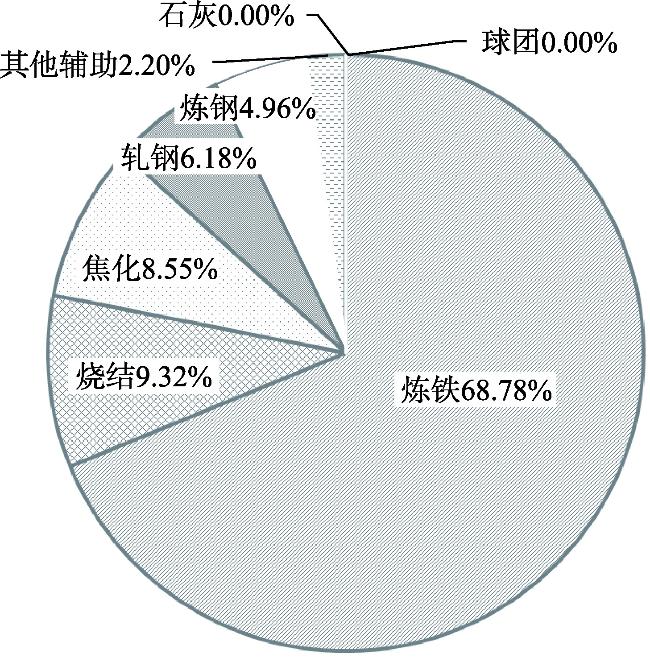
[Objective] Conducting research on dynamic methodologies for setting carbon allowance benchmarks in the steel industry and scientifically allocating initial allowances in the carbon market are of significant theoretical and practical importance. These efforts are critical for the stable expansion of the national carbon market and for effectively addressing challenges such as the Carbon Border Adjustment Mechanism (CBAM). [Methods] Based on survey data from 47 steel enterprises in Shanxi Province, this study employed a multi-scenario simulation method, including four scenarios: stable carbon market expansion, moderate emission reduction, planned emission reduction, and enhanced emission reduction. This study calculated the industry benchmark value for 2020 and evaluated the compliance pressure of enterprises. The marginal abatement cost curve (MACC) was utilized to analyze the technological emission reduction costs under different scenarios. Furthermore, a horizontal comparative analysis method was applied, revealing the differentiated characteristics of scenario-based benchmarks compared to the EU carbon market benchmark and their potential impact on the steel industry. [Results] (1) There were significant differences in carbon emission intensities across various processes in the iron and steel industry. The ironmaking process exhibited the highest carbon emission intensity, accounting for more than 65% of total corporate emissions. (2) When allocating carbon allowances in the steel industry using the benchmark method, it was recommended to prioritize a stable expansion scenario benchmark first. Then, a gradual transition to moderate emission reduction scenario and planned emission reduction scenario should be pursued. The stringent emission reduction scenarios should be chosen cautiously due to excessive pressure on enterprises. (3) The moderate and the planned emission reduction scenarios had significant advantages in terms of methodology and emission reduction, and they could be promoted to other industries and regions. (4) The national carbon market could increase carbon emission cost by dynamically tightening the benchmark, effectively mitigating the impact of the CBAM. [Conclusion] Phased and differentiated benchmark setting is one of the key factors for ensuring the stable and orderly expansion of the steel industry in the national carbon market. It is recommended to focus on standardizing the collection of corporate basic carbon emission data and advancing the refinement of benchmark formulation. Meanwhile, a systematic plan should be developed, which integrates the establishment of carbon market emission control industry benchmark, total emission control mechanisms, and carbon intensity target assessment. Through policy coordination, this can enable the precise transmission of regional carbon intensity targets to key industries.
JI Hongjie , YANG Jun , CONG Jianhui , ZHAO Yongbin . Dynamic benchmark setting for steel industry from the perspective of stable expansion of carbon market:Based on survey data from steel enterprises in Shanxi Province[J]. Resources Science, 2025 , 47(4) : 786 -802 . DOI: 10.18402/resci.2025.04.09
表1 2020年钢铁行业碳配额平衡值及盈亏分析Table 1 Analysis of balance values of carbon quota and profit and loss for steel industry in 2020 |
| 序号 | 工序 | 平衡值/ (tCO2/t) | 盈余企业 占比/% | 亏损企业 占比/% |
|---|---|---|---|---|
| 1 | 焦化 | 0.2890 | 66.67 | 33.33 |
| 2 | 烧结 | 0.1640 | 57.14 | 42.86 |
| 3 | 球团 | 0.0349 | 78.57 | 21.43 |
| 4 | 炼铁 | 1.5039 | 35.71 | 64.29 |
| 5 | 炼钢 | 0.0156 | 43.48 | 56.52 |
| 6 | 轧钢 | 0.0614 | 65.38 | 34.62 |
| 7 | 石灰 | 0.1691 | 58.82 | 41.18 |
| 8 | 合计 | — | 59.57 | 40.43 |
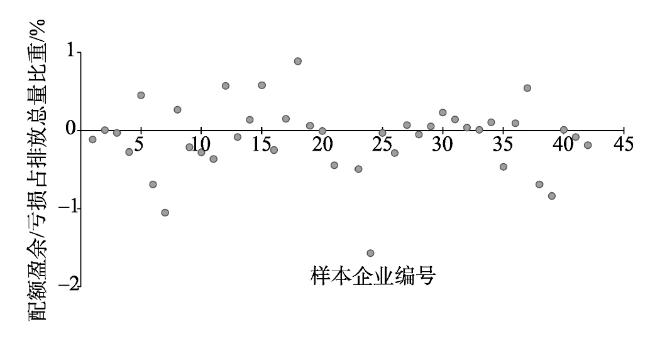
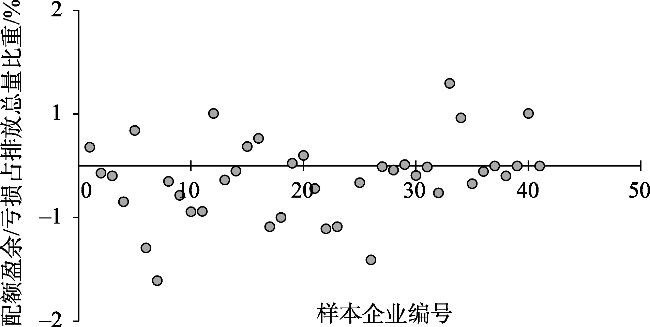
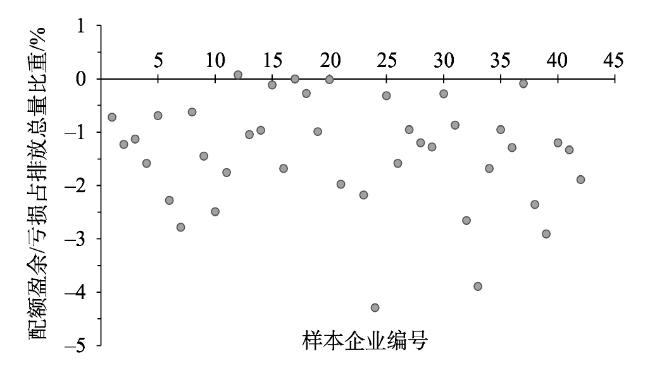
图3 SCME情景下钢铁行业碳配额盈亏分析注:图3未显示的24#企业碳配额亏损率达14.48%,可能由于其工艺仅含焦化(占主导)及炼铁工序,且焦化副产品二次能源利用率不足,叠加核算边界偏差,小企业数据规范性不足等原因所致。因其规模较小,对行业整体影响有限。 Figure 3 Analysis of carbon quota profit and loss for steel industry under SCME scenario |
表2 2020年烧结工序MER情景下各基准线及盈亏分析Table 2 Analysis of carbon quota benchmarks and profit and loss for sintering process under MER scenario in 2020 |
| 序号 | 基准线/(tCO2/t) | 配额量/万t | 盈亏量/万t | 盈亏量占比/% | 盈余企业占比/% | 亏损企业占比/% |
|---|---|---|---|---|---|---|
| 1 | 0.0947 | 810.80 | -593.70 | -42.27 | 4.76 | 95.24 |
| 2 | 0.1403 | 1201.15 | -203.34 | -14.48 | 21.43 | 78.57 |
| 3 | 0.1574 | 1347.62 | -56.87 | -4.05 | 45.24 | 54.76 |
| 4 | 0.1641 | 1404.88 | 0.39 | 0.03 | 59.52 | 40.48 |
| 5 | 0.1774 | 1518.61 | 114.12 | 8.13 | 73.81 | 26.19 |
| 6 | 0.2451 | 2098.73 | 694.23 | 49.43 | 90.48 | 9.52 |
表3 2020年钢铁行业MER情景基准线及盈亏分析Table 3 Analysis of carbon quota benchmarks and profit and loss for steel industry under MER scenario in 2020 |
| MER | 基准值/ (tCO2/t) | 碳强度下 降率/% | 配额量 /万t | 配额盈亏 量/万t | 配额盈亏 占比/% | 企业盈余 占比/% | 企业亏损 占比/% |
|---|---|---|---|---|---|---|---|
| 焦化工序 | 0.2591 | -11.53 | 203.31 | -23.47 | -10.35 | 66.67 | 33.33 |
| 烧结工序 | 0.1574 | -4.22 | 1347.62 | -56.87 | -4.05 | 45.24 | 54.76 |
| 球团工序 | 0.0328 | -6.54 | 28.29 | -1.86 | -6.17 | 78.57 | 21.43 |
| 炼铁工序 | 1.4485 | -3.82 | 8942.12 | -342.17 | -3.69 | 23.81 | 76.19 |
| 炼钢工序 | 0.0155 | -0.44 | 103.47 | -0.38 | -0.37 | 43.48 | 56.52 |
| 轧钢工序 | 0.0605 | -1.50 | 362.05 | -1.05 | -0.29 | 65.38 | 34.62 |
| 石灰工序 | 0.1623 | -4.18 | 72.86 | -3.07 | -4.04 | 58.82 | 41.18 |
| 钢铁行业合计 | 11065.64 | -427.69 | -3.72 | 27.66 | 72.34 | ||
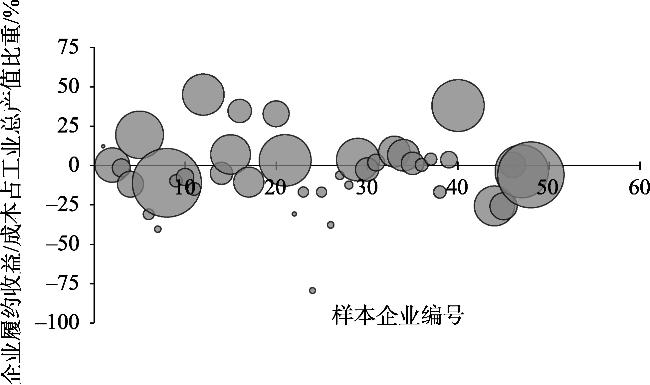
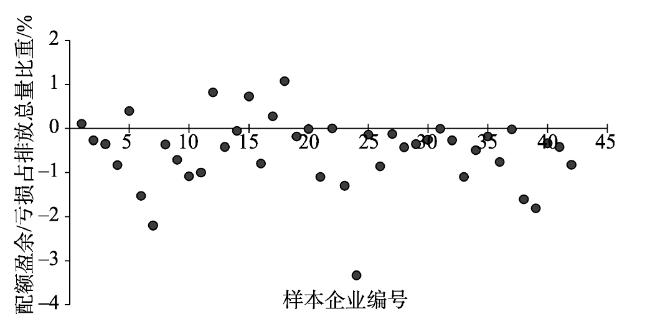
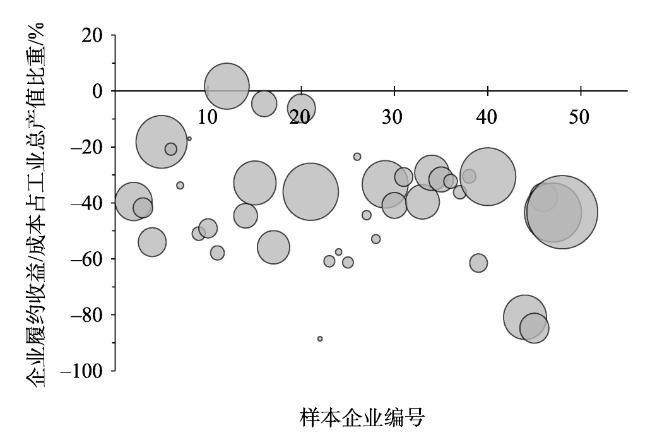
图5 MER情景下钢铁行业碳配额盈亏分析注:图5未显示的26#、48#企业碳配额亏损率分别为10.89%、5.53%,经进一步分析,均为以炼铁为主的铸造类企业,流程短,但其生产规模相对较小,对整个钢铁行业影响依然可以忽略。 Figure 5 Analysis of carbon quota profit and loss for steel industry under MER scenario |
表4 2020年钢铁行业PER情景基准线及盈亏分析Table 4 Analysis of carbon quota benchmarks and profit and loss for steel industry under PER scenario in 2020 |
| PER | 基准值/ (tCO2/t) | 碳强度下 降率/% | 配额量 /万t | 配额盈亏 量/万t | 配额盈亏 占比/% | 企业盈余 占比/% | 企业亏损 占比/% |
|---|---|---|---|---|---|---|---|
| 焦化工序 | 0.2642 | -8.57 | 207.33 | -19.44 | -9.38 | 66.67 | 33.33 |
| 烧结工序 | 0.1499 | -8.61 | 1283.58 | -120.91 | -9.42 | 33.33 | 66.67 |
| 球团工序 | 0.0319 | -8.71 | 27.52 | -2.62 | -9.54 | 78.57 | 21.43 |
| 炼铁工序 | 1.3748 | -8.59 | 8487.22 | -797.06 | -9.39 | 11.90 | 88.10 |
| 炼钢工序 | 0.0143 | -8.40 | 95.13 | -8.72 | -9.17 | 39.13 | 60.87 |
| 轧钢工序 | 0.0561 | -8.60 | 336.10 | -31.62 | -9.41 | 61.54 | 38.46 |
| 石灰工序 | 0.1546 | -8.58 | 69.41 | -6.51 | -9.38 | 58.82 | 41.18 |
| 钢铁行业合计 | 10506.34 | -910.97 | -8.67 | 16.67 | 83.33 | ||
表5 2020年钢铁行业EER情景基准线及盈亏分析Table 5 Analysis of carbon quota benchmarks and profit and loss for steel industry under EER scenario in 2020 |
| EER | 基准值/ (tCO2/t) | 碳强度下 降率/% | 配额量 /万t | 配额盈亏 量/万t | 配额盈亏 占比/% | 企业盈余 占比/% | 企业亏损 占比/% |
|---|---|---|---|---|---|---|---|
| 焦化工序 | 0.1643 | -43.14 | 128.95 | -97.83 | -43.13 | 4.76 | 95.24 |
| 烧结工序 | 0.0840 | -48.79 | 719.24 | -685.26 | -48.80 | 2.38 | 97.62 |
| 球团工序 | 0.0114 | -67.47 | 9.81 | -20.34 | -67.56 | 4.76 | 95.24 |
| 炼铁工序 | 1.1368 | -24.41 | 7018.18 | -2266.10 | -24.41 | 7.14 | 92.86 |
| 炼钢工序 | 0.0088 | -43.17 | 59.02 | -44.84 | -43.08 | 19.05 | 80.95 |
| 轧钢工序 | 0.0242 | -60.56 | 145.09 | -222.76 | -60.59 | 4.76 | 95.24 |
| 石灰工序 | 0.0155 | -90.83 | 6.96 | -68.96 | -90.83 | 4.76 | 95.24 |
| 钢铁行业合计 | 8087.24 | -3406.09 | -29.64 | 4.76 | 95.24 | ||
表6 钢铁行业2020年基准线测算结果 (tCO2/t)Table 6 Benchmark calculation results for steel industry in 2020 (tCO2/t) |
| 基准线情景 | 焦化 | 烧结 | 球团 | 炼铁 | 炼钢 | 轧钢 | 石灰 |
|---|---|---|---|---|---|---|---|
| SCME | 0.2890 | 0.1640 | 0.0349 | 1.5039 | 0.0156 | 0.0614 | 0.1691 |
| MER | 0.2591 | 0.1574 | 0.0328 | 1.4485 | 0.0155 | 0.0605 | 0.1623 |
| PER | 0.2642 | 0.1499 | 0.0319 | 1.3748 | 0.0143 | 0.0561 | 0.1546 |
| EER | 0.1643 | 0.0840 | 0.0114 | 1.1368 | 0.0088 | 0.0242 | 0.0155 |
表7 山西省钢铁行业2020年各基准线配额盈亏情况Table 7 Profit and loss of various benchmark quotas for steel industry in Shanxi Province in 2020 |
| 基准线情景 | 配额量/万t | 配额盈亏量/万t | 减排强度/% | 盈余企业占比/% | 亏损企业占比/% |
|---|---|---|---|---|---|
| SCME | 11493.16 | -0.17 | 0.00 | 55.32 | 44.68 |
| MER | 11065.64 | -427.69 | -3.72 | 27.66 | 72.34 |
| PER | 10506.31 | -986.85 | -8.59 | 16.67 | 83.33 |
| EER | 8087.19 | -3405.97 | -29.63 | 4.76 | 95.24 |
表8 中国钢铁行业基准线与欧盟对比情况Table 8 Comparison of steel industry benchmarks between China's carbon trading market and EU-ETS |
| 情景 | 焦化/% | 烧结/% | 炼铁/% | 电炉炼钢/% |
|---|---|---|---|---|
| EU-ETS基准值/ (tCO2/t产品) | 0.2860 | 0.1710 | 1.3280 | 0.3175 |
| SCME | 1.05 | -4.09 | 13.25 | -26.83 |
| MER | -9.41 | -7.95 | 9.07 | -26.83 |
| PER | -7.63 | -12.33 | 3.52 | -33.12 |
| EER | -42.55 | -50.87 | -14.40 | -26.83 |
注:“+”“-”分别代表高于、低于EU-ETS基准值。EU-ETS不包括球团、转炉炼钢、轧钢、石灰工序,在此不作比较。 |
| [1] |
周丽, 张希良, 佟庆. 扩大全国碳市场行业覆盖范围研究[J]. 环境保护, 2024, 52(7): 48-54.
|
| [2] |
|
| [3] |
|
| [4] |
|
| [5] |
|
| [6] |
|
| [7] |
|
| [8] |
|
| [9] |
|
| [10] |
|
| [11] |
|
| [12] |
|
| [13] |
|
| [14] |
|
| [15] |
熊灵, 齐绍洲, 沈波. 中国碳交易试点配额分配的机制特征、设计问题与改进对策[J]. 武汉大学学报(哲学社会科学版), 2016, 69(3): 56-64.
|
| [16] |
|
| [17] |
|
| [18] |
唐葆君, 吉嫦婧. 全国碳市场扩容策略的经济和排放影响研究[J]. 北京理工大学学报(社会科学版), 2022, 24(4): 129-139.
|
| [19] |
|
| [20] |
商亚楠. 我国电力行业碳交易模拟经济绩效研究[D]. 南京: 南京航空航天大学, 2015.
|
| [21] |
|
| [22] |
|
| [23] |
肖勇, 戚锦通, 胡伟, 等. 基于双层规划模型的燃煤发电机组初始碳排放配额分配方案研究[J]. 热力发电, 2022, 51(10): 42-46.
|
| [24] |
齐绍洲, 徐珍珍, 谭秀杰, 等. 中国碳市场产能过剩行业的碳排放配额如何分配是有效的?[J]. 中国人口·资源与环境, 2021, 31(9): 73-85.
|
| [25] |
武振华. 我国化工行业碳排放效率、影响因素及碳配额分配研究[D]. 天津: 天津大学, 2023.
|
| [26] |
惠婧璇, 朱松丽. 全国碳排放权交易市场下电解铝行业基准线法研究[J]. 气候变化研究进展, 2022, 18(3): 366-372.
|
| [27] |
|
| [28] |
谭琦璐, 刘兰婷, 朱松丽. 全国碳交易下中国钢铁行业的基准线法研究[J]. 气候变化研究进展, 2021, 17(5): 590-597.
|
| [29] |
宋亚植, 李银, 李仲飞. 基于产出效率的中国钢铁行业碳配额分配方案[J]. 资源科学, 2023, 45(2): 333-343.
|
| [30] |
林秀群, 汪巧巧, 杨红娟. 差异性视角下俱乐部成员碳配额分配方法研究[J]. 资源科学, 2023, 45(6): 1196-1207.
|
| [31] |
齐绍洲, 徐珍珍, 杨芷萱. 欧盟碳边境调节机制下中国钢铁行业的碳配额分配策略[J]. 资源科学, 2022, 44(2): 274-286.
|
| [32] |
International Carbon Action Partnership. Emissions Trading Worldwide: 2023 ICAP Status Report[R/OL]. (2024-03-22) [2024-09-15]. https://icapcarbonaction.com/system/files/document/ICAP%20Emissions%20Trading%20Worldwide%202023%2 0Status%20Report_0.pdf.
|
| [33] |
段茂盛. 碳市场配额分配机制的国内外实践及优化调整的建议[J]. 中国电力企业管理, 2024, (7): 26-28.
|
| [34] |
张宁宁. 中国钢铁行业碳排放效率地区差异及影响因素研究[D]. 北京: 华北电力大学, 2021.
|
| [35] |
生态环境部. 关于做好2022年企业温室气体排放报告管理相关重点工作的通知[EB/OL]. (2022-03-10) [2024-03-15]. https://www.mee.gov.cn/xxgk2018/xxgk/xxgk06/202203/t20220315_971468.html.
[Ministry of Ecology and Environment. Notice on Key Tasks for Managing Corporate Greenhouse Gas Emission Reporting in 2022[EB/OL]. ( 2022-03-10) [2024-03-15]. https://www.mee.gov.cn/xxgk2018/xxgk/xxgk06/202203/t20220315_971468.html.]
|
| [36] |
张希良. 国家碳市场总体设计中几个关键指标之间的数量关系[J]. 环境经济研究, 2017, 2(3): 1-5, 48.
|
| [37] |
|
| [38] |
|
| [39] |
顾阿伦, 史宵鸣, 汪澜, 等. 中国水泥行业节能减排的潜力与成本分析[J]. 中国人口·资源与环境, 2012, 22(8): 16-21.
|
| [40] |
董金池, 汪旭颖, 蔡博峰, 等. 中国钢铁行业CO2减排技术及成本研究[J]. 环境工程, 2021, 39(10): 23-31, 40.
|
| [41] |
刘楠峰, 范莉莉, 陈肖琳. 碳交易机制下以技术投入为导向的边际减排成本曲线研究: 以水泥、火电、煤炭和钢铁行业为例[J]. 中国科技论坛, 2017, (7): 57-63, 86.
|
| [42] |
山西省人民政府. 2020年全省工业增加值同比增长5.7%[N/OL]. (2021-02-04) [2024-03-15]. https://www.shanxi.gov.cn/ywdt/sxyw/202102/t20210204_6063885.shtml.
[Shanxi Provincial People's Government. In 2020, the Province's Industrial Added Value Increased by 5.7% Year-on-year[N/OL]. (2021-02-04) [2024-03-15]. https://www.shanxi.gov.cn/ywdt/sxyw/202102/t20210204_6063885.shtml.]
|
| [43] |
山西省人民政府. 2020年山西地区生产总值1.765万亿元年均增长5.5%[N/OL]. (2021-01-20) [2024-03-15]. https://www.shanxi.gov.cn/ztjj/jj2021sxlh/jj2021sxlh_sdb/202101/t20210120_6036157.shtml.
[Shanxi Provincial People's Government. In 2020, Shanxi's Regional Gross Domestic Product (GDP) Reached 1.765 Trillion Yuan, with an Average Annual Growth Rate of 5.5%[N/OL]. (2021-01-20) [2024-03-15]. https://www.shanxi.gov.cn/ztjj/jj2021sxlh/jj2021sxlh_sdb/202101/t20210120_6036157.shtml.]
|
| [44] |
山西省经济和信息化委员会. 山西省钢铁行业能效水平对标活动实施方案[EB/OL]. (2016-06-06) [2024-03-15]. http://www.sxgtxh.cn/hangyedongtai/2016-06-06/2649.html.
[Shanxi Provincial Economic and Information Technology Commission. Implementation Plan for the Energy Efficiency Benchmarking Activity in Shanxi's Steel Industry[EB/OL]. (2016-06-06) [2024-03-15]. http://www.sxgtxh.cn/hangyedongtai/2016-06-06/2649.html.]
|
| [45] |
|
| [46] |
张蓝心, 温宗国, 许毛, 等. 欧盟碳边境调节机制对产品出口成本影响评估[J]. 中国环境科学, 2024, 44(4): 1788-1794.
|
/
| 〈 |
|
〉 |