
The impact and mechanism of polycentric structure within Chinese cities on carbon emission intensity
Received date: 2023-10-28
Revised date: 2024-01-16
Online published: 2024-08-29
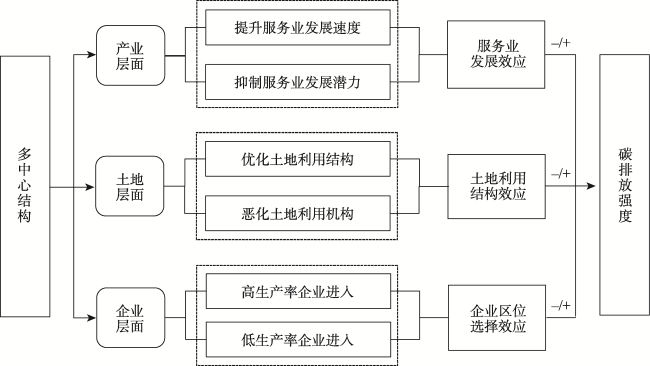
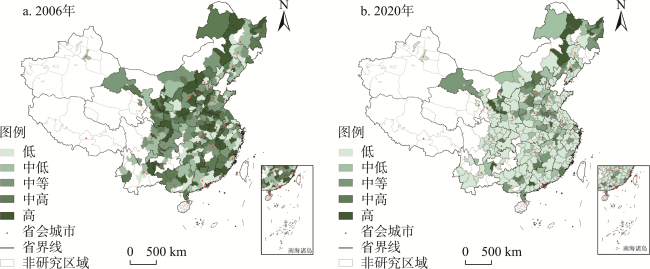
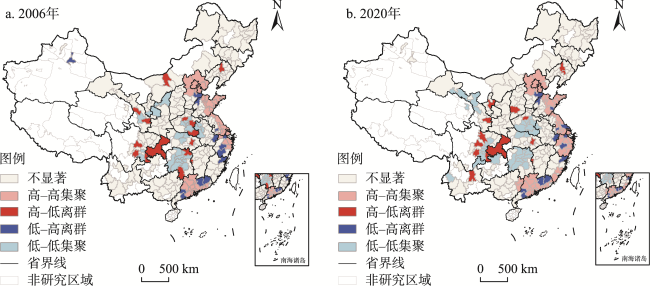
[Objective] As China transitions from mid-stage to late-stage urbanization, the polycentric structure of cities is accelerating. This study explored its impact on carbon emission intensity and the underlying mechanisms. From a spatial planning perspective, it aimed to provide new insights for low-carbon city construction. [Methods] The study examined 279 prefecture-level and above cities in China from 2006 to 2020. Using a two-way fixed effects model, instrumental variables, and propensity score matching, it empirically tested the carbon emission reduction effects of the urban polycentric structure and its underlying mechanisms. [Results] (1) From 2006 to 2020, urban carbon emission intensity showed a declining trend. Spatially, it exhibited a core-periphery structure and provincial boundary phenomena, with minor changes in the east-west gap and an increase in the north-south gap. The urban polycentric structure showed an upward trend with stable geographic clustering characteristics. (2) The polycentric structure significantly reduced carbon emission intensity, but there is regional heterogeneity. It was higher in eastern and western cities compared to central cities and higher in southern cities compared to northern cities. Additionally, it was only present in economically advanced cities and cities with a large population. (3) The mechanism analyses indicated that the urban polycentric structure reduced carbon emission intensity through three pathways: promoting faster development of the service industry, optimizing land use structure, and attracting high-productivity enterprises. However, whether enterprise location choices result in sectoral-specific or mixed clustering varied between cities. [Conclusion] In the new stage of urbanization, supporting the development of polycentric cities is necessary. However, it is crucial to understand the preconditions for the effective carbon emission reduction effects of the urban polycentric structure and to create smooth transmission channels.
ZOU Xuan , YANG Xu , LIU Chen . The impact and mechanism of polycentric structure within Chinese cities on carbon emission intensity[J]. Resources Science, 2024 , 46(7) : 1284 -1298 . DOI: 10.18402/resci.2024.07.04
表1 主要变量的描述性统计Table 1 Descriptive statistics of the main variables |
| 变量/单位 | 符号 | 样本量 | 平均值 | 标准差 | 最小值 | 最大值 |
|---|---|---|---|---|---|---|
| 碳排放强度/(万t/亿元) | Ci | 4160 | 2.678 | 3.011 | 0.035 | 32.132 |
| 多中心结构 | lnPoly | 4160 | 0.205 | 0.175 | 0.000 | 0.683 |
| 经济水平/元 | lnRgdp | 4160 | 10.726 | 0.679 | 8.079 | 12.695 |
| 人口规模/万人 | lnPop | 4160 | 4.641 | 0.785 | 2.703 | 7.821 |
| 投资强度 | Inves | 4160 | 2.573 | 1.800 | 0.060 | 19.150 |
| 产业结构 | Industry | 4160 | 0.479 | 0.122 | 0.095 | 0.909 |
| 外商投资 | Fdi | 4160 | 0.018 | 0.019 | 0.000 | 0.205 |
| 财政压力 | Fiscal | 4160 | 0.168 | 0.108 | 0.010 | 2.702 |
| 环境规制 | Er | 4160 | 0.067 | 0.542 | 0.000 | 22.034 |
| 电耗强度/(kW·h/元) | Energy | 4160 | 0.247 | 0.345 | 0.011 | 4.277 |
表2 基准回归及内生性检验结果Table 2 Benchmark regression and endogeneity test results |
| 固定效应 | 工具变量 | ||||||||
|---|---|---|---|---|---|---|---|---|---|
| (1) Ci | (2) Ci | (3) Ci | (4) Ci | (5) Ci | (6) Ci | (7) Ci | (8) Ci | ||
| lnPoly | -2.129*** | -1.204** | -0.706* | -1.058*** | -1.848*** | -1.358*** | -3.625*** | -3.151*** | |
| (0.585) | (0.470) | (0.375) | (0.389) | (0.488) | (0.426) | (0.657) | (0.652) | ||
| lnRgdp | -1.358*** | -1.121*** | -0.918*** | -0.892*** | |||||
| (0.220) | (0.282) | (0.192) | (0.196) | ||||||
| lnPop | -1.446*** | -1.642*** | -1.503*** | -1.498*** | |||||
| (0.261) | (0.305) | (0.159) | (0.167) | ||||||
| Inves | -0.027 | 0.002 | 0.014 | 0.016 | |||||
| (0.036) | (0.041) | (0.022) | (0.023) | ||||||
| Industry | -0.176 | -0.179 | -0.150* | -0.156* | |||||
| (0.185) | (0.180) | (0.086) | (0.088) | ||||||
| Fdi | -4.922** | -7.363*** | -6.873*** | -7.261*** | |||||
| (2.127) | (2.387) | (1.610) | (1.677) | ||||||
| Fiscal | 0.816 | 1.246* | 1.301** | 1.513* | |||||
| (0.646) | (0.717) | (0.651) | (0.782) | ||||||
| Er | 0.236* | 0.205* | 0.164*** | 0.165*** | |||||
| (0.125) | (0.106) | (0.056) | (0.054) | ||||||
| Energy | 1.466*** | 1.429*** | 1.717*** | 1.836*** | |||||
| (0.506) | (0.511) | (0.323) | (0.413) | ||||||
| _Cons | 3.124*** | 4.839*** | 24.164*** | 23.116*** | |||||
| (0.228) | (0.176) | (2.426) | (3.247) | ||||||
| 第一阶段系数 | 0.033*** (0.002) | 0.033*** (0.003) | 0.022*** (0.000) | 0.023*** (0.000) | |||||
| Kleibergen-Paap rk LM | 194.169*** | 193.060*** | 156.807*** | 154.471*** | |||||
| 第一阶段F值 | 176.717 | 175.114 | 154.328 | 154.017 | |||||
| 个体固定 | No | YES | No | YES | YES | YES | YES | YES | |
| 时间固定 | No | YES | No | YES | YES | YES | YES | YES | |
| N | 4160 | 4160 | 4160 | 4160 | 3887 | 3887 | 3887 | 3887 | |
| R2 | 0.251 | 0.361 | 0.421 | 0.473 | 0.319 | 0.450 | 0.320 | 0.445 | |
注:括号内是稳健标准误,*、**和***分别表示在10%、5%和1%的水平上显著。下同。 |
表3 平衡性检验及反事实检验结果Table 3 Balance test and counterfactual test results |
| 匹配方法 | 匹配前后解释变量的平衡性检验结果 | 反事实效应评估结果 | ||||||||
|---|---|---|---|---|---|---|---|---|---|---|
| Ps R2 | LR值 | P值 | MeanBias | MedBias | Treated | Controls | ATT | T值 | ||
| 匹配前 | 0.029 | 99.46 | 0.000 | 14.4 | 12.9 | |||||
| 最近邻匹配(k=1) | 0.005 | 7.62 | 0.573 | 2.2 | 1.6 | 2.153 | 2.440 | -0.288*** | -4.85 | |
| 最近邻匹配(k=3) | 0.001 | 1.85 | 0.991 | 1.7 | 1.3 | 2.153 | 2.456 | -0.303** | -2.51 | |
| 卡尺匹配(k=3, ε=0.01) | 0.001 | 1.85 | 0.994 | 1.7 | 1.3 | 2.153 | 2.456 | -0.303** | -2.51 | |
| 半径匹配(ε=0.01) | 0.000 | 0.52 | 0.997 | 1.1 | 1.1 | 2.153 | 2.447 | -0.294*** | -2.98 | |
| 核匹配(最优带宽) | 0.002 | 3.48 | 0.942 | 2.1 | 1.2 | 2.153 | 2.523 | -0.370*** | -3.87 | |
表4 核心变量的稳健性检验结果Table 4 Robustness test results of core variables |
| (1) | (2) | (3) | (4) | (5) | (6) | (7) | |
|---|---|---|---|---|---|---|---|
| Ci | Ci | Ci | Ci | Ci_CEADs | Ci_ODICA | Ci_SUM | |
| Poly_1 | -0.374** | ||||||
| (0.173) | |||||||
| lnPoly_2 | -0.228** | ||||||
| (0.106) | |||||||
| lnPoly_3 | -0.194* | ||||||
| (0.099) | |||||||
| lnPoly_4 | -0.799*** | ||||||
| (0.202) | |||||||
| lnPoly | -0.547** | -0.542** | -0.923*** | ||||
| (0.263) | (0.240) | (0.313) | |||||
| _Cons | 23.099*** | 23.133*** | 17.522*** | 19.204*** | 14.611*** | 12.893*** | 15.967*** |
| (3.287) | (3.262) | (0.991) | (3.058) | (2.553) | (1.896) | (2.334) | |
| 控制变量 | YES | YES | YES | YES | YES | YES | YES |
| 个体固定 | YES | YES | YES | YES | YES | YES | YES |
| 时间固定 | YES | YES | YES | YES | YES | YES | YES |
| N | 4160 | 4160 | 3551 | 4160 | 3322 | 3873 | 3886 |
| R2 | 0.455 | 0.456 | 0.468 | 0.578 | 0.590 | 0.498 | 0.388 |
注:控制变量与表2相同。下同。 |
表5 剔除特殊样本及考虑空间效应的稳健性Table 5 Robustness of excluding special samples and considering spatial effects |
| (1) | (2) | (3) | (4) | (5) | |
|---|---|---|---|---|---|
| 双边缩尾1% | 剔除特殊年份 | 剔除特殊城市 | 剔除无/单中心 | 考虑空间效应 | |
| Ci | Ci | Ci | Ci | Ci | |
| lnPoly | -0.967*** | -1.161** | -1.052*** | -0.745** | -0.693*** |
| (0.369) | (0.465) | (0.390) | (0.366) | (0.207) | |
| _Cons | 21.848*** | 22.053*** | 23.280*** | 17.759*** | 25.048** |
| (3.153) | (3.290) | (3.281) | (3.871) | (11.231) | |
| 控制变量 | YES | YES | YES | YES | YES |
| 个体固定 | YES | YES | YES | YES | YES |
| 时间固定 | YES | YES | YES | YES | YES |
| N | 4037 | 3886 | 4086 | 3013 | 4185 |
| R2 | 0.557 | 0.468 | 0.474 | 0.563 | 0.086 |
表6 异质性检验结果Table 6 Heterogeneity test results |
| (1) | (2) | (3) | (4) | (5) | |
|---|---|---|---|---|---|
| 东部 | 中部 | 西部 | 南方 | 北方 | |
| Ci | Ci | Ci | Ci | Ci | |
| lnPoly | -1.322** | -0.314 | -1.471** | -1.836*** | -0.042 |
| (0.609) | (0.501) | (0.644) | (0.557) | (0.515) | |
| _Cons | 8.085 | 29.956*** | 16.507*** | 13.633*** | 33.076*** |
| (6.727) | (4.698) | (5.043) | (4.032) | (4.481) | |
| 控制变量 | YES | YES | YES | YES | YES |
| 个体固定 | YES | YES | YES | YES | YES |
| 时间固定 | YES | YES | YES | YES | YES |
| N | 1256 | 1683 | 1221 | 2250 | 1910 |
| R2 | 0.492 | 0.503 | 0.558 | 0.472 | 0.523 |
| (6) | (7) | (8) | (9) | ||
| 经济高水平城市 | 经济低水平城市 | 人口大城市 | 人口中小城市 | ||
| Ci | Ci | Ci | Ci | ||
| lnPoly | -0.938*** | 0.082 | -1.076** | -0.631 | |
| (0.320) | (0.541) | (0.477) | (0.533) | ||
| _Cons | 10.931*** | 29.457*** | 6.202 | 31.014*** | |
| (2.490) | (4.827) | (4.049) | (3.893) | ||
| 控制变量 | YES | YES | YES | YES | |
| 个体固定 | YES | YES | YES | YES | |
| 时间固定 | YES | YES | YES | YES | |
| N | 2171 | 1989 | 1733 | 2427 | |
| R2 | 0.498 | 0.466 | 0.606 | 0.499 |
表7 服务业发展的机制检验结果Table 7 Mechanism test results of service industry development effect |
| (1) | (2) | (3) | |
|---|---|---|---|
| S_VA | S_EP | S_NE | |
| lnPoly | 0.018* | 0.003** | 0.007* |
| (0.011) | (0.001) | (0.004) | |
| _Cons | -0.276*** | -0.161 | 5.443*** |
| (0.096) | (0.119) | (0.369) | |
| 控制变量 | YES | YES | YES |
| 个体固定 | YES | YES | YES |
| 时间固定 | YES | YES | YES |
| N | 4160 | 4160 | 3912 |
| R2 | 0.367 | 0.174 | 0.203 |
表8 土地利用结构的机制检验结果Table 8 Mechanism test results of land use structure effect |
| (1) | (2) | (3) | (4) | |
|---|---|---|---|---|
| Impervious | Agriculture | Cropland | Ecology | |
| lnPoly | -0.008*** | 0.006** | 0.023*** | -0.017*** |
| (0.003) | (0.003) | (0.005) | (0.004) | |
| _Cons | 0.134*** | 0.823*** | 0.525*** | 0.298*** |
| (0.012) | (0.012) | (0.019) | (0.016) | |
| 控制变量 | YES | YES | YES | YES |
| 个体固定 | YES | YES | YES | YES |
| 时间固定 | YES | YES | YES | YES |
| N | 4160 | 4160 | 4160 | 4160 |
| R2 | 0.620 | 0.559 | 0.276 | 0.660 |
表9 企业区位选择效应的机制检验结果Table 9 Mechanism test results of enterprise location selection effect |
| (1) | (2) | (3) | (4) | (5) | (6) | |
|---|---|---|---|---|---|---|
| 全样本 | 东部 | 中部 | 西部 | 经济高水平城市 | 经济低水平城市 | |
| lnTfp | lnTfp | lnTfp | lnTfp | lnTfp | lnTfp | |
| lnPoly | 0.016 | 0.053** | -0.058 | 0.033 | 0.033** | 0.023 |
| (0.020) | (0.024) | (0.058) | (0.030) | (0.014) | (0.030) | |
| _Cons | 0.419 | -0.543 | 1.080** | 0.570 | 1.182*** | 0.632** |
| (0.340) | (1.112) | (0.447) | (0.564) | (0.257) | (0.285) | |
| 控制变量 | YES | YES | YES | YES | YES | YES |
| 个体固定 | YES | YES | YES | YES | YES | YES |
| 时间固定 | YES | YES | YES | YES | YES | YES |
| N | 2281 | 781 | 984 | 516 | 1039 | 1242 |
| R2 | 0.183 | 0.166 | 0.214 | 0.253 | 0.143 | 0.209 |
| [1] |
李治国, 王杰, 车帅. 土地城市化推进的空间减排效应: 内在机制与中国经验[J]. 统计研究, 2021, 38(12): 89-104.
[
|
| [2] |
王晓红, 李宣廷, 张少鹏. 多中心结构是否促进城市高质量发展? 来自中国地级城市层面的经验证据[J]. 中国人口·资源与环境, 2022, 32(5): 57-67.
[
|
| [3] |
商玉萍, 潘洲, 孟美侠. 中国城市多中心空间战略的创新绩效研究: 基于集聚经济与舒适度的视角[J]. 经济学(季刊), 2023, 23(3): 965-982.
[
|
| [4] |
郭沛, 王光远. 数字经济的减污降碳协同作用及机制: 基于地级市数据的实证检验[J]. 资源科学, 2023, 45(11): 2117-2129.
[
|
| [5] |
黄建, 冯升波, 杨阳, 等. 全要素能源效率及其测算、比较与验证[J]. 资源科学, 2023, 45(2): 281-295.
[
|
| [6] |
邵帅, 范美婷, 杨莉莉. 经济结构调整、绿色技术进步与中国低碳转型发展: 基于总体技术前沿和空间溢出效应视角的经验考察[J]. 管理世界, 2022, 38(2): 46-69.
[
|
| [7] |
黄寰, 何广, 肖义. 低碳城市试点政策的碳减排效应[J]. 资源科学, 2023, 45(5): 1044-1058.
[
|
| [8] |
王文治, 胡雍, 张晓宇. 中国省域碳排放责任分配方法比较与碳补偿设计[J]. 资源科学, 2023, 45(10): 1913-1930.
[
|
| [9] |
|
| [10] |
陆铭, 冯皓. 集聚与减排: 城市规模差距影响工业污染强度的经验研究[J]. 世界经济, 2014, 37(7): 86-114.
[
|
| [11] |
邵帅, 张可, 豆建民. 经济集聚的节能减排效应: 理论与中国经验[J]. 管理世界, 2019, 35(1): 36-60.
[
|
| [12] |
|
| [13] |
|
| [14] |
|
| [15] |
赵渺希, 师浩辰, 王慧芹. 大都市区功能性多中心的产业集聚检验: 以珠三角企业网络为例[J]. 地理研究, 2021, 40(12): 3437-3454.
[
|
| [16] |
王垚, 钮心毅. 长江三角洲城市群核心区的功能多中心特征和规划响应: 基于城际出行联系的研究[J]. 国际城市规划, 2021, 36(6): 98-108.
[
|
| [17] |
孙斌栋, 王言言, 张志强, 等. 中国城市规模分布的形态和演化与城市增长模式: 基于Zipf定律与Gibrat定律的分析[J]. 地理科学进展, 2022, 41(3): 361-370.
[
|
| [18] |
刘修岩, 杜聪, 盛雪绒. 容积率规制与中国城市空间结构[J]. 经济学(季刊), 2022, 22(4): 1447-1466.
[
|
| [19] |
王峤, 刘修岩, 李迎成. 空间结构、城市规模与中国城市的创新绩效[J]. 中国工业经济, 2021, (5): 114-132.
[
|
| [20] |
马秀馨, 刘耀林, 刘艳芳, 等. 时间异质性视角下对中国城市形态多中心性演化的探究[J]. 地理研究, 2020, 39(4): 787-804.
[
|
| [21] |
|
| [22] |
|
| [23] |
|
| [24] |
|
| [25] |
|
| [26] |
韩帅帅, 苗长虹, 李奕灿. 黄河流域城市多中心结构对碳排放的影响研究[J]. 地理研究, 2023, 42(4): 936-954.
[
|
| [27] |
雷玉桃, 朱鹤政, 彭文祥. 多中心结构对城市碳减排的影响研究: 基于中国超特大城市的实证分析[J]. 城市问题, 2023, (2): 4-12.
[
|
| [28] |
钟粤俊, 陆铭, 奚锡灿. 集聚与服务业发展: 基于人口空间分布的视角[J]. 管理世界, 2020, 36(11): 35-49.
[
|
| [29] |
张婷麟. 多中心城市空间结构的经济绩效研究: 基于规模的条件效应[D]. 上海: 华东师范大学, 2019.
[
|
| [30] |
|
| [31] |
蔡翼飞. 城镇化进程中的城市人口扩张与土地扩张: 特征事实与协调机制[J]. 中国软科学, 2023, (1): 84-93.
[
|
| [32] |
李松林, 刘修岩, 王峤. 集聚与创新: 来自摩天大楼建设的证据[J]. 经济学(季刊), 2023, 23(2): 517-531.
[
|
| [33] |
马相东, 张文魁, 刘丁一. 地方政府招商引资政策的变迁历程与取向观察: 1978-2021年[J]. 改革, 2021, (8): 131-144.
[
|
| [34] |
梁若冰, 蓝天. 行政区扩张、土地出让依赖与城市发展质量: 基于卫星灯光数据的准实验研究[J]. 经济学(季刊), 2023, 23(3): 1019-1034.
[
|
| [35] |
韩先锋, 肖坚, 董明放. 绿色金融发展的碳减排效应[J]. 资源科学, 2023, 45(4): 843-856.
[
|
| [36] |
任晓松, 刘宇佳, 赵国浩. 经济集聚对碳排放强度的影响及传导机制[J]. 中国人口·资源与环境, 2020, 30(4): 95-106.
[
|
| [37] |
吕大国, 耿强, 简泽, 等. 市场规模、劳动力成本与异质性企业区位选择: 中国地区经济差距与生产率差距之谜的一个解释[J]. 经济研究, 2019, 54(2): 36-53.
[
|
| [38] |
|
| [39] |
郭然, 原毅军. 互联网发展对产业协同集聚的影响及其机制研究[J]. 统计研究, 2022, 39(6): 52-67.
[
|
| [40] |
孙赫, 梁红梅, 常学礼, 等. 中国土地利用碳排放及其空间关联[J]. 经济地理, 2015, 35(3): 154-162.
[
|
| [41] |
余红伟, 林子祥, 胡力元, 等. 高质量发展下中国工业企业碳减排路径选择[J]. 中国软科学, 2024, (1): 214-224.
[
|
/
| 〈 |
|
〉 |