
Spatiotemporal transition of China’s industrial intelligence and the driving mechanism
Received date: 2023-09-07
Revised date: 2024-02-02
Online published: 2024-06-26
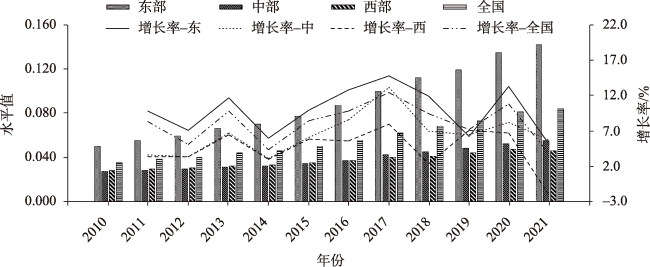
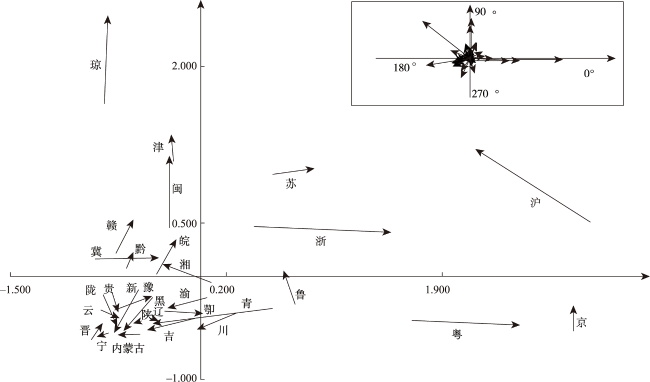
[Objective] The objective of this study was to clarify the characteristics of the spatiotemporal transition of industrial intelligence in China and its driving mechanism, and provided a reference basis for promoting the coordinated regional development of industrial intelligence. [Methods] On the basis of measuring the industrial intelligence level of 30 provinces in China from 2010 to 2021, this study investigated the spatiotemporal transition characteristics of industrial intelligence by using exploratory spatiotemporal data analysis (ESTDA). We then used quantile regression with spatiotemporal transition mosaic model to explore the driving mechanism of the spatiotemporal transition. [Results] The results show that: (1) From 2010 to 2021, China’s industrial intelligence level as a whole showed an upward trend, and the growth rate exhibited a fluctuating growth trend. Spatially, the distribution exhibited an unbalanced pattern of “advanced in the east and weak in the central region and the west”. (2) The results of spatiotemporal transition analysis indicated that China’s industrial intelligence had powerful path-locking and spatial dependence characteristics. Most western provinces were always locked in the “club” of low intelligence attributes. The change of spatial pattern of industrial intelligence in China showed strong integration characteristics, in which positive synergistic transition was the main development mode. (3) Mechanism analysis revealed that the driving and restricting modes of spatiotemporal transition of industrial intelligence varied among different regions. The spatiotemporal transition in most eastern coastal provinces was mainly “economic level, opening up, and regional innovation” driven, while the resistance of spatiotemporal transition in most central and western provinces primarily arose from the restricting mode of “industrial structure”. The spatiotemporal transition pattern of industrial intelligence from the east to the west presented a trapezoidal evolution pattern from “same direction development” to “same direction constraints”. [Conclusion] China’s industrial intelligence still has a large room for improvement. Therefore, in the future, there is an urgent need to address the geographical disadvantages according to local conditions, break through the spatial path of locking in. Meanwhile, it is also necessary to strengthen the integration of industrial digitalization and intelligence, and form industrial development synergies to promote the development of industrial intelligence.
LI Liping , DENG Zongbing , XIAO Qinlin . Spatiotemporal transition of China’s industrial intelligence and the driving mechanism[J]. Resources Science, 2024 , 46(5) : 936 -947 . DOI: 10.18402/resci.2024.05.07
表1 工业智能化指标体系Table 1 Industrial intelligence indicator system |
| 目标层 | 准则层 | 指标层 | 指标解释 | 属性 | 单位 |
|---|---|---|---|---|---|
| 工业智能化 | 智能化基础 | 网络基础 | 光纤线路长度与年末户籍人口数之比 | + | m/人 |
| 智能投资 | 高技术制造业R&D经费 | + | 万元 | ||
| 专业人才 | 计算机服务和软件从业人员占从业人员总数的比重 | + | % | ||
| 智能化运用 | 智能设备利用 | 制造业企业机器账面价值与企业员工总数之比 | + | 万元/人 | |
| 新产品生产 | 工业新产品销售收入占工业企业主营业务收入的比重 | + | % | ||
| 智能软件运用 | 基础软件、支撑软件和嵌入式应用软件等产品的收入占所有工业企业主营业务收入的比重 | + | % | ||
| 智能化效益 | 经济效益 | 智能制造企业的主营业务收入占全国工业企业的主营业务收入的比重 | + | % | |
| 社会效益 | 智能制造企业税收总额 | + | 万元 | ||
| 智能制造企业从业人员数量占所有从业人员的比重 | + | % | |||
| 环境效益 | 工业单位GDP能源消耗 | - | tce/万元 |
表2 时空跃迁类型与高低分位数回归模型的嵌套Table 2 Nesting of spatiotemporal transition types and high/low quantile regression models |
| 响应类型 | 驱动类型 | 跃迁类型 | 发展类型 |
|---|---|---|---|
| 高分位响应 | 高分位驱动 | HH→HL | 反向发展 |
| HH→HH | 同向发展 | ||
| HL→HL | 反向发展 | ||
| HL→HH | 同向发展 | ||
| 高分位制约 | HH→LH | 反向发展 | |
| HH→LL | 同向制约 | ||
| HL→LL | 同向制约 | ||
| HL→LH | 反向发展 | ||
| 低分位响应 | 低分位驱动 | LH→HL | 反向发展 |
| LH→HH | 同向发展 | ||
| LL→HL | 反向发展 | ||
| LL→HH | 同向发展 | ||
| 低分位制约 | LH→LL | 同向制约 | |
| LH→LH | 反向发展 | ||
| LL→LH | 反向发展 | ||
| LL→LL | 同向制约 |
表3 LISA时间路径相对长度和弯曲度测算结果Table 3 Results of relative length and curvature of the local indicators of spatial association (LISA) time path |
| 省(市、区) | 相对长度 | 弯曲度 | 省(市、区) | 相对长度 | 弯曲度 |
|---|---|---|---|---|---|
| 北京 | 1.679 | 6.288 | 湖南 | 1.070 | 2.154 |
| 天津 | 1.127 | 4.016 | 广东 | 2.037 | 2.150 |
| 河北 | 0.806 | 1.453 | 广西 | 0.866 | 4.659 |
| 山西 | 0.519 | 3.027 | 海南 | 2.033 | 2.147 |
| 内蒙古 | 0.422 | 2.449 | 重庆 | 1.938 | 5.481 |
| 辽宁 | 0.609 | 12.641 | 四川 | 0.752 | 1.738 |
| 吉林 | 0.711 | 1.643 | 贵州 | 0.490 | 2.492 |
| 黑龙江 | 0.533 | 1.452 | 云南 | 0.566 | 3.011 |
| 上海 | 2.247 | 1.763 | 陕西 | 0.597 | 8.223 |
| 江苏 | 0.935 | 2.525 | 甘肃 | 0.541 | 1.523 |
| 浙江 | 1.375 | 1.150 | 青海 | 1.770 | 1.683 |
| 安徽 | 0.564 | 1.363 | 宁夏 | 0.601 | 4.544 |
| 福建 | 1.163 | 1.518 | 新疆 | 1.053 | 2.066 |
| 江西 | 0.827 | 2.084 | 东部 | 1.369 | 3.500 |
| 山东 | 1.047 | 2.847 | 中部 | 0.668 | 1.875 |
| 河南 | 0.542 | 1.519 | 西部 | 0.873 | 3.443 |
| 湖北 | 0.579 | 1.758 | 全国 | 1.000 | 3.046 |
表4 省域工业智能化的Moran’s I转移概率矩阵Table 4 Local Moran’s I transfer probability matrix of industrial intelligence in provinces |
| 类型 | 省(市、区)数量/个 | HHt+1 | LHt+1 | LLt+1 | HLt+1 | 类型 | 省(市、区)数量/个 | 比例/% |
|---|---|---|---|---|---|---|---|---|
| HHt | 3 | IV(100.0) | I(0.0) | III(0.0) | II(0.0) | I | 4 | 13.3 |
| LHt | 8 | I(0.0) | IV(100.0) | II(0.0) | III(0.0) | II | 0 | 0.0 |
| LLt | 12 | III(0.0) | II(0.0) | IV(91.7) | I(8.3) | III | 1 | 3.4 |
| HLt | 7 | II(0.0) | III(14.3) | I(42.8) | IV(42.9) | IV | 25 | 83.3 |
注:括号内为Moran’s I转移概率,单位为%。 |
表5 中国工业智能化发展驱动因素的分位数回归结果Table 5 Quantile regression results of driving factors of China’s industrial intelligence level |
| 分位点 | 经济水平 | 对外开放 | 人口老龄化 | 区域创新 | 产业结构 |
|---|---|---|---|---|---|
| 0.1 | 0.0063** | 0.0019 | 0.0019*** | 0.0017*** | -0.0179** |
| (0.0025) | (0.0033) | (0.0003) | (0.0001) | (0.0088) | |
| 0.2 | 0.0044 | 0.0117*** | 0.0015*** | 0.0021*** | -0.0239** |
| (0.0031) | (0.0041) | (0.0004) | (0.0001) | (0.0109) | |
| 0.3 | 0.0054* | 0.0185*** | 0.0012*** | 0.0024*** | -0.0370*** |
| (0.0032) | (0.0042) | (0.0004) | (0.0001) | (0.0110) | |
| 0.4 | 0.0052 | 0.0311*** | 0.0013*** | 0.0025*** | -0.0424*** |
| (0.0036) | (0.0047) | (0.0004) | (0.0001) | (0.0125) | |
| 0.5 | 0.0097*** | 0.0388*** | 0.0012*** | 0.0024*** | -0.0497*** |
| (0.0036) | (0.0047) | (0.0004) | (0.0001) | (0.0125) | |
| 0.6 | 0.0124*** | 0.0408*** | 0.0010 | 0.0027*** | -0.0536*** |
| (0.0036) | (0.0048) | (0.0004) | (0.0001) | (0.0126) | |
| 0.7 | 0.0124 | 0.0456*** | 0.0014** | 0.0027*** | -0.0715*** |
| (0.0053) | (0.0069) | (0.0006) | (0.0002) | (0.0183) | |
| 0.8 | 0.0136 | 0.0622*** | 0.0009 | 0.0027*** | -0.1083*** |
| (0.0107) | (0.0142) | (0.0013) | (0.0003) | (0.0374) | |
| 0.9 | 0.0295*** | 0.0700*** | -0.0013 | 0.0022*** | -0.2194*** |
| (0.0113) | (0.0149) | (0.0014) | (0.0004) | (0.0393) |
注:***、**、*分别表示在1%、5%和10%水平上显著,括号内为标准误。 |
| [1] |
|
| [2] |
|
| [3] |
杨春蕾, 佟继英. 工业智能化与全球碳减排[J]. 经济经纬, 2024, 41(1): 110-119.
[
|
| [4] |
|
| [5] |
陈晓, 郑玉璐, 姚笛. 工业智能化、劳动力就业结构与经济增长质量: 基于中介效应模型的实证检验[J]. 华东经济管理, 2020, 34(10): 56-64.
[
|
| [6] |
罗良文, 张郑秋, 周倩. 产业智能化与城市低碳经济转型[J]. 经济管理, 2023, 45(5): 43-60.
[
|
| [7] |
|
| [8] |
李晓娣, 原媛. 营商环境生态驱动制造业智能化的组态路径研究[J]. 科学学研究, 2024, 42(4): 746-756.
[
|
| [9] |
罗良文, 张郑秋. 中国城市产业智能化空间关联网络及其驱动机制[J]. 财经研究, 2024, 50(1): 109-123.
[
|
| [10] |
|
| [11] |
|
| [12] |
史丹, 叶云岭. 人工智能、就业结构与高质量发展[J]. 当代财经, 2023, (5): 3-14.
[
|
| [13] |
王书斌. 工业智能化升级与城市层级结构分化[J]. 世界经济, 2020, 43(12): 102-125.
[
|
| [14] |
何小钢, 王善骝. 信息技术生产率悖论: 理论演进与跨越路径[J]. 经济学家, 2020, (7): 42-52.
[
|
| [15] |
杨承佳. 中国制造业智能化水平、区域差异及分布动态演进[J]. 统计与决策, 2024, 40(6): 104-109.
[
|
| [16] |
占华, 后梦婷, 檀菲菲. 智能化发展对中国企业绿色创新的影响: 基于新能源产业上市公司的证据[J]. 资源科学, 2022, 44(5): 984-993.
[
|
| [17] |
郑玉, 孙瑾瑾. 中国制造业智能化发展水平测度及其时空演化分析[J]. 统计与决策, 2023, 39 (11): 89-93.
[
|
| [18] |
刘军, 钱宇, 曹雅茹, 等. 中国制造业智能化驱动因素及其区域差异[J]. 中国科技论坛, 2022, (1): 84-93.
[
|
| [19] |
高运胜, 杨阳. 全球价值链重构背景下我国制造业高质量发展目标与路径研究[J]. 经济学家, 2020, (10): 65-74.
[
|
| [20] |
王松茂, 尹延晓, 徐宣国. 数字经济能促进城乡融合吗? 以长江经济带11个省份为例[J]. 中国软科学, 2023, (5): 77-87.
[
|
| [21] |
戴翔, 王如雪. 人工智能条件下人口老龄化对全球价值链攀升的影响[J]. 经济管理, 2023, 45(3): 28-43.
[
|
| [22] |
苏屹, 支鹏飞, 郭秀芳. 区域数字经济规模测算及其对区域创新的影响[J]. 科研管理, 2023, 44(9): 29-38.
[
|
| [23] |
吕荣杰, 郝力晓. 中国人工智能发展的空间关联特征及其形成机制[J]. 软科学, 2022, 36(2): 15-22.
[
|
| [24] |
韩璟, 陈泽秀, 卢新海. 中国海外耕地投资发展的时空格局演变与影响因素[J]. 资源科学, 2020, 42(9): 1715-1727.
[
|
| [25] |
|
| [26] |
张子昂, 黄震方, 曹芳东, 等. 浙江省县域入境旅游时空跃迁特征及驱动机制[J]. 地理研究, 2016, 35(6): 1177-1192.
[
|
| [27] |
黄群慧, 黄阳华, 贺俊, 等. 面向中上等收入阶段的中国工业化战略研究[J]. 中国社会科学, 2017, (12): 94-116.
[
|
/
| 〈 |
|
〉 |