
The influencing factors and formation mechanism of national well-being from production-living-ecological perspective
Received date: 2023-09-01
Revised date: 2024-02-20
Online published: 2024-06-26
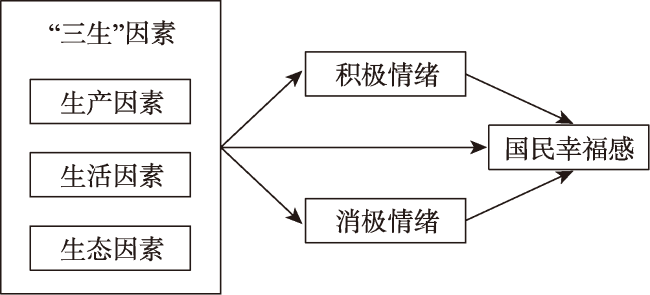
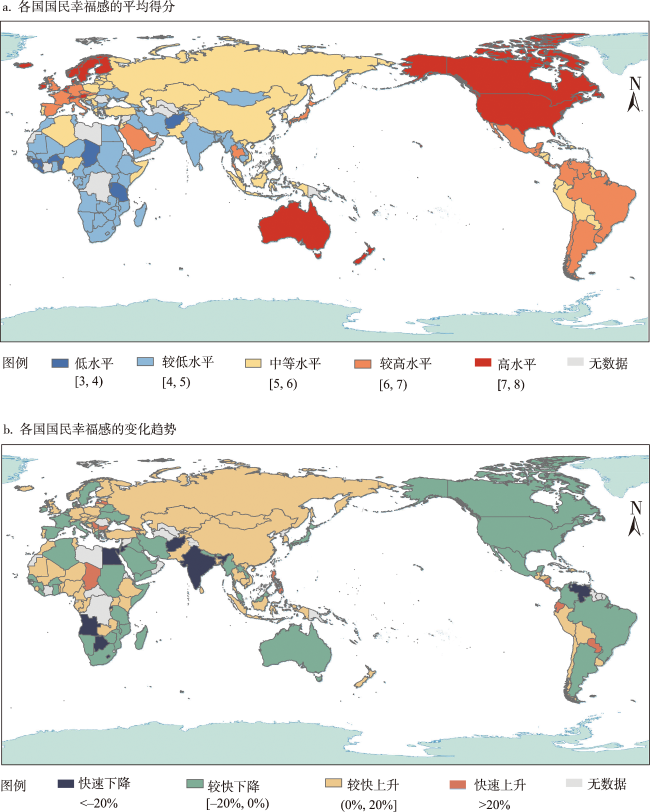
[Objective] By analyzing the influencing factors of national well-being and its formation mechanism, this study aimed to provide a reference basis for governments to formulate targeted strategies to improve national well-being. [Methods] Based on the human’s production-living-ecological space, this study proposed an analytical framework from the production-living-ecological perspective. Employing the aggregated national well-being data of 146 countries in 2005-2018, this study used the two-way fixed effects model and stepwise causality test to analyze the influence of production-living-ecological factors on national well-being and its mechanism. [Results] The results show that: (1) In the spatial dimension, the pattern of global national well-being is characterized by the tripolar distribution of northern Europe, northern America, and Oceania. Most western and southern Asian and African countries have low levels of national well-being; In the temporal dimension, global national well-being showed a trend towards diversification, and the temporal trends of national well-being varied obviously across countries within each continent. (2) Among production factors, a higher Gini index of income is detrimental to national well-being; Among living factors, social support promotes national well-being while the unemployment rate hinders national well-being; Among ecological factors, more land green area per capita is beneficial for national well-being. The GDP growth and Gini index of income have greater effect sizes in developing countries than in developed countries. (3) Positive and negative affect play mediation roles in the relationships between production-living-ecological factors and national well-being. Inflation rate, unemployment rate, years of education, and carbon emission intensity are negatively associated with national well-being through emotional variables, while social support, governance capacity of governments, child-age dependency ratio, and land green area per capita have indirect and positive effects on national well-being. [Conclusion] Therefore, China should adhere to the development path of production development, affluent living, and ecological sustainability, which is conducive to maximizing national well-being.
LIU Jiahang , YIN Chun , SUN Bindong . The influencing factors and formation mechanism of national well-being from production-living-ecological perspective[J]. Resources Science, 2024 , 46(5) : 910 -923 . DOI: 10.18402/resci.2024.05.05
表1 变量描述性统计Table 1 Descriptive statistics of variables |
| 变量名称 | 单位 | 样本量 | 平均值 | 标准差 | 最小值 | 最大值 | 数据来源 |
|---|---|---|---|---|---|---|---|
| 被解释变量 | |||||||
| 国民幸福感 | — | 1405 | 5.55 | 1.12 | 2.66 | 8.02 | GWP |
| 生产因素 | |||||||
| 人均GDP,取对数 | 美元/人 | 1378 | 9.47 | 1.12 | 6.72 | 11.66 | WDI |
| 人均GDP增长率 | % | 1396 | 2.46 | 3.83 | -22.31 | 33.03 | WDI |
| 通货膨胀率 | % | 1375 | 5.67 | 13.91 | -8.97 | 380.00 | WDI |
| 收入基尼系数 | — | 1405 | 37.86 | 7.90 | 22.90 | 64.60 | SWIID |
| 生活因素 | |||||||
| 社会支持程度 | — | 1395 | 0.82 | 0.12 | 0.29 | 0.99 | GWP |
| 失业率 | % | 1405 | 7.76 | 5.63 | 0.25 | 34.93 | WDI |
| 政府治理能力 | — | 1405 | 0.10 | 0.97 | -2.13 | 2.18 | WGI |
| 受教育年限 | 年 | 1402 | 8.95 | 3.25 | 0.56 | 14.13 | HDR |
| 公共卫生支出比例 | % | 1392 | 3.64 | 2.27 | 0.29 | 9.28 | WDI |
| 人均健康预期寿命 | 岁 | 1405 | 63.37 | 7.21 | 6.72 | 73.97 | GWP |
| 少年人口抚养比 | — | 1405 | 43.51 | 22.79 | 14.92 | 106.53 | WDI |
| 生态因素 | |||||||
| 碳排放强度,取对数 | kg/美元 | 1387 | -1.00 | 0.72 | -3.00 | 1.03 | WDI |
| PM2.5浓度,取对数 | μg/m3 | 1405 | 3.05 | 0.68 | 1.57 | 4.70 | SEDAC |
| 人均国土绿化面积,取对数 | km2/人 | 1356 | -5.27 | 1.61 | -12.27 | -1.26 | FAOSTAT |
| 可再生能源发电比例 | % | 1405 | 36.93 | 31.39 | 0.00 | 100.00 | Ember |
| 中介变量 | |||||||
| 积极情绪 | — | 1388 | 0.66 | 0.11 | 0.35 | 0.88 | GWP |
| 消极情绪 | — | 1395 | 0.26 | 0.08 | 0.11 | 0.56 | GWP |
表2 国民幸福感的固定效应回归结果Table 2 Fixed effects regression results of national well-being |
| 模型1 | 模型2 | 模型3 | 模型4 | |
|---|---|---|---|---|
| 生产因素 | ||||
| 人均GDP | 0.951*** | 0.389 | ||
| (0.274) | (0.256) | |||
| 人均GDP增长率 | 0.009** | 0.004 | ||
| (0.005) | (0.004) | |||
| 通货膨胀率 | -0.006** | -0.004 | ||
| (0.003) | (0.003) | |||
| 收入基尼系数 | -0.048** | -0.051*** | ||
| (0.019) | (0.017) | |||
| 生活因素 | ||||
| 社会支持程度 | 1.952*** | 1.867*** | ||
| (0.304) | (0.310) | |||
| 失业率 | -0.047*** | -0.039*** | ||
| (0.007) | (0.007) | |||
| 政府治理能力 | 0.446** | 0.199 | ||
| (0.219) | (0.170) | |||
| 受教育年限 | -0.071 | -0.019 | ||
| (0.086) | (0.065) | |||
| 公共卫生支出比例 | 0.019 | 0.010 | ||
| (0.029) | (0.027) | |||
| 人均健康预期寿命 | -0.015 | -0.009 | ||
| (0.023) | (0.022) | |||
| 少年人口抚养比 | 0.006 | 0.008 | ||
| (0.008) | (0.008) | |||
| 生态因素 | ||||
| 碳排放强度 | 0.024 | 0.056 | ||
| (0.151) | (0.128) | |||
| PM2.5浓度 | -0.050 | -0.052 | ||
| (0.157) | (0.142) | |||
| 人均国土绿化面积 | 1.042*** | 0.734** | ||
| (0.345) | (0.332) | |||
| 可再生能源发电比例 | -0.002 | 0.001 | ||
| (0.003) | (0.003) | |||
| 常数项 | -1.401 | 5.582*** | 11.397*** | 7.022** |
| (2.941) | (1.596) | (1.855) | (3.310) | |
| 年份控制 | YES | YES | YES | YES |
| 国家控制 | YES | YES | YES | YES |
| 样本量 | 1353 | 1382 | 1338 | 1295 |
| 国家数量 | 142 | 146 | 141 | 136 |
| R2 | 0.109 | 0.196 | 0.064 | 0.238 |
注:***、**、*分别表示在1%、5%和10%的水平下通过显著性检验,括号内为稳健标准误。人均GDP、碳排放强度、PM2.5浓度、人均国土绿化面积已作对数处理。下同。 |
表3 “三生”因素与国民幸福感之间关联的稳健性检验Table 3 Robustness tests of the relationships between production-living-ecological factors and national well-being |
| 模型1 (改变时间 序列) | 模型2 (替换被 解释变量) | 模型3 (滞后解 释变量) | |
|---|---|---|---|
| 生产因素 | |||
| 人均GDP | 0.333 | -3.164 | 0.241 |
| (0.257) | (10.973) | (0.317) | |
| 人均GDP增长率 | 0.005 | 0.319** | 0.013** |
| (0.004) | (0.145) | (0.005) | |
| 通货膨胀率 | -0.004 | -0.104 | -0.001 |
| (0.003) | (0.134) | (0.004) | |
| 收入基尼系数 | -0.051*** | -1.568** | -0.041** |
| (0.017) | (0.617) | (0.017) | |
| 生活因素 | |||
| 社会支持程度 | 1.865*** | 60.340*** | 0.777** |
| (0.313) | (11.359) | (0.343) | |
| 失业率 | -0.040*** | -1.507*** | -0.029*** |
| (0.008) | (0.318) | (0.008) | |
| 政府治理能力 | 0.208 | 0.014 | 0.387** |
| (0.172) | (5.758) | (0.165) | |
| 受教育年限 | -0.014 | -3.552 | -0.005 |
| (0.068) | (2.919) | (0.082) | |
| 公共卫生支出比例 | 0.018 | 3.313*** | 0.004 |
| (0.027) | (1.165) | (0.032) | |
| 人均健康预期 寿命 | -0.009 | -1.583 | -0.071*** |
| (0.022) | (1.071) | (0.023) | |
| 少年人口抚养比 | 0.009 | 0.230 | 0.017* |
| (0.008) | (0.291) | (0.010) | |
| 生态因素 | |||
| 碳排放强度 | 0.063 | -10.882*** | 0.143 |
| (0.127) | (4.125) | (0.156) | |
| PM2.5浓度 | -0.043 | -6.967 | 0.096 |
| (0.144) | (6.212) | (0.135) | |
| 人均国土绿化面积 | 0.695** | 25.437** | 0.934** |
| (0.345) | (12.331) | (0.448) | |
| 可再生能源发电比例 | 0.001 | 0.058 | 0.003 |
| (0.003) | (0.077) | (0.004) | |
| 常数项 | 6.884** | 288.467* | 12.596*** |
| (3.372) | (148.048) | (4.260) | |
| 年份控制 | YES | YES | YES |
| 国家控制 | YES | YES | YES |
| 样本量 | 1271 | 1295 | 1058 |
| 国家数量 | 136 | 136 | 129 |
| R2 | 0.231 | 0.658 | 0.168 |
表4 “三生”因素与国民幸福感之间关联的异质性分析Table 4 Heterogeneity analysis results of the relationships between production-living-ecological factors and national well-being |
| 模型1 (发达国家) | 模型2 (发展中国家) | |
|---|---|---|
| 生产因素 | ||
| 人均GDP | 0.612 | 0.337 |
| (0.459) | (0.344) | |
| 人均GDP增长率 | -0.003 | 0.009* |
| (0.007) | (0.005) | |
| 通货膨胀率 | -0.021 | -0.004 |
| (0.018) | (0.004) | |
| 收入基尼系数 | -0.004 | -0.059*** |
| (0.026) | (0.021) | |
| 生活因素 | ||
| 社会支持程度 | 3.272*** | 1.785*** |
| (0.691) | (0.314) | |
| 失业率 | -0.049*** | -0.027** |
| (0.009) | (0.010) | |
| 政府治理能力 | 0.197 | 0.138 |
| (0.159) | (0.202) | |
| 受教育年限 | 0.033 | -0.068 |
| (0.064) | (0.090) | |
| 公共卫生支出比例 | -0.016 | 0.028 |
| (0.045) | (0.036) | |
| 人均健康预期寿命 | 0.002 | -0.013 |
| (0.065) | (0.026) | |
| 少年人口抚养比 | -0.012 | 0.011 |
| (0.020) | (0.009) | |
| 生态因素 | ||
| 碳排放强度 | 0.380 | -0.007 |
| (0.307) | (0.136) | |
| PM2.5浓度 | -0.130 | -0.101 |
| (0.126) | (0.184) | |
| 人均国土绿化面积 | 0.568 | 0.544 |
| (0.560) | (0.390) | |
| 可再生能源发电比例 | 0.002 | 0.001 |
| (0.003) | (0.004) | |
| 常数项 | 1.254 | 7.020 |
| (7.453) | (4.435) | |
| 年份控制 | YES | YES |
| 国家控制 | YES | YES |
| 样本量 | 350 | 945 |
| 国家数量 | 32 | 109 |
| R2 | 0.511 | 0.197 |
表5 “三生”因素影响国民幸福感的机制Table 5 Mechanisms of production-living-ecological factors influencing national well-being |
| 模型1 (积极 情绪) | 模型2 (国民 幸福感) | 模型3 (消极 情绪) | 模型4 (国民 幸福感) | |
|---|---|---|---|---|
| 中介变量 | ||||
| 积极情绪 | 0.899*** | |||
| (0.308) | ||||
| 消极情绪 | -1.486*** | |||
| (0.386) | ||||
| 生产因素 | ||||
| 人均GDP | 0.039 | 0.362 | -0.007 | 0.362 |
| (0.029) | (0.257) | (0.024) | (0.245) | |
| 人均GDP增长率 | -0.000 | 0.005 | -0.001 | 0.004 |
| (0.000) | (0.004) | (0.000) | (0.004) | |
| 通货膨胀率 | -0.001** | -0.004 | 0.000 | -0.004 |
| (0.000) | (0.003) | (0.000) | (0.003) | |
| 收入基尼系数 | -0.001 | -0.050*** | 0.003 | -0.046*** |
| (0.002) | (0.016) | (0.002) | (0.016) | |
| 生活因素 | ||||
| 社会支持程度 | 0.100** | 1.790*** | -0.179*** | 1.592*** |
| (0.045) | (0.320) | (0.033) | (0.310) | |
| 失业率 | -0.001* | -0.038*** | 0.004*** | -0.033*** |
| (0.001) | (0.007) | (0.001) | (0.007) | |
| 政府治理能力 | 0.033* | 0.161 | 0.014 | 0.221 |
| (0.019) | (0.172) | (0.015) | (0.168) | |
| 受教育年限 | -0.016** | -0.002 | -0.006 | -0.032 |
| (0.006) | (0.067) | (0.006) | (0.062) | |
| 公共卫生支出比例 | 0.005 | 0.007 | 0.001 | 0.012 |
| (0.003) | (0.026) | (0.003) | (0.026) | |
| 人均健康预期寿命 | 0.001 | -0.011 | 0.001 | -0.008 |
| (0.002) | (0.023) | (0.002) | (0.020) | |
| 少年人口抚养比 | -0.000 | 0.009 | -0.003*** | 0.003 |
| (0.001) | (0.008) | (0.001) | (0.008) | |
| 生态因素 | ||||
| 碳排放强度 | -0.025* | 0.075 | 0.031** | 0.096 |
| (0.014) | (0.123) | (0.014) | (0.125) | |
| PM2.5浓度 | -0.001 | -0.059 | 0.021 | -0.025 |
| (0.015) | (0.140) | (0.014) | (0.138) | |
| 人均国土绿化面积 | 0.065** | 0.679** | -0.124*** | 0.546 |
| (0.030) | (0.339) | (0.036) | (0.333) | |
| 可再生能源发电比例 | -0.000 | 0.001 | 0.000 | 0.001 |
| (0.000) | (0.003) | (0.000) | (0.003) | |
| 常数项 | 0.631* | 6.386* | -0.242 | 6.835** |
| (0.340) | (3.404) | (0.310) | (3.249) | |
| 年份控制 | YES | YES | YES | YES |
| 国家控制 | YES | YES | YES | YES |
| 样本量 | 1287 | 1287 | 1293 | 1293 |
| 国家数量 | 136 | 136 | 136 | 136 |
| R2 | 0.120 | 0.248 | 0.274 | 0.260 |
| [1] |
|
| [2] |
|
| [3] |
|
| [4] |
|
| [5] |
|
| [6] |
|
| [7] |
|
| [8] |
|
| [9] |
|
| [10] |
|
| [11] |
|
| [12] |
|
| [13] |
|
| [14] |
|
| [15] |
|
| [16] |
钟敬秋, 高梦凡, 韩增林, 等. 基于生态系统文化服务的人地关系空间重构[J]. 地理学报, 2024, 79(1): 1-18.
[
|
| [17] |
|
| [18] |
|
| [19] |
|
| [20] |
|
| [21] |
|
| [22] |
|
| [23] |
|
| [24] |
|
| [25] |
|
| [26] |
赵宏波, 魏甲晨, 孙东琪, 等. 大城市内部“生产-生活-生态空间”多尺度耦合协调度: 以郑州市为例[J]. 资源科学, 2021, 43(5): 944-953.
[
|
| [27] |
|
| [28] |
|
| [29] |
马丽梅, 黄崇乐. 金融驱动与可再生能源发展: 基于跨国数据的动态演化分析[J]. 中国工业经济, 2022, (4): 118-136.
[
|
| [30] |
宋成镇, 刘庆芳, 马伟, 等. 技术创新对黄河流域地区和长江经济带碳生产率影响路径比较: 基于数字金融的中介效应[J]. 资源科学, 2024, 46(3): 450-461.
[
|
| [31] |
曹婧博, 康琛宇. 数字经济驱动中国资源型城市高质量发展的门槛效应[J]. 资源科学, 2023, 45(11): 2234-2247.
[
|
| [32] |
|
| [33] |
|
| [34] |
陈晓东, 张春香. 不平等如何影响居民幸福感? 基于个体不平等指数的经验研究[J]. 华中科技大学学报(社会科学版), 2020, 34(3): 78-86.
[
|
| [35] |
|
| [36] |
|
| [37] |
|
| [38] |
龚梦柯, 吴建平, 南海龙. 森林环境对人体健康影响的实证研究[J]. 北京林业大学学报(社会科学版), 2017, 16(4): 44-51.
[
|
| [39] |
|
| [40] |
|
| [41] |
郭蕾, 肖有智. 采用生活满意度法评估碳排放对居民幸福感的影响研究: 基于微观调查的幸福感数据[J]. 价格理论与实践, 2021, (7): 28-33.
[
|
| [42] |
|
| [43] |
|
| [44] |
|
| [45] |
|
| [46] |
|
| [47] |
|
| [48] |
|
| [49] |
刘畅, 李树华. 多学科视角下的恢复性自然环境研究综述[J]. 中国园林, 2020, 36(1): 55-59.
[
|
| [50] |
王一鸣. 百年大变局、高质量发展与构建新发展格局[J]. 管理世界, 2020, 36(12): 1-13.
[
|
| [51] |
丁敏, 李包庚. 论习近平人民幸福观的核心要义与时代价值[J]. 河海大学学报(哲学社会科学版), 2022, 24(1): 1-10.
[
|
| [52] |
胡鞍钢. 中国实现2030年前碳达峰目标及主要途径[J]. 北京工业大学学报(社会科学版), 2021, 21(3): 1-15.
[
|
| [53] |
郑德凤, 王燕燕, 曹永强, 等. 基于生态系统服务的生态福祉分类与时空格局: 以中国地级及以上城市为例[J]. 资源科学, 2020, 42(6): 1110-1122.
[
|
/
| 〈 |
|
〉 |