
Dynamic characteristics and differentiation of construction land supply in shrinking small and medium-sized cities
Received date: 2023-12-01
Revised date: 2024-01-24
Online published: 2024-03-21
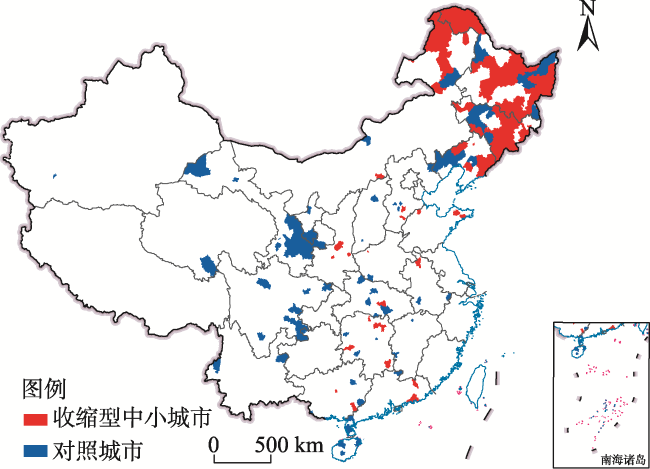
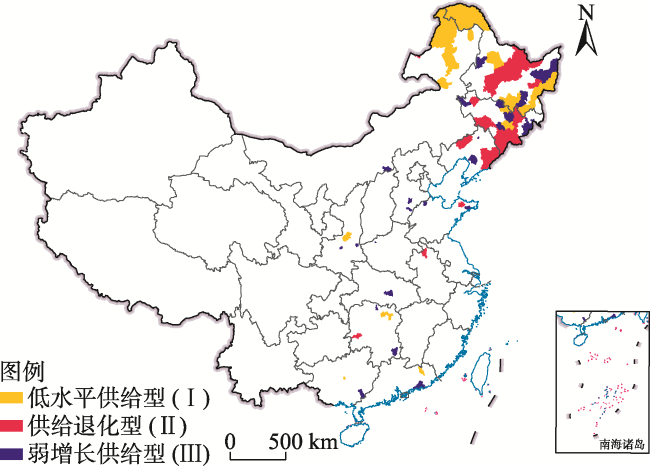
[Objective] The contradiction between population shrinkage and construction land expansion is common in shrinking small and medium-sized cities. Analyzing the dynamic characteristics of construction land supply is an important basis for understanding the mechanism of change. [Methods] Using data from www.landchina.com, this study employed the propensity score matching model to choose control cities, and analyzed the dynamic characteristics of construction land supply in 71 shrinking small and medium-sized cities (that is, inter-group differences). Then, based on panel clustering analysis, this study explored the differential characteristics of construction land supply within these shrinking small and medium-sized cities (that is, intra-group differences). Finally, this study used Logistic regression to analyze the potential factors contributing to inter-group and intra-group differences. [Results] (1) The construction land supply of shrinking small and medium-sized cities has the following outstanding characteristics compared with the control cities: a decreasing trend in the supply of construction land, a significant slowdown in price growth, an increasing trend of non-market-oriented supply, and a faster expansion of non-business and non-industrial land supply. Among them, the shrinking cities in Northeast China showed both the general land supply trends of shrinking cities, and regional characteristics of larger land supply scale generally at lower prices. (2) This study categorized the 71 shrinking small and medium-sized cities into three types: low-level supply cities, declining supply cities, and weak growth supply cities. Cities of the first type are mostly traditional agricultural cities, which had a lower level of construction land market development. Cities of the second type are mostly resource-based industrial decline cities, which had a declining construction land market. Cities of the third type mostly experience population outflow within a growing region, which had a stable construction land market but a risk of decline. (3) Demand factors such as population and industrial development are the main factors contributing to inter-group differences, while intra-group differences are mainly associated with government supply factors and the level of industrial development. [Conclusion] Shrinking small and medium-sized cities exhibit both common features and internal diversity and differences in construction land supply. While the construction land supply can be temporarily changed by local governments, it tends to return to the actual level determined by the development conditions over a longer period. Therefore, the population-land use growth paradox in these cities will be corrected to some extent. Based on the conclusion, this article also proposed some policy recommendations for the spatial planning and urban renewal of shrinking small and medium-sized cities.
ZHOU Zhen , CHEN Hao , WANG Lei . Dynamic characteristics and differentiation of construction land supply in shrinking small and medium-sized cities[J]. Resources Science, 2024 , 46(2) : 321 -335 . DOI: 10.18402/resci.2024.02.07
表1 收缩型中小城市名单Table 1 List of shrinking small and medium-sized cities |
| 城市类型 | 省份 | 城市 |
|---|---|---|
| 地级市 | 黑龙江省 | 鸡西市、鹤岗市、双鸭山市、伊春市、七台河市、绥化市、大兴安岭地区 |
| 辽宁市 | 本溪市、丹东市、阜新市 | |
| 吉林省 | 四平市、通化市、白山市 | |
| 陕西省 | 铜川市 | |
| 安徽省 | 淮北市 | |
| 广东省 | 汕尾市 | |
| 县级市 | 黑龙江省 | 尚志市、五常市、讷河市、虎林市、铁力市、绥芬河市、海林市、宁安市、穆棱市、北安市、五大连池市、安达市、肇东市、海伦市 |
| 吉林省 | 榆树市、蛟河市、桦甸市、舒兰市、磐石市、双辽市、集安市、临江市、洮南市、大安市、图们市、敦化市、龙井市、和龙市 | |
| 内蒙古自治区 | 满洲里市、牙克石市、额尔古纳市、根河市、丰镇市、阿尔山市 | |
| 湖南省 | 汨罗市、津市市、沅江市、资兴市、洪江市 | |
| 辽宁省 | 海城市、大石桥市、调兵山市 | |
| 河北省 | 南宫市、深州市 | |
| 山东省 | 栖霞市、乳山市、乐陵市 | |
| 陕西省 | 兴平市、华阴市 | |
| 广西壮族自治区 | 北流市、合山市 | |
| 广东省 | 兴宁市、陆丰市 | |
| 河南省 | 义马市 | |
| 湖北省 | 天门市 |
注:黑龙江省双城市和河北省冀州市在研究期内撤县设区,故剔除。 |
表2 时间特征提取Table 2 Temporal feature extraction |
| 特征量 | 计算公式 | 变量含义 |
|---|---|---|
| 绝对量 | 式中:AQFi为城市样本i在研究期的绝对水平;Si,t为样本i在年份t的取值;T为年份跨度 | |
| 趋势 | 式中:TFi为样本i在研究期指标的长期变动趋势; 为样本i在T年间的平均值 | |
| 波动性 | | 式中:VFi为样本i在研究期指标随时间变化的波动程度 |
| 偏度 | | 式中:SCFi为样本i在研究期指标的对称性;σi为样本i在T年间的年际标准差 |
| 峰度 | 式中:KCFi为样本i在研究期分布曲线的陡峭程度 |
表3 收缩型中小城市建设用地供应影响因素Table 3 Influencing factors of construction land supply in shrinking small and medium-sized cities |
| 因素 | 变量 | 指标 | 单位 |
|---|---|---|---|
| 政府供给 | 政府财政压力 | 一般公共预算收支差与收入的比值 | % |
| 政府投资强度 | 固定资产投资额与GDP的比值 | % | |
| 发展需求 | 产业结构 | 第三产业增加值与第二产业增加值的比值 | % |
| 人口流入水平 | “人在户不在”人口与常住人口的比值 | % | |
| 城镇人口的变化 | 城镇人口变化率 | % | |
| 房地产建设 | 人均住房面积增量 | m2/人 | |
| 居民购买力 | 城镇居民可支配收入 | 元 | |
| 教育资源 | 普通中小学教师数与普通中小学在校学生数的比值 | % | |
| 医疗资源 | 人均医疗机构床位数 | 个/人 |
图1 收缩型中小城市及对照城市分布注:该图基于国家测绘地理信息局标准地图服务网站下载的审图号为GS(2023)2767号的标准地图制作,底图无修改。 Figure 1 Distribution of shrinking small and medium-sized cities and reference cities |
表4 倾向得分匹配平衡性检验结果Table 4 Balance test of propensity score matching |
| 变量 | 匹配前 | 匹配后 | |||||
|---|---|---|---|---|---|---|---|
| 收缩型中小城市 | 其他城市 | 差异 | 收缩型中小城市 | 对照城市 | 差异 | ||
| ln常住人口规模 | 12.95 | 14.03 | 1.01*** | 12.95 | 13.15 | 0.21 | |
| ln人均GDP | 4.52 | 7.07 | 0.69*** | 4.52 | 4.52 | 0.00 | |
| 第二产业增加值占GDP比重 | 0.26 | 0.40 | 1.06*** | 0.26 | 0.27 | 0.07 | |
| 第三产业增加值占GDP比重 | 0.49 | 0.48 | 0.09 | 0.49 | 0.50 | 0.11 | |
| ln全社会固定资产投资总额 | 5.23 | 6.43 | 0.94*** | 5.23 | 5.44 | 0.18 | |
| ln医疗机构床位数 | 7.82 | 8.81 | 0.94*** | 7.82 | 7.98 | 0.16 | |
| 平均地形起伏度 | 131.83 | 208.74 | 0.46** | 131.83 | 155.67 | 0.21 | |
注:*、**、***分别表示参数通过0.05、0.01和0.001的显著性检验,下同。 |
表5 2010—2020年收缩型中小城市与对照城市供地指标动静态特征对比Table 5 Dynamic and static characteristics of land supply indicators of shrinking small and medium-sized cities and reference cities, 2010-2020 |
| 特征 | 收缩型中小城市 | |||||||
|---|---|---|---|---|---|---|---|---|
| 全部样本 | 东北地区 | |||||||
| 均值 | 年均变化率 | 年际变化方差 | 均值 | 年均变化率 | 年际变化方差 | |||
| 供应规模 | 供地面积/km2 | 2.65 | -0.01 | 0.03 | 2.83 | -0.03 | 0.05 | |
| 供应价格 | 供地单价/(元/m2) | 258.11 | 0.07 | 0.01 | 186.53 | 0.04 | 0.03 | |
| 供应结构 | 商住用地比重 | 0.30 | -0.05 | 0.01 | 0.29 | -0.07 | 0.02 | |
| 工业用地比重 | 0.30 | -0.01 | 0.02 | 0.27 | 0.01 | 0.02 | ||
| 城市公共用地比重 | 0.15 | 0.09 | 0.07 | 0.15 | 0.10 | 0.14 | ||
| 交通基础设施用地比重 | 0.25 | 0.09 | 0.04 | 0.28 | 0.12 | 0.12 | ||
| 供应方式 | 划拨供地比重 | 0.44 | 0.05 | 0.01 | 0.47 | 0.04 | 0.01 | |
| 协议出让比重 | 0.09 | -0.04 | 0.09 | 0.10 | -0.05 | 0.07 | ||
| 招拍挂出让比重 | 0.48 | -0.02 | 0.01 | 0.43 | -0.02 | 0.02 | ||
| 特征 | 对照城市 | |||||||
| 全部样本 | 东北地区 | |||||||
| 均值 | 年均变化率 | 年际变化方差 | 均值 | 年均变化率 | 年际变化方差 | |||
| 供应规模 | 供地面积/km2 | 2.82 | 0.03 | 0.04 | 3.18 | 0.00 | 0.08 | |
| 供应价格 | 供地单价/(元/m2) | 426.16 | 0.08 | 0.02 | 280.95 | 0.06 | 0.04 | |
| 供应结构 | 商住用地比重 | 0.31 | -0.02 | 0.01 | 0.26 | -0.06 | 0.04 | |
| 工业用地比重 | 0.30 | -0.01 | 0.01 | 0.36 | 0.03 | 0.05 | ||
| 城市公共用地比重 | 0.19 | 0.03 | 0.01 | 0.18 | 0.12 | 0.15 | ||
| 交通基础设施用地比重 | 0.19 | 0.08 | 0.10 | 0.21 | 0.15 | 0.18 | ||
| 供应方式 | 划拨供地比重 | 0.41 | 0.03 | 0.02 | 0.39 | 0.04 | 0.04 | |
| 协议出让比重 | 0.06 | 0.01 | 0.04 | 0.07 | -0.03 | 0.39 | ||
| 招拍挂出让比重 | 0.53 | -0.01 | 0.01 | 0.53 | -0.01 | 0.01 | ||
表6 3类收缩型中小城市建设用地供应指标对比Table 6 Comparison of construction land supply indicators of three types of shrinking small and medium-sized cities |
| 特征 | 绝对量 | 长期趋势 | 波动性 | ||||||||||||
|---|---|---|---|---|---|---|---|---|---|---|---|---|---|---|---|
| Ⅰ类 | Ⅱ类 | Ⅲ类 | 均值 | Ⅰ类 | Ⅱ类 | Ⅲ类 | 均值 | Ⅰ类 | Ⅱ类 | Ⅲ类 | 均值 | ||||
| 供应规模 | 供地面积/km2 | 0.59 | 1.95 | 0.66 | 1.07 | -0.03 | -0.14 | 0.01 | -0.05 | 0.57 | 1.16 | 0.45 | 0.73 | ||
| 供应价格 | 供地单价/(元/m2) | 0.70 | 0.80 | 1.41 | 0.97 | 0.04 | 0.03 | 0.07 | 0.05 | 0.52 | 0.46 | 0.79 | 0.59 | ||
| 供应结构 | 商住用地比重 | 0.91 | 0.96 | 1.11 | 0.99 | -0.06 | -0.04 | -0.07 | -0.05 | 0.70 | 0.57 | 0.61 | 0.63 | ||
| 工业用地比重 | 0.84 | 0.86 | 1.24 | 0.98 | -0.02 | -0.02 | -0.02 | -0.02 | 0.68 | 0.49 | 0.69 | 0.62 | |||
| 城市公共用地比重 | 1.09 | 0.94 | 0.96 | 1.00 | 0.08 | 0.04 | 0.08 | 0.07 | 1.04 | 0.70 | 0.93 | 0.89 | |||
| 交通基础设施用地比重 | 1.23 | 1.25 | 0.61 | 1.03 | 0.04 | 0.04 | 0.06 | 0.05 | 1.13 | 1.02 | 0.84 | 1.00 | |||
| 供应方式 | 划拨供地比重 | 1.17 | 1.13 | 0.75 | 1.02 | 0.03 | 0.03 | 0.05 | 0.04 | 0.63 | 0.52 | 0.54 | 0.56 | ||
| 协议出让比重 | 0.88 | 1.07 | 1.06 | 1.00 | -0.04 | -0.05 | -0.08 | -0.06 | 1.02 | 1.23 | 1.34 | 1.20 | |||
| 招拍挂出让比重 | 0.86 | 0.87 | 1.22 | 0.98 | -0.02 | -0.02 | -0.03 | -0.02 | 0.51 | 0.42 | 0.48 | 0.47 | |||
表7 3类城市基本面数据Table 7 Fundamentals of three types of cities |
| 特征 | 收缩型中小城市分类 | ||
|---|---|---|---|
| Ⅰ类 | Ⅱ类 | Ⅲ类 | |
| 常住人口/万人 | 19.07 | 40.48 | 24.32 |
| GDP/亿元 | 160.70 | 420.68 | 251.93 |
| 第一产业增加值占GDP比重 | 0.30 | 0.26 | 0.20 |
| 第二产业增加值占GDP比重 | 0.20 | 0.25 | 0.32 |
| 第三产业增加值占GDP比重 | 0.51 | 0.48 | 0.47 |
| 资源型城市占比/% | 33.3 | 45.0 | 14.8 |
| 资源枯竭型城市占比/% | 25.0 | 35.0 | 7.4 |
表8 组间差异Logistic回归参数估计结果Table 8 Logistic regression parameter estimation results of inter-group difference |
| 变量 | 模型(收缩型中小城市/对照城市) | |
|---|---|---|
| 系数β | 优势比 | |
| 政府财政压力 | 0.19 | 1.21 |
| ln政府投资强度 | 0.25 | 1.28 |
| 产业结构 | 0.33* | 1.39 |
| 人口流入水平 | 0.46* | 1.58 |
| 城镇人口的变化 | 0.33*** | 1.39 |
| 房地产建设 | 0.06 | 1.06 |
| ln居民购买力 | -0.36 | 0.70 |
| 教育资源 | -0.00*** | 1.00 |
| 医疗资源 | 0.01 | 1.01 |
| 似然比检验χ2 | 76.42*** | |
| AUC | 81.00% | |
表9 组内差异Logistic回归参数估计结果Table 9 Logistic regression parameter estimation results of intra-group difference |
| 变量 | 模型1(Ⅱ/Ⅰ) | 模型2(Ⅲ/Ⅰ) | 模型3(Ⅲ/Ⅱ) | |||||
|---|---|---|---|---|---|---|---|---|
| 系数β | 优势比 | 系数β | 优势比 | 系数β | 优势比 | |||
| 政府财政压力 | 0.53* | 1.71 | 0.37 | 1.45 | -0.34 | 0.71 | ||
| 政府投资强度 | -1.46* | 0.23 | 1.32* | 3.73 | 1.70** | 5.45 | ||
| 产业结构 | -1.08* | 0.34 | -0.95* | 0.39 | -1.14* | 0.32 | ||
| 人口流入水平 | 0.11 | 1.12 | 0.05 | 1.05 | -0.05 | 0.96 | ||
| 城镇人口的变化 | 0.03 | 1.03 | -0.05 | 0.95 | -0.05 | 0.95 | ||
| 房地产建设 | -0.13 | 0.88 | 0.09 | 1.10 | -0.17 | 0.84 | ||
| 居民购买力 | -0.21 | 0.81 | -0.16 | 0.85 | 0.12 | 1.13 | ||
| 教育资源 | 0.02 | 1.02 | -0.02 | 0.98 | -0.03* | 0.97 | ||
| 医疗资源 | -0.03 | 0.97 | -0.08* | 0.93 | -0.05 | 0.95 | ||
| 似然比检验χ2 | 29.162*** | 29.365*** | 25.93** | |||||
| AUC | 88.60% | 80.00% | 80.40% | |||||
| [1] |
|
| [2] |
庄佳, 陈友华. 人口负增长、城市收缩与国家抉择[J]. 人口与发展, 2023, 29(6): 31-42.
[
|
| [3] |
孟祥凤, 马爽, 项雯怡, 等. 基于百度慧眼的中国收缩城市分类研究[J]. 地理学报, 2021, 76(10): 2477-2488.
[
|
| [4] |
段成荣, 邱玉鼎. 迁徙中国形态下人口流动最新趋势及治理转向[J]. 中共中央党校(国家行政学院)学报, 2023, 27(4): 118-129.
[
|
| [5] |
原新, 金牛. 在国家战略体系中积极应对老龄社会问题[J]. 人口研究, 2021, 45(2): 3-12.
[
|
| [6] |
陈友华. 中国人口发展: 现状、趋势与思考[J]. 人口与社会, 2019, 35(4): 3-17.
[
|
| [7] |
刘振, 戚伟, 刘盛和. 中国人口收缩的城乡分异特征及形成机理[J]. 地理科学, 2021, 41(7): 1116-1128.
[
|
| [8] |
宫攀, 张槊, 王文哲. 人口视角下中国城市收缩的演变特征与时空格局: 基于第七次全国人口普查公报数据的分析[J]. 人口与经济, 2022, (3): 1-15.
[
|
| [9] |
刘省言, 冯建喜. 基于面板数据的长三角城市收缩空间格局及影响因素研究[J]. 现代城市研究, 2022, (10): 47-51.
[
|
| [10] |
|
| [11] |
张明斗, 曲峻熙. 中国广义城市收缩的空间格局与生成逻辑研究: 基于人口总量和经济规模的视角[J]. 经济学家, 2020, (1): 77-85.
[
|
| [12] |
刘艳军, 张艺宁, 孙宏日, 等. 收缩城市住房空置时空分异及影响机制: 基于居民用电量视角[J]. 地理科学, 2021, 41(12): 2087-2095.
[
|
| [13] |
张旭亮, 周思敏. 中国县域人口收缩空间格局与影响因素[J]. 经济地理, 2023, 43(7): 42-51.
[
|
| [14] |
刘菊, 孙平军, 罗宁, 等. 城市收缩研究进展及其中国本土化思考[J]. 地域研究与开发, 2022, 41(3): 55-60.
[
|
| [15] |
|
| [16] |
应奎, 丁金宏, 陈益豪, 等. 贵州县域人口收缩空间特征及影响因素的MGWR探测[J]. 世界地理研究, 2023, 32(12): 172-184.
[
|
| [17] |
|
| [18] |
周恺, 刘力銮, 戴燕归. 收缩治理的理论模型、国际比较和关键政策领域研究[J]. 国际城市规划, 2020, 35(2): 12-19.
[
|
| [19] |
钟林睿, 陆军, 凌英凯, 等. 中国收缩城市企业TFP下降的原因: 关于集聚效应和选择效应的检验[J]. 中国软科学, 2023, (3): 52-62.
[
|
| [20] |
衣霄翔, 张郝萍, 夏雷. 国际收缩城市应对空置问题的临时使用策略及启示[J]. 城市规划学刊, 2022, (2): 111-118.
[
|
| [21] |
刘菊, 孙平军. 东北三省收缩城市的基本公共服务均等化收缩效应与机理解析[J]. 人文地理, 2023, 38(3): 128-137.
[
|
| [22] |
侯启缘. 收缩型中小城市的土地过度开发悖论及应对[J]. 安徽行政学院学报, 2021, (4): 70-76.
[
|
| [23] |
徐惠孝, 刘艳军. 收缩城市建设用地利用效率时空分异及影响机制: 以黑龙江省伊春市为例[J]. 地理科学进展, 2021, 40(6): 937-947.
[
|
| [24] |
张伟, 裴敏洁. 基于多维分析框架的中国城市收缩时空演化特征分析[J]. 热带地理, 2022, 42(5): 762-772.
[
|
| [25] |
周春山, 金万富, 张国俊, 等. 中国国有建设用地供应规模时空特征及影响因素[J]. 地理学报, 2019, 74(1): 16-31.
[
|
| [26] |
刘晓宇, 辛良杰. 2007-2019年中国城市土地价格的空间分化[J]. 地理研究, 2022, 41(6): 1637-1651.
[
|
| [27] |
刘润, 任晓蕾, 孙桂英. 武汉市土地出让的格局、特征与影响因素研究[J]. 城市问题, 2021, (8): 36-44.
[
|
| [28] |
韩昊英, 陈宇, 张小东. 杭州市居住用地出让时空动态演进及区位选择模式研究[J]. 现代城市研究, 2022, (2): 37-44.
[
|
| [29] |
王媛, 杨广亮. 为经济增长而干预: 地方政府的土地出让策略分析[J]. 管理世界, 2016, (5): 18-31.
[
|
| [30] |
吴淑萍, 张莉, 杨赞. “稳地价”调控、地方政府土地供应与土地成交量价表现[J]. 清华大学学报(自然科学版), 2022, 62(3): 601-613.
[
|
| [31] |
邹琳华, 钟春平. 饥饿供地, 还是售地冲动: 基于地级以上城市土地出让及房价数据的实证分析[J]. 财贸经济, 2022, 43(3): 82-97.
[
|
| [32] |
郭远智, 李许红. 基于随机森林模型的黄河流域城市建设用地结构时空演化及其驱动机制研究[J]. 地理科学进展, 2023, 42(1): 12-26.
[
|
| [33] |
孙平军, 彭雅丽, 周馨雨. 集约用地视角东北三省城市收缩效应诊断与作用机理研究[J]. 地理研究, 2023, 42(1): 106-22.
[
|
| [34] |
戚伟, 刘振, 刘盛和, 等. 基于“城区常住人口”的2010-2020年中国收缩城市识别[J]. 地理研究, 2023, 42(10): 2539-2555.
[
|
| [35] |
|
| [36] |
鞠洪润, 张生瑞, 闫逸晨. 1980-2020年粤港澳大湾区城镇用地空间格局类型演变及其驱动力多维探测[J]. 地理学报, 2022, 77(5): 1086-1101.
[
|
| [37] |
王永兴, 景维民. 中国地下经济的区域发展分化: 基于多指标面板数据的聚类分析检验[J]. 南开经济研究, 2014, (6): 44-57.
[
|
| [38] |
张延吉, 秦波, 吴凌燕. 正规商业与流动商贩的空间分布关系及其影响因素: 以北京市朝阳区为例[J]. 人文地理, 2014, 29(5): 121-126.
[
|
| [39] |
韩娟, 金晓斌, 张志宏, 等. 中国住宅出让地价发育特征及其影响因素分析[J]. 地理科学, 2017, 37(4): 573-584.
[
|
| [40] |
李宇, 孟丹, 叶海鹏, 等. 俄罗斯典型城市扩张时空格局与驱动机制: 基于遥感决策融合与多元离散回归模型[J]. 地理研究, 2021, 40(11): 2967-2985.
[
|
| [41] |
闫昊生, 孙久文, 张泽邦. 中国城市建设用地供应的时空演变分析[J]. 城市发展研究, 2021, 28(9): 42-49.
[
|
| [42] |
赵雲泰, 王亚男, 吕晓. 东北地区国土开发强度的时空格局及其驱动机制[J]. 地理与地理信息科学, 2022, 38(6): 76-83.
[
|
| [43] |
陈丹玲, 胡文伯, 卢新海, 等. 城市新增建设用地扩张影响机制: 基于PSR框架的组态分析[J]. 中国土地科学, 2022, 36(7): 85-93.
[
|
| [44] |
金刚, 沈坤荣, 李剑. “以地谋发展”模式的跨界污染后果[J]. 中国工业经济, 2022, (3): 95-113.
[
|
| [45] |
白秀叶, 鲁建坤, 李培. 财政压力、土地资源的行业配置与集聚效应[J]. 财贸经济, 2023, 44(2): 41-54.
[
|
| [46] |
赵扶扬, 陈斌开, 刘守英. 宏观调控、地方政府与中国经济发展模式转型: 土地供给的视角[J]. 经济研究, 2021, 56(7): 4-23.
[
|
| [47] |
王少剑, 王泽宏. 经济转型背景下长三角城市用地扩张及影响因素的时空差异[J]. 自然资源学报, 2021, 36(4): 993-1007.
[
|
| [48] |
吴晓, 王慧, 左为. 大城市商业服务业流动人口居住中心识别: 以南京主城区为例[J]. 城市规划, 2015, 39(3): 94-103.
[
|
| [49] |
刘倩倩, 吴相利. 人口收缩背景下东北三省市域经济与基本公共服务协调发展测度与驱动机制[J]. 经济地理, 2023, 43(6): 22-32.
[
|
| [50] |
张浩哲, 杨庆媛. 中国资源型收缩城市“人口-土地-产业”耦合协调分析[J]. 世界地理研究, 2024, 33(1): 163-177.
[
|
| [51] |
曾鹏, 蒋晓昆, 陈意. 中国城市群土地绿色利用效率时空演变及爬升曲线模拟[J]. 资源科学, 2024, 46(1): 187-204.
[
|
| [52] |
张浩哲, 杨庆媛. 中国收缩城市土地利用效率及其影响因素研究[J]. 人文地理, 2021, 36(3): 108-116.
[
|
| [53] |
王猛, 赵小庆. 人往高处走: 行政等级与省会扩张[J]. 城市发展研究, 2023, 30(9): 52-59.
[
|
| [54] |
郭亮, 彭雨晴, 贺慧, 等. 分级诊疗背景下的武汉市医疗设施供需特征与优化策略[J]. 经济地理, 2021, 41(7): 73-81.
[
|
/
| 〈 |
|
〉 |