
Environmental impact assessment of energy and power system transformation in China
Received date: 2023-05-02
Revised date: 2023-08-06
Online published: 2023-10-30
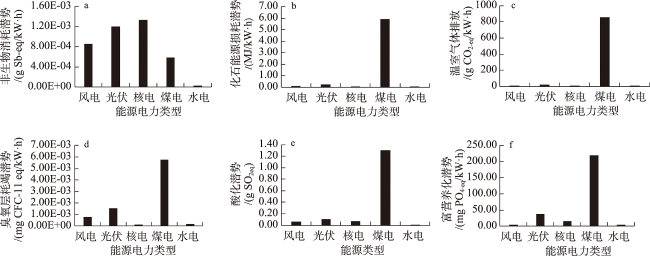
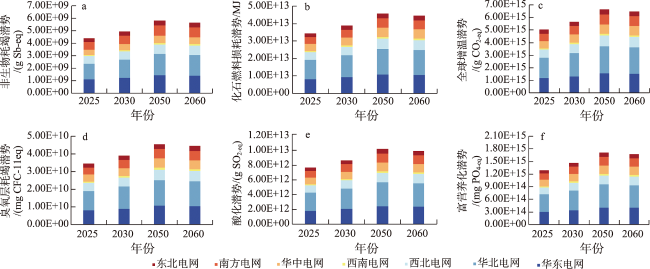
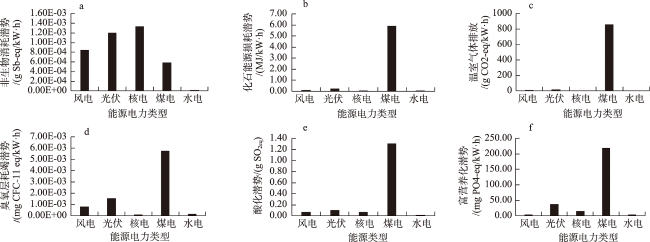
[Objective] Building a new type of electric system based on renewable energies, such as wind power and photovoltaic power, is an important measure to achieve carbon neutrality. China has a vast land area with significant differences in energy resource endowment, energy production structure, economic development level, and regional specialization for energy production. To achieve the “dual carbon” goals at a national scale, it is necessary to implement regionally differentiated action plans. [Methods] Starting from the analysis of the seven major power grid regions in China, using the methods of life cycle assessment and GIS-MCDA model, combined with the future electricity demand and proportion of each province, to quantify the environmental impact of energy and power system transformation on the Chinese region. [Results] The results of this study show that: (1) From 2015 to 2020, the environmental pressure on China and each of its seven regions continuously increased, with the East China and North China regions being the main emitting areas. (2) From 2025 to 2060, building an energy system based on new energy sources can greatly reduce the environmental pressure, except for the non-biomass exhaustion potential. (3) Overall, coal-based power generation has a higher environmental impact than other energy types (except for non-biomass exhaustion potential), and hydroelectric power generation has the smallest environmental impact among the five selected energy types. [Conclusion] The research results can provide a scientific basis for China to achieve the “dual carbon” goals through energy transformation, and also have some reference value for the government to make improved policy decisions.
ZHANG Yajuan , WANG Zheng , LI Shuangcheng . Environmental impact assessment of energy and power system transformation in China[J]. Resources Science, 2023 , 45(9) : 1830 -1843 . DOI: 10.18402/resci.2023.09.10
表1 风电、光伏技术开发潜力主要数据与来源Table 1 Data and sources of wind power and photovoltaic technology development potential |
| 数据名称 | 数据集来源 |
|---|---|
| 土地利用 | 地理国情监测云平台,全国土地利用数据产品 http://www.dsac.cn/DataProduct/Detail/200804 |
| 自然保护区 | 中国自然资源保护区共享平台: http://www.papc.cn |
| WDPA:www.protectedplanet.net | |
| wdpar R: https://prioritizr.github.io/wdpar/ | |
| 温度 | CDS: https://cds.climate.copernicus.eu |
| ERA5Land: https://doi.org/10.24381/cds.e2161bac | |
| 风速 | 国家气候中心的 BCC_3km 风能资源数据 |
| 空气密度 | BCC_3km 风能资源数据 MERRA2 数据集 |
| DEM | Shuttle Radar Topography Mission (SRTM) Global Enhanced Slope Database https://cgiarcsi.community/data/srtm-90m-digital-elevation-database-v4-1/ |
| 潮间带 | http://geodoi.ac.cn/WebCn/doi.aspx?Id=1140 |
| 水深 | https://download.gebco.net/ |
| 水平面总辐射 | 国家气候中心的地表太阳辐射数据,时间范围是2000—2020年,时间分辨率为小时,空间分辨率为5 km |
| 居民地 | https://geoservice.dlr.de/web/maps/eoc:wsf2019 |
| 人口公里网格 | https://www.worldpop.org/project/categories?id=18 https://data.humdata.org/dataset/worldpop-population-counts-for-China |
| 道路及交通 | https://download.geofabrik.de/asia.html |
| 土地价格 | 中国土地市场网: https://www.landChina.com/landSupply 中国地价信息服务平台: http://www.landvalue.com.cn/Lvmonitor/Index |
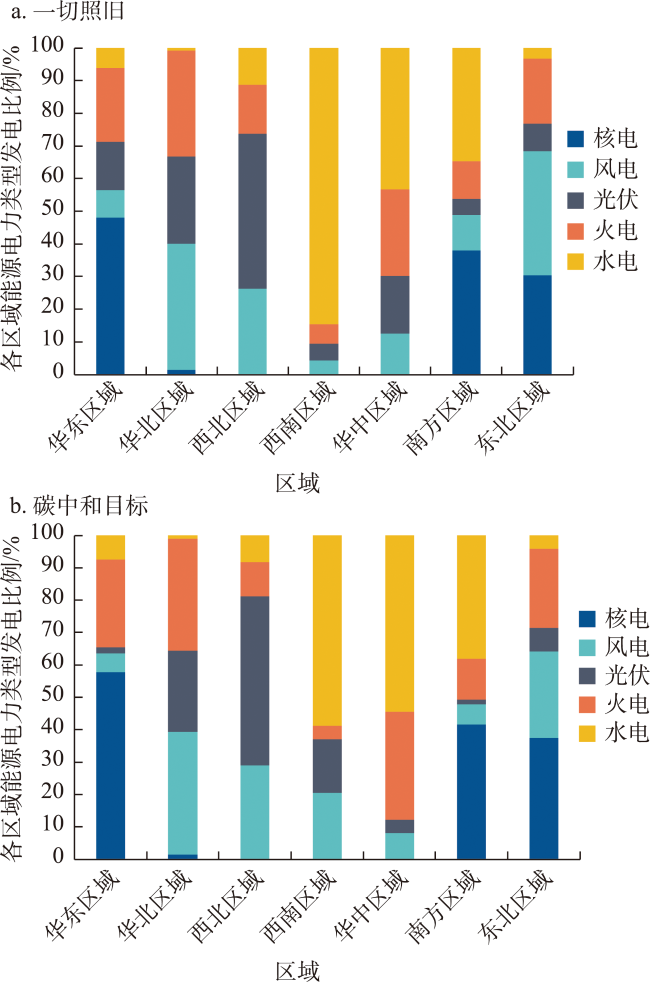
表2 中国能源结构情景设置Table 2 Scenario settings of China’s energy structure |
| 情景名称 | 年份设置 | 情景描述 |
|---|---|---|
| 情景1: 一切照旧 | 2025年 | 中国能源电力部门在按照2015—2020年发电结构不变的状态下,满足“30·60”报告的未来社会总电力能源需求。 |
| 2030年 | ||
| 2050年 | ||
| 2060年 | ||
| 情景2: 双碳目标 | 2025年 | 依据“30·60”报告的对未来装机容量的预测 |
| 2030年 | ||
| 2050年 | ||
| 2060年 |
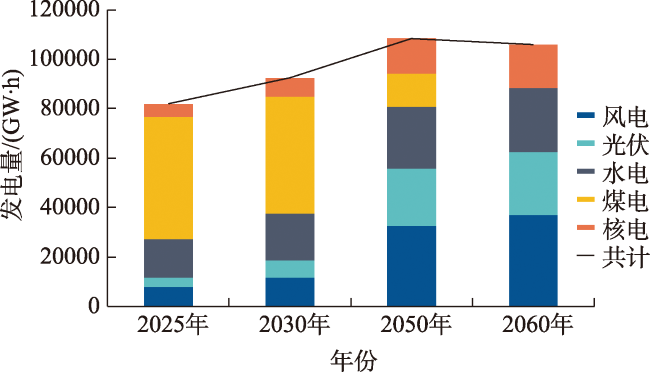
表3 2025—2060年中国能源电力系统装机容量预测 (GW)Table 3 Forecast of installed capacity of China’s energy and power system, 2025-2060 (GW) |
| 风电 | 光伏 | 水电 | 煤电 | 核电 | |
|---|---|---|---|---|---|
| 2025年 | 536 | 559 | 460 | 1100 | 72 |
| 2030年 | 800 | 1025 | 554 | 1050 | 108 |
| 2050年 | 2200 | 3450 | 740 | 300 | 200 |
| 2060年 | 2500 | 3800 | 760 | 0 | 250 |
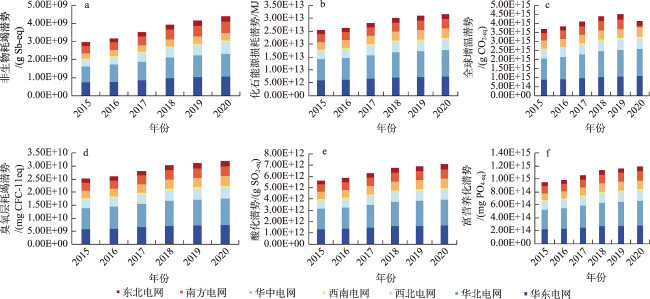
表4 2015—2020年各能源电力类型生命周期单位发电量环境影响排放Table 4 Emissions per unit of power generation in the life cycle of each energy and power type, 2015-2020 |
| 环境影响 | 单位 | 2015年 | 2016年 | 2017年 | 2018年 | 2019年 | 2020年 |
|---|---|---|---|---|---|---|---|
| 非生物耗竭潜势 | g Sb-eq | 2.95E+09 | 3.17E+09 | 3.51E+09 | 3.91E+09 | 4.15E+09 | 4.38E+09 |
| 化石能源损耗潜势 | MJ | 2.54E+13 | 2.63E+13 | 2.82E+13 | 3.02E+13 | 3.10E+13 | 3.16E+13 |
| 全球增温潜势(GWP100a) | g CO2-eq | 3.69E+15 | 3.82E+15 | 4.10E+15 | 4.39E+15 | 4.50E+15 | 4.60E+15 |
| 臭氧层耗竭潜势 | Mg CFC-11 eq | 2.51E+10 | 2.61E+10 | 2.80E+10 | 3.02E+10 | 3.10E+10 | 3.18E+10 |
| 酸化潜势 | g SO2-eq | 5.64E+12 | 5.85E+12 | 6.27E+12 | 6.73E+12 | 6.91E+12 | 7.06E+12 |
| 富营养化潜势 | Mg PO4-eq | 9.49E+14 | 9.84E+14 | 1.06E+15 | 1.13E+15 | 1.17E+15 | 1.19E+15 |
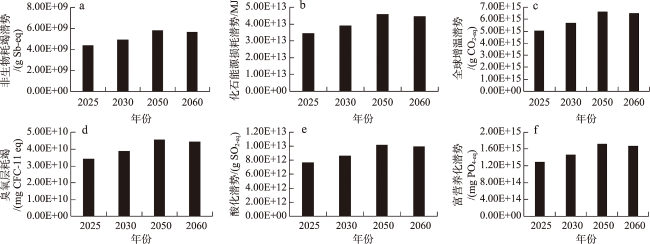
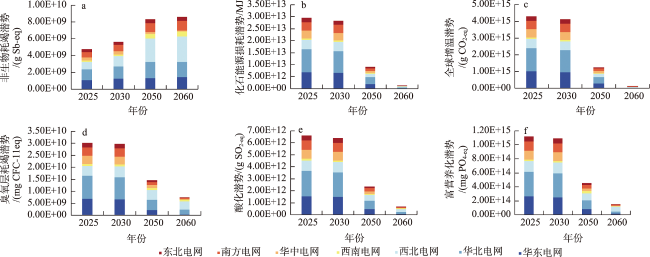
图6 2025—2060年“一切照旧”情景下中国环境影响排放的变化情况Figure 6 Changes in environmental impact emissions in China under the “business as usual” scenario, 2025-2060 |
表5 不同发电方式的温室气体排放研究结果对比 (g CO2/KW·h)Table 5 Comparison of results of greenhouse gas emissions by different power generation methods (g CO2/KW·h) |
| [1] |
|
| [2] |
|
| [3] |
|
| [4] |
|
| [5] |
|
| [6] |
|
| [7] |
|
| [8] |
|
| [9] |
于随然, 李鹞. 中国光伏系统的生命周期评价[J]. 环境工程, 2014, 32(10): 119-124.
[
|
| [10] |
|
| [11] |
刘聚明, 王志伟. 内蒙地区燃煤电厂生命周期温室气体排放分析[J]. 环境与发展, 2014, 26(6): 60-63.
[
|
| [12] |
|
| [13] |
|
| [14] |
|
| [15] |
|
| [16] |
|
| [17] |
|
| [18] |
李鹞. 中国晶体硅太阳能电池板的生命周期评价[D]. 上海: 上海交通大学, 2015.
[
|
| [19] |
洪巧巧. 燃煤电厂烟气脱硫脱硝除尘技术生命周期评价[D]. 杭州: 浙江大学, 2015.
[
|
| [20] |
王彦哲, 周胜, 姚子麟, 等. 中国煤电生命周期二氧化碳和大气污染物排放相互影响建模分析[J]. 中国电力, 2021, 54(8): 128-135.
[
|
| [21] |
|
| [22] |
姜子英, 潘自强, 邢江於. 中国核电能源链的生命周期温室气体排放研究[J]. 中国环境科学, 2015, 35(11): 3502-3510.
[
|
| [23] |
|
| [24] |
陈冬波, 陆师敏, 宋木仿. 高坝洲水电站水轮发电机组选型设计[J]. 水力发电, 2002, (3): 29-31.
[
|
| [25] |
全球能源互联网发展合作组织. 中国2060年前碳中和研究报告[M]. 北京: 中国电力出版社, 2021.
[Global Energy Interconnection Development Cooperation Organization. China’s Carbon Neutral Research Report Before 2060[M]. Beijing: China Electric Power Press, 2021.]
|
| [26] |
|
| [27] |
|
| [28] |
|
| [29] |
|
/
| 〈 |
|
〉 |