
Spatiotemporal heterogeneity and sources of electricity technology innovation in China
Received date: 2023-03-01
Revised date: 2023-05-19
Online published: 2023-09-12
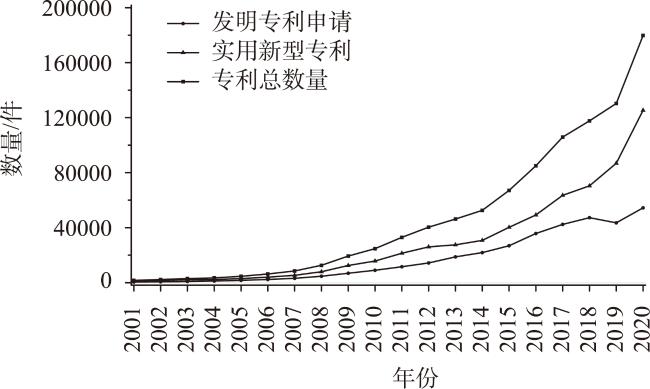
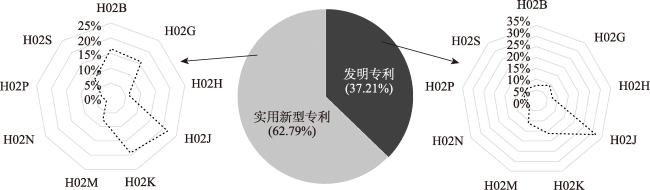
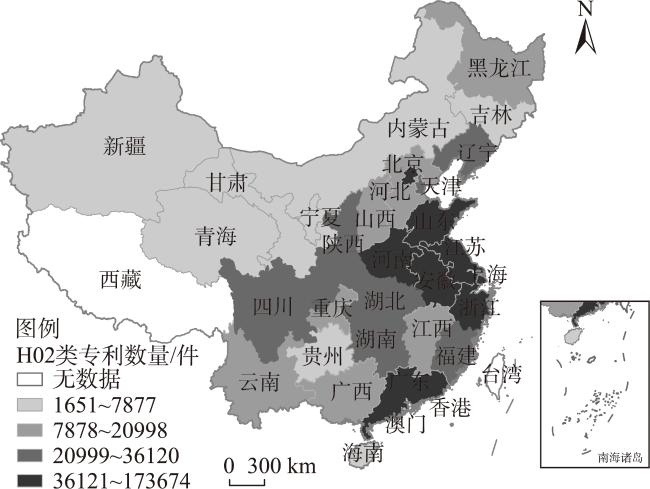
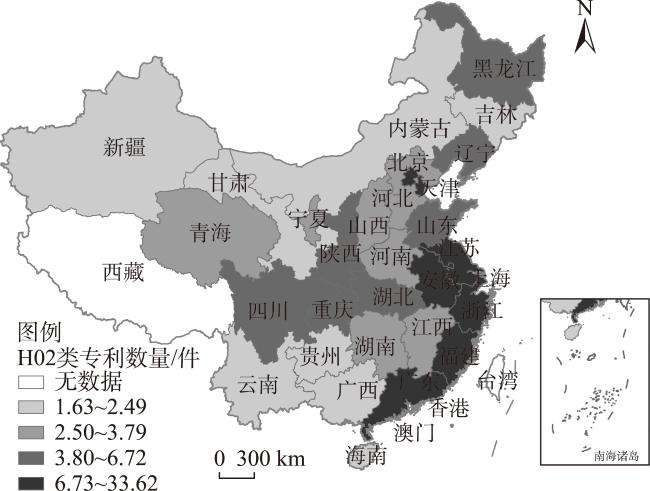
[Objective] Electric technology innovation is the key to promote energy technology revolution. This study aimed to clarify the strategic orientation of the electric technology innovation in China and examine its spatiotemporal pattern and sources, to provide a scientific evidence for accelerating China’s electric technology innovation. [Methods] Based on the statistical data of H02 patents, this study evaluated the spatial and temporal distribution characteristics of China’s electric technology innovation by constructing an absolute index, a relative index, and structural specialization coefficient. It analyzed the sources of the spatial differentiation of electric technology innovation from two dimensions of space and patent structure by using the Dagum Gini index and variance decomposition. [Results] The results show that: (1) The level of electric technology innovation showed an upward trend, and it decreased from the east to the west. The innovation capacity was mainly concentrated in the shape, structure, and application of electric products. (2) The spatial differentiation degree of the invention patent specialization coefficient was larger than that of the utility model patent, and the number of regions belonging to the utility model patent specialization category was more than that of the invention patent specialization category. (3) Compared with intraregional variation and superimposed over density, the interregional variation had a greater driving effect on the spatial differentiation of electric technology innovation. The utility model patents had a stronger driving effect on the spatial differentiation of electric technology innovation, while invention patents had the opposite effect. [Conclusion] This study contributes to coordinate the balanced development of regional electric technology innovation and explore the effective ways to improve the level of electric technology innovation.
GUANG Fengtao , LI Lin , LU Xiaodan . Spatiotemporal heterogeneity and sources of electricity technology innovation in China[J]. Resources Science, 2023 , 45(7) : 1324 -1334 . DOI: 10.18402/resci.2023.07.04
表1 H02类专利的分类及定义Table 1 Classification and definition of H02 patents |
| 分类号 | 定义 |
|---|---|
| H02B | 供电或配电用的配电盘、变电站或开关装置 |
| H02G | 电缆或电线的安装,或光电组合电缆或电线的安装 |
| H02H | 紧急保护电路装置 |
| H02J | 供电或配电的电路装置或系统;电能存储系统 |
| H02K | 电机(电动继电器入H01H 53/00;直流或交流电力输入变换为浪涌电力输出入H02M 9/00) |
| H02M | 用于电功率变换的电路或装置,或用于控制或调节此种电路或装置的设备 |
| H02N | 其他类目不包含的电机 |
| H02P | 电动机、发电机或机电变换器的控制或调节;控制变压器、电抗器或扼流圈 |
| H02S | 由红外线辐射、可见光或紫外光转换产生电能,如使用光伏(PV)模块 |
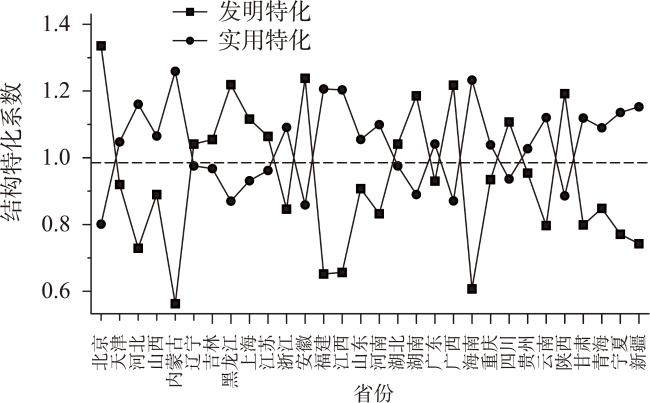
表2 依据结构特化系数的地区分类结果Table 2 Results of regional classification based on structural specialization coefficient |
| 发明专利特化类 | 实用新型专利特化类 |
|---|---|
| 北京、辽宁、吉林、黑龙江、上海、江苏、安徽、湖北、湖南、广西、四川、陕西 | 天津、河北、山西、内蒙古、浙江、福建、江西、山东、河南、广东、海南、重庆、贵州、云南、甘肃、青海、宁夏、新疆 |
表3 2001—2020年中国电力技术创新产出的基尼系数及其空间分解Table 3 Gini index and spatial decomposition of China’s electric technology innovation output, 2001-2020 |
| 年份 | G | 区域内基尼系数 | 区域间基尼系数 | 贡献率/% | ||||||||
|---|---|---|---|---|---|---|---|---|---|---|---|---|
| 东部 | 西部 | 中部 | 东-西 | 东-中 | 中-西 | Gw | Gb | G1 | ||||
| 2001 | 0.5745 | 0.4764 | 0.2417 | 0.1554 | 0.7542 | 0.6118 | 0.3119 | 31.05 | 67.95 | 1.00 | ||
| 2002 | 0.6172 | 0.5097 | 0.3802 | 0.2224 | 0.7869 | 0.6512 | 0.3897 | 32.05 | 65.43 | 2.52 | ||
| 2003 | 0.6054 | 0.5043 | 0.2743 | 0.1830 | 0.7543 | 0.7082 | 0.2540 | 31.85 | 64.83 | 3.32 | ||
| 2004 | 0.6244 | 0.5247 | 0.3894 | 0.2267 | 0.7599 | 0.7133 | 0.3334 | 32.85 | 62.53 | 4.62 | ||
| 2005 | 0.6475 | 0.5143 | 0.3685 | 0.2006 | 0.7982 | 0.7644 | 0.3290 | 31.60 | 65.36 | 3.05 | ||
| 2006 | 0.6234 | 0.5224 | 0.2976 | 0.1627 | 0.7815 | 0.6998 | 0.3029 | 32.15 | 64.85 | 3.01 | ||
| 2007 | 0.6229 | 0.5114 | 0.3579 | 0.1440 | 0.7802 | 0.7045 | 0.3187 | 31.89 | 65.00 | 3.11 | ||
| 2008 | 0.6156 | 0.5233 | 0.3010 | 0.1290 | 0.7711 | 0.6908 | 0.2799 | 32.37 | 64.54 | 3.09 | ||
| 2009 | 0.6046 | 0.4954 | 0.3892 | 0.1310 | 0.7717 | 0.6580 | 0.3621 | 31.52 | 64.56 | 3.93 | ||
| 2010 | 0.5768 | 0.4787 | 0.3942 | 0.1969 | 0.7251 | 0.6343 | 0.3657 | 31.76 | 61.43 | 6.81 | ||
| 2011 | 0.5713 | 0.4639 | 0.4616 | 0.2057 | 0.7172 | 0.6156 | 0.4208 | 31.58 | 60.33 | 8.09 | ||
| 2012 | 0.5516 | 0.4608 | 0.4445 | 0.2361 | 0.6769 | 0.6034 | 0.3977 | 32.29 | 57.33 | 10.38 | ||
| 2013 | 0.6119 | 0.5588 | 0.3969 | 0.2566 | 0.7189 | 0.6788 | 0.3600 | 34.72 | 56.77 | 8.51 | ||
| 2014 | 0.6039 | 0.5612 | 0.3567 | 0.2447 | 0.7160 | 0.6595 | 0.3375 | 34.82 | 57.59 | 7.59 | ||
| 2015 | 0.5454 | 0.4825 | 0.3441 | 0.2284 | 0.6651 | 0.6136 | 0.3138 | 32.96 | 58.20 | 8.83 | ||
| 2016 | 0.5156 | 0.4451 | 0.2827 | 0.2428 | 0.6521 | 0.5763 | 0.3019 | 31.48 | 59.64 | 8.87 | ||
| 2017 | 0.4890 | 0.4263 | 0.2566 | 0.2468 | 0.6162 | 0.5586 | 0.2827 | 31.24 | 58.14 | 10.61 | ||
| 2018 | 0.4918 | 0.4318 | 0.2222 | 0.2498 | 0.6293 | 0.5503 | 0.2794 | 31.10 | 60.10 | 8.80 | ||
| 2019 | 0.4657 | 0.4046 | 0.2296 | 0.1793 | 0.6012 | 0.5304 | 0.2427 | 30.71 | 61.78 | 7.51 | ||
| 2020 | 0.4295 | 0.3664 | 0.2175 | 0.1764 | 0.5680 | 0.4754 | 0.2443 | 29.95 | 63.72 | 6.33 | ||
| 均值 | 0.5694 | 0.4831 | 0.3303 | 0.2009 | 0.7122 | 0.6349 | 0.3214 | 32.07 | 62.12 | 5.82 | ||
表4 2001—2020年不同电力技术创新产出类别对空间 分异的要素贡献 (%)Table 4 Factor contribution of different electric technology innovation output categories to the spatial differentiation, 2001-2020 (%) |
| 年份 | 发明专利 | 实用新型专利 |
|---|---|---|
| 2001 | 54.25 | 45.75 |
| 2002 | 48.44 | 51.56 |
| 2003 | 47.32 | 52.68 |
| 2004 | 57.36 | 42.64 |
| 2005 | 48.55 | 51.45 |
| 2006 | 48.19 | 51.81 |
| 2007 | 46.89 | 53.11 |
| 2008 | 47.53 | 52.47 |
| 2009 | 43.54 | 56.46 |
| 2010 | 44.00 | 56.00 |
| 2011 | 41.64 | 58.36 |
| 2012 | 42.23 | 57.77 |
| 2013 | 44.22 | 55.78 |
| 2014 | 46.34 | 53.66 |
| 2015 | 46.07 | 53.93 |
| 2016 | 46.46 | 53.54 |
| 2017 | 44.04 | 55.96 |
| 2018 | 44.13 | 55.87 |
| 2019 | 39.30 | 60.70 |
| 2020 | 33.29 | 66.71 |
| 均值 | 45.69 | 54.31 |
表5 基尼系数与专利类别来源的相关性Table 5 Correlation between the Gini index and the patent categories |
| 项目 | 发明专利 | 实用新型专利 |
|---|---|---|
| 基尼系数 | ( =0.843) | ( =0.876) |
| 区域内差距 | ( =0.683) | ( =0.752) |
| 区域间差距 | ( =0.882) | ( =0.809) |
| 超变密度 | ( =0.306) | ( =0.175) |
| [1] |
|
| [2] |
|
| [3] |
李杨. 政府政策和市场竞争对欧盟国家可再生能源技术创新的影响[J]. 资源科学, 2019, 41(7): 1306-1316.
[
|
| [4] |
|
| [5] |
谢里, 陈宇. 节能技术创新有助于降低能源消费吗? “杰文斯悖论”的再检验[J]. 管理科学学报, 2021, 24(12): 77-91.
[
|
| [6] |
叶琴, 曾刚, 戴劭勍, 等. 不同环境规制工具对中国节能减排技术创新的影响: 基于285个地级市面板数据[J]. 中国人口·资源与环境, 2018, 28(2): 115-122.
[
|
| [7] |
张意翔, 成金华, 徐卓程, 等. 中国区域生态建设协调度评价及提升: 基于能源技术专利数据[J]. 中国人口·资源与环境, 2019, 29(6): 58-64.
[
|
| [8] |
徐佳, 崔静波. 低碳城市和企业绿色技术创新[J]. 中国工业经济, 2020, (12): 178-196.
[
|
| [9] |
王红霞, 裴文乾. 城市人口多元化推进技术创新: 机理、验证与应对[J]. 上海经济研究, 2022, (6): 51-61.
[
|
| [10] |
张宗和, 彭昌奇. 区域技术创新能力影响因素的实证分析: 基于全国30个省市区的面板数据[J]. 中国工业经济, 2009, (11): 35-44.
[
|
| [11] |
李勇辉, 沈波澜, 胡舜, 等. 生产性服务业集聚空间效应与城市技术创新: 基于长江经济带108个城市面板数据的实证分析[J]. 经济地理, 2021, 41(11): 65-76.
[
|
| [12] |
韩永楠, 葛鹏飞, 周伯乐. 中国市域技术创新与绿色发展耦合协调演变分异[J]. 经济地理, 2021, 41(6): 12-19.
[
|
| [13] |
|
| [14] |
|
| [15] |
王俊松, 颜燕, 胡曙虹. 中国城市技术创新能力的空间特征及影响因素: 基于空间面板数据模型的研究[J]. 地理科学, 2017, 37(1): 11-18.
[
|
| [16] |
|
| [17] |
安同良, 魏婕, 舒欣. 中国制造业企业创新测度: 基于微观创新调查的跨期比较[J]. 中国社会科学, 2020, (3): 99-122.
[
|
| [18] |
|
| [19] |
|
| [20] |
|
| [21] |
徐乐, 赵领娣. 重点产业政策的新能源技术创新效应研究[J]. 资源科学, 2019, 41(1): 113-131.
[
|
| [22] |
|
| [23] |
齐绍洲, 张振源. 碳金融对可再生能源技术创新的异质性影响: 基于欧盟碳市场的实证研究[J]. 国际金融研究, 2019, (5): 13-23.
[
|
| [24] |
李凡, 朱缤绮, 孙颖. 环境政策、制度质量和可再生能源技术创新: 基于32个国家的实证分析[J]. 资源科学, 2021, 43(12): 2514-2525.
[
|
| [25] |
|
| [26] |
方芳, 李实. 中国企业高管薪酬差距研究[J]. 中国社会科学, 2015, (8): 47-67.
[
|
| [27] |
张卓群, 张涛, 冯冬发. 中国碳排放强度的区域差异、动态演进及收敛性研究[J]. 数量经济技术经济研究, 2022, 39(4): 67-87.
[
|
| [28] |
王强, 周侃, 林键. 中国城乡家庭能源平等变化特征分析[J]. 地理学报, 2022, 77(2): 457-473.
[
|
| [29] |
|
| [30] |
曲伟. 中国电力行业的专利信息分析研究[J]. 图书情报工作, 2014, 58(S1): 167-170.
[
|
| [31] |
苑舜. 东北电力辅助服务市场的创新与成效[J]. 电力设备管理, 2020, (8): 18-19.
[
|
/
| 〈 |
|
〉 |