
The evolution of spatial patterns of university-industry collaborative innovation in the Yangtze River Delta
Received date: 2022-11-14
Revised date: 2023-03-01
Online published: 2023-05-25
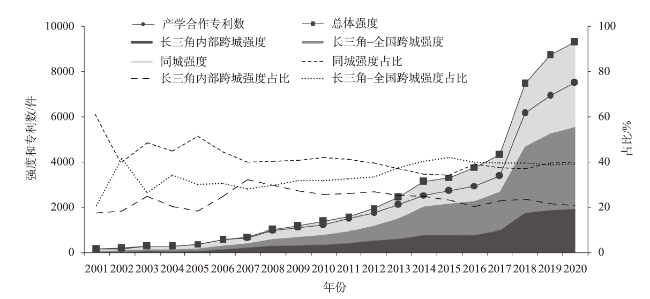
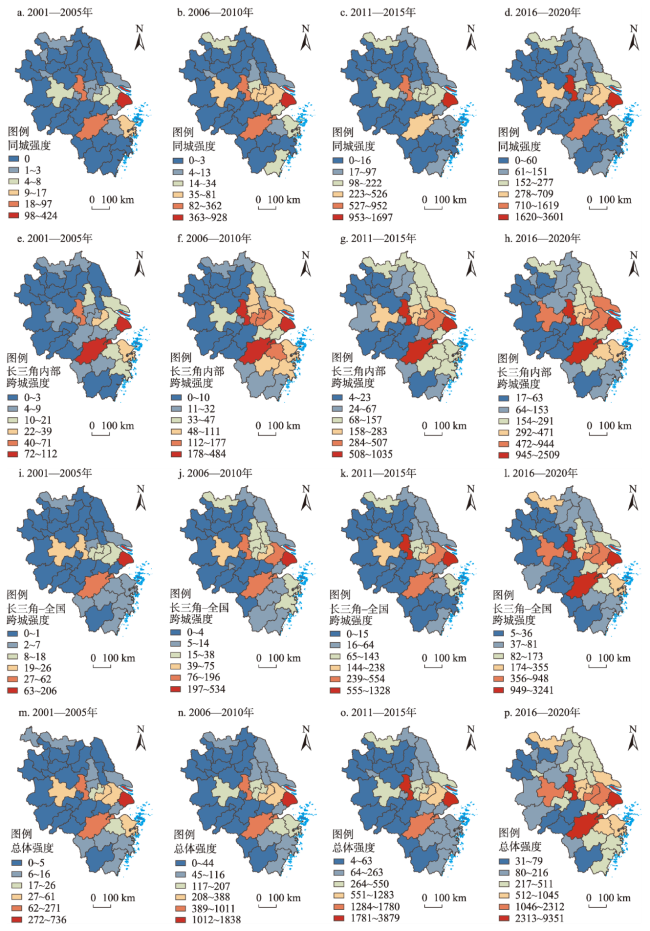
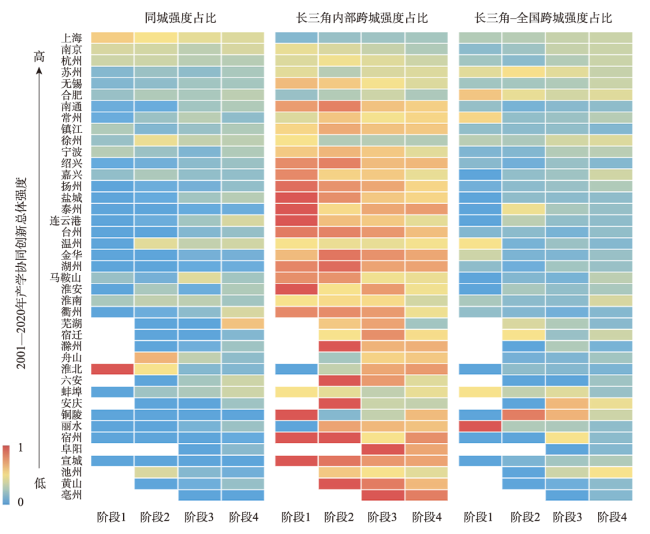
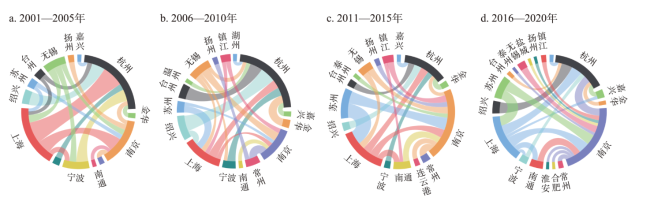
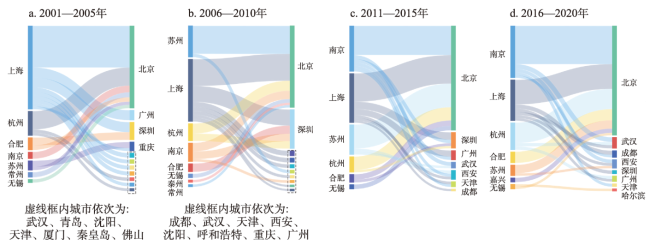
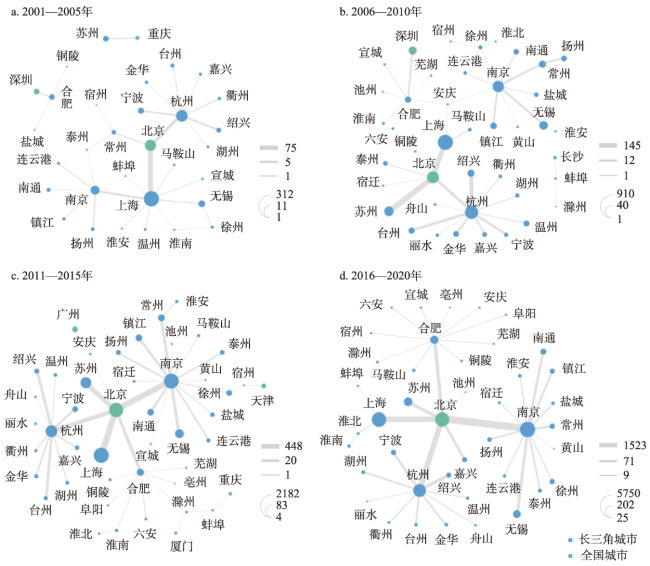
[Objective] The objective of this study was to reveal the multi-scale spatial patterns, organization, and evolution of university-industry (U-I) collaborative innovation in the Yangtze River Delta region, and propose policy recommendations for the spatial optimization of regional U-I integration in China’s new development stage. [Methods] Based on the patent data from 2001 to 2020 and the diversified cooperation models, the spatial information of U-I linkages were explored, and the urban development and regional synergy models were identified by measuring the strength and centrality indicators. [Results] (1) As the output of U-I collaborative innovation continued to grow, intercity cooperation was becoming more frequent, and the scale and scope were gradually expanding. Although most small and medium-sized cities preferred intra-regional cooperation, its proportion showed a downward trend because the core cities preferred inter-regional cooperation. (2) With the improvement of the U-I collaborative innovation capabilities of small and medium-sized cities, regional development had changed from relying on the core cities to urban agglomerations for coordinated development, while the spatial imbalance of the internal network of the Yangtze River Delta had been declining. Under the strong influence of Beijing, cooperation outside the region became further agglomerated. In general, the U-I integration had evolved into a single-center, hub-and-spoke, and multi-level structure at the network level, strong administrative barriers existed, the connection between regional subnetworks was not close enough, and the leading function of the core cities such as Shanghai needed to be enhanced. (3) The Yangtze River Delta cities are promoting multi-scale U-I cooperation. Especially under the influence of regional integration policies, most cities tend to strengthen local and regional cooperation compared with cooperation outside the region. The evolution of the urban development models has driven the flattening of the regional hierarchical system and is also conducive to regional coordination and integrated development. To a certain extent, universities play a more critical “gatekeeping” role than enterprises in the multi-scale U-I integration. [Conclusion] Compared with the local and national scales, U-I collaborative innovation within the Yangtze River Delta has great development potential, and it is necessary to strengthen the effective flows of university and industry resources, and attach importance to their functional positioning differences in the regional integration and collaboration.
YANG Fan , DU Debin , DUAN Dezhong , SHI Wentian . The evolution of spatial patterns of university-industry collaborative innovation in the Yangtze River Delta[J]. Resources Science, 2023 , 45(3) : 668 -682 . DOI: 10.18402/resci.2023.03.15
表1 2001—2020年长三角产学协同创新发展的阶段性特征Table 1 Characteristics of the four stages of university-industry collaborative innovation in the Yangtze River Delta, 2001-2020 |
| 特征维度 | 特征指标 | 阶段1 (2001—2005年) | 阶段2 (2006—2010年) | 阶段3 (2011—2015年) | 阶段4 (2016—2020年) |
|---|---|---|---|---|---|
| 规模 | 专利产出/件 | 低(250) | 较低(908) | 较高(2132) | 高(5385) |
| 增长 | 专利产出增速/% | 高(24.7) | 较高(21.5) | 低(16.2) | 高(26.3) |
| 尺度 | 同城强度占比/% | 高(49.3) | 较高(41.5) | 低(37.4) | 低(38.8) |
| 区内跨城强度占比/% | 低(20.0) | 较高(28.0) | 较高(25.3) | 低(21.8) | |
| 区外跨城强度占比/% | 低(30.7) | 低(30.5) | 较高(37.3) | 高(39.5) | |
| 模式 | 专利产出/创新强度/% | 高(96.3) | 较高(94.4) | 较低(86.6) | 低(79.8) |
注:括号内为特征指标的年均值;专利产出与创新强度的比值反映了“产学混成组织”的创新参与度。 |
表2 2001—2020年长三角城市产学协同创新的发展模式Table 2 Development models of university-industry collaborative innovation of cities in the Yangtze River Delta, 2001-2020 |
| 发展模式 | 2001—2005年 | 2006—2010年 | 2011—2015年 | 2016—2020年 | |||||||||||||||
|---|---|---|---|---|---|---|---|---|---|---|---|---|---|---|---|---|---|---|---|
| N | N | N | N | ||||||||||||||||
| 均衡型Ⅰ | 1.8 | 2.1 | 1.5 | 5 | 2.2 | 2.3 | 2.0 | 4 | 1.8 | 2.2 | 2.1 | 5 | 1.9 | 2.2 | 2.2 | 5 | |||
| 均衡型Ⅱ | 0.7 | 1.2 | -0.2 | 1 | 0.5 | 0.9 | -0.2 | 3 | 1.5 | 1.0 | -0.2 | 3 | 1.0 | 0.8 | -0.3 | 2 | |||
| 均衡型Ⅲ | 0 | 0.7 | -0.1 | 1.4 | 1 | 1.2 | -0.4 | 0.2 | 1 | 0.7 | -0.4 | 0.2 | 1 | ||||||
| 均衡型Ⅳ | 0 | 0 | -0.4 | 0.2 | 0.4 | 1 | -0.1 | 0.2 | 1.0 | 1 | |||||||||
| 区内外向型 | -0.3 | 0.2 | -0.3 | 4 | -0.4 | 0.4 | -0.3 | 6 | -0.5 | 0.1 | -0.2 | 3 | -0.3 | 0.2 | -0.3 | 4 | |||
| 区外外向型 | -0.2 | -0.2 | 0.5 | 2 | -0.5 | -0.3 | 0.3 | 2 | 0 | 0 | |||||||||
| 内向型 | 0.1 | -0.3 | -0.3 | 3 | 1.0 | -0.5 | -0.3 | 4 | 0.3 | -0.4 | -0.4 | 4 | 0.5 | -0.4 | -0.3 | 6 | |||
| 边缘型 | -0.3 | -0.4 | -0.2 | 26 | -0.6 | -0.6 | -0.3 | 21 | -0.6 | -0.5 | -0.4 | 24 | -0.6 | -0.5 | -0.4 | 22 | |||
注:表中数值为同类型城市的 、 、 指数均值;N表示各类型的城市数量。 |
表3 2001—2020年长三角城市产学协同创新的层级体系Table 3 Hierarchical system of university-industry collaborative innovation of cities in the Yangtze River Delta, 2001-2020 |
| 层级 | 2001—2005年 | 2006—2010年 | 2011—2015年 | 2016—2020年 | |||||||
|---|---|---|---|---|---|---|---|---|---|---|---|
| 城市 | E | 城市 | E | 城市 | E | 城市 | E | ||||
| 1 | 上海1 | 4.3 | 上海1 | 3.6 | 上海1 南京1 | 3.1 | 南京1 | 3.5 | |||
| 2 | 杭州1 | 2.4 | 杭州1 | 2.5 | 杭州1 | 1.8 | 上海1 杭州1 | 2.7 | |||
| 3 | 南京1 | 1.3 | 南京1 | 1.6 | 无锡1 苏州1 | 1.2 | 无锡1 苏州1 南通2 | 0.8 | |||
| 4 | 无锡1 宁波2 | 0.7 | 无锡1 苏州3 常州2 镇江2 | 0.6 | 镇江2 常州2 南通2 徐州3 | 0.7 | 合肥4 镇江2 衢州7 徐州3 宁波7 常州5 连云港7 嘉兴7 绍兴5 扬州5 盐城7 | 0.1 | |||
| 5 | 苏州1 合肥6 南通5 镇江7 常州6 台州5 嘉兴5 马鞍山7 扬州5 淮北7 | -0.3 | 绍兴2 舟山7 嘉兴7 徐州7 扬州5 温州7 宁波5 南通5 合肥6 金华5 台州5 盐城5 泰州6 | -0.3 | 合肥4 盐城7 连云港7 宁波5 扬州5 马鞍山7 淮南7 泰州5 | -0.4 | 芜湖7 泰州5 | -0.5 | |||
注:E是不同等级城市的产学协同创新综合指数均值;边缘型城市未列出,都属于第5层级;上标表示城市类型,1-7分别指代均衡型Ⅰ、Ⅱ、Ⅲ、Ⅳ,区内、区外外向型,内向型。 |
表4 2001—2020年长三角主要城市基于大学和企业的桥接中心性(a)Table 4 Bridging centrality based on universities or enterprises of the main cities in the Yangtze River Delta, 2001-2020 |
| 城市 | 2001—2005年 | 2006—2010年 | 2011—2015年 | 2016—2020年 | |||||||||||||||
|---|---|---|---|---|---|---|---|---|---|---|---|---|---|---|---|---|---|---|---|
| 上海 | + | - | + | + | + | - | + | + | + | - | + | + | + | - | + | + | |||
| 杭州 | + | - | + | + | + | - | + | - | + | - | + | + | + | - | + | + | |||
| 南京 | + | + | + | - | + | - | + | - | + | - | + | + | + | - | + | + | |||
| 合肥 | - | - | + | - | + | - | + | - | + | - | + | - | + | - | + | + | |||
| 徐州 | - | - | - | - | - | - | - | - | - | - | + | - | - | - | + | - | |||
| 无锡 | + | + | - | + | + | + | + | + | + | + | - | + | + | + | + | + | |||
| 常州 | - | - | - | - | - | + | - | + | + | + | - | + | - | + | - | + | |||
| 苏州 | - | + | - | + | - | + | - | + | - | + | - | + | - | + | - | + | |||
| 南通 | - | + | - | + | - | + | - | - | - | + | - | - | - | + | - | + | |||
| 扬州 | - | + | - | - | + | + | - | + | - | + | - | + | - | + | - | + | |||
| 盐城 | - | - | - | - | - | + | - | - | - | + | - | - | - | + | - | - | |||
| 镇江 | - | - | - | - | + | + | - | + | + | + | - | - | + | - | - | - | |||
| 宁波 | - | + | - | + | - | + | - | + | - | + | - | + | - | + | - | + | |||
| 嘉兴 | - | + | + | - | - | + | - | - | - | + | - | - | - | + | - | - | |||
| 湖州 | - | - | - | - | - | + | - | - | - | + | - | - | - | + | - | - | |||
| 绍兴 | - | + | - | + | - | + | - | + | - | + | - | - | - | + | - | - | |||
注:符号为正(+)/负(-)表示城市基于大学(企业)的桥接中心性高于/低于总体均值,意味着大学(企业)是/不是城市参与网络合作的主要桥接机构。(a)城市的总体网络地位与基于产学主体的网络地位可能不一致。如绍兴在时段2中为均衡型Ⅱ类城市,即与全国城市的合作较弱,但基于企业的长三角-全国网络中心性符号为正,表明从总体看绍兴在长三角-全国网络中的地位不高,但从企业桥接功能看却是网络的重要节点;常州在时段1中基于产学主体的桥接中心性符号均为负,表明虽然是区外外向型城市,即产学资源的总体对外合作能力较好,但大学和企业各自的桥接功能都一般,因此无法区分主导型机构。 |
| [1] |
|
| [2] |
曹卫东, 曾刚, 朱晟君, 等. 长三角区域一体化高质量发展: 问题与出路[J]. 自然资源学报, 2022, 37(6): 1385-1402.
[
|
| [3] |
陈雯, 兰明昊, 孙伟, 等. 长三角一体化高质量发展: 内涵、现状及对策[J]. 自然资源学报, 2022, 37(6): 1403-1412.
[
|
| [4] |
闫东升, 孙伟. 长江三角洲一体化区域扩容对城市碳排放强度的影响评估与机制[J]. 资源科学, 2022, 44(7): 1358-1372.
[
|
| [5] |
|
| [6] |
|
| [7] |
|
| [8] |
|
| [9] |
|
| [10] |
|
| [11] |
|
| [12] |
|
| [13] |
|
| [14] |
|
| [15] |
马海涛. 知识流动空间的城市关系建构与创新网络模拟[J]. 地理学报, 2020, 75(4): 708-721.
[
|
| [16] |
段德忠, 杜德斌. 中国城市绿色技术创新的时空分布特征及影响因素[J]. 地理学报, 2022, 77(12): 3125-3145.
[
|
| [17] |
戴靓, 纪宇凡, 王嵩, 等. 中国城市知识创新网络的演化特征及其邻近性机制[J]. 资源科学, 2022, 44(7): 1494-1505.
[
|
| [18] |
刘承良, 闫姗姗. 中国跨国城际技术通道的空间演化及其影响因素[J]. 地理学报, 2022, 77(2): 331-352.
[
|
| [19] |
席强敏, 李国平, 孙瑜康, 等. 京津冀科技合作网络的演变特征及影响因素[J]. 地理学报, 2022, 77(6): 1359-1373.
[
|
| [20] |
付晓宁, 孙伟, 闫东升. 长三角专利转移网络的时空演化研究[J]. 长江流域资源与环境, 2021, 30(10): 2347-2359.
[
|
| [21] |
吴康敏, 张虹鸥, 叶玉瑶, 等. 粤港澳大湾区协同创新的综合测度与演化特征[J]. 地理科学进展, 2022, 41(9): 1662-1676.
[
|
| [22] |
王璐玮, 汪涛, 张晗. 全球生产网络与本土创新网络的战略耦合动态: 以中国生物医药产业为例[J]. 地理研究, 2021, 40(12): 3314-3332.
[
|
| [23] |
尚勇敏, 王振, 宓泽锋, 等. 长三角绿色技术创新网络结构特征与优化策略[J]. 长江流域资源与环境, 2021, 30(9): 2061-2069.
[
|
| [24] |
王姣娥, 杜方叶, 景悦, 等. 东北地区城际专利转移的空间-行业路径与影响因素[J]. 资源科学, 2022, 44(2): 365-374.
[
|
| [25] |
盛科荣, 王丽萍, 孙威. 网络权力、知识溢出对中国城市绿色经济效率的影响[J]. 资源科学, 2021, 43(8): 1509-1521.
[
|
| [26] |
赵林, 曹乃刚, 韩增林, 等. 中国绿色经济效率空间关联网络演变特征及影响因素[J]. 资源科学, 2021, 43(10): 1933-1946.
[
|
| [27] |
杨文龙, 杜德斌, 盛垒. 全球商品贸易网络生长特征及动力机制[J]. 资源科学, 2022, 44(3): 508-522.
[
|
| [28] |
马海涛, 胡夏青. 城市网络视角下的中国科技创新功能区划研究[J]. 地理学报, 2022, 77(12): 3104-3124.
[
|
| [29] |
孙东琪, 陆大道, 孙斌栋, 等. 从网络描述走向网络绩效: “城市网络外部性”专辑序言[J]. 地理研究, 2022, 41(9): 2325-2329.
[
|
| [30] |
|
| [31] |
|
| [32] |
|
| [33] |
|
| [34] |
杨凡. 大学对城市经济发展的影响研究: 基于产学联系的视角[D]. 上海: 华东师范大学, 2019.
[
|
| [35] |
李新, 李柏洲. 哈长城市群协同创新网络结构洞与中间人研究: 基于专利数据的产学研网络与城际关系网络双维度测量[J]. 科技进步与对策, 2020, 37(14): 66-75.
[
|
| [36] |
万媛媛, 王秋玉, 曾刚, 等. 高校与生物医药企业创新结网的影响机制: 以长三角为例[J]. 经济地理, 2022, 42(7): 146-158.
[
|
| [37] |
|
| [38] |
|
| [39] |
宓泽锋, 尚勇敏, 徐维祥, 等. 长三角创新产学合作与企业创新绩效: 尺度与效应[J]. 地理研究, 2022, 41(3): 647-662.
[
|
| [40] |
叶雷, 曾刚, 曹贤忠, 等. 中国城市创新网络模式划分及效率比较[J]. 长江流域资源与环境, 2019, 28(7): 1511-1519.
[
|
| [41] |
|
| [42] |
|
/
| 〈 |
|
〉 |