
The enabling effect of digital economy on urban industrial carbon productivity in China
Received date: 2022-06-29
Revised date: 2022-09-17
Online published: 2023-02-25
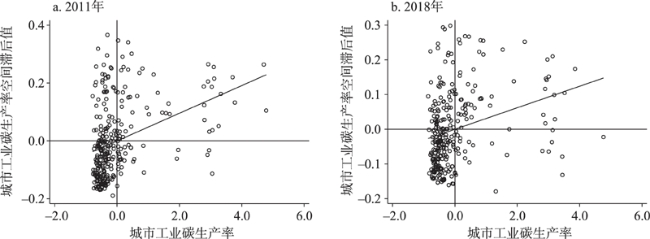
As an important engine of green and low-carbon industrial transformation in China, the role of digital economy in further promoting urban industry to achieve dual economic and environmental benefits needs to be examined. Based on the panel data of 284 prefecture-level cities in China from 2011 to 2018, this study analyzed the enabling effect of digital economy on urban industrial carbon productivity by measuring and analyzing the spatial-temporal characteristics of urban industrial carbon productivity using the methods of unexpected super-efficiency Epsilon Based Measure (EBM) model, exploratory spatial data analysis, and spatial econometric model. The results are as follows: (1) China’s urban industrial carbon productivity showed an overall trend of fluctuating growth, the positive spatial correlation and spatial agglomeration of urban industrial carbon productivity are significant, with high-high and low-low agglomerations coexisting, and spatial disequilibrium still exists. (2) Digital economy can empower urban industrial carbon productivity, and there is an obvious spatial spillover effect. That is to say, digital economy is not only conducive to improving local industrial carbon productivity, but also releases promoting dividends to the industrial carbon productivity of neighboring cities through spillover effect. This conclusion is still valid after a series of robustness tests and endogeneity tests. (3) The enabling effect of digital economy on urban industrial carbon productivity is mainly realized through structural optimization effect. At present, green technology innovation has not played a mechanism role. (4) The enabling effect of digital economy on urban industrial carbon productivity is spatially heterogeneous due to urban location and innovation environment differences. The digital economy in eastern China has a radiative driving effect on the industrial carbon productivity of surrounding cities, while the high talent agglomeration areas showed a negative spillover effect. In the future, we should pay attention to the spatial spillover effect of digital economy, eliminate the governance mode of “each party fighting its own battle”, use digital technology to build an inter-city green collaborative governance system, and break through geographical boundaries to form joint force of regional industrial carbon reduction.
REN Xiaosong , SUN Sha . The enabling effect of digital economy on urban industrial carbon productivity in China[J]. Resources Science, 2022 , 44(12) : 2399 -2414 . DOI: 10.18402/resci.2022.12.02
表1 城市数字经济发展水平评价体系Table 1 Evaluation indicator system of urban digital economy development level |
| 一级指标 | 二级指标 | 三级指标 | 指标属性 |
|---|---|---|---|
| 数字经济综合发展指数 | 数字基础设施 | 每百人移动电话用户数/(户/百人) | 正向 |
| 每百人互联网用户数/(户/百人) | 正向 | ||
| 数字产业基础 | 人均电信业务收入/(万元/人) | 正向 | |
| 数字创新能力 | 计算机和软件从业人员占单位从业人员占比/% | 正向 | |
| 每万人数字经济相关专利数/(件/万人) | 正向 | ||
| 数字化应用 | 数字普惠金融指数 | 正向 |
表2 变量描述性统计Table 2 Descriptive statistics of variables |
| 变量 | 观测值 | 最小值 | 最大值 | 均值 | 标准差 |
|---|---|---|---|---|---|
| cp | 2272 | 0.007 | 1.574 | 0.213 | 0.238 |
| dige | 2272 | 0.025 | 0.614 | 0.200 | 0.080 |
| lnps | 2272 | 1.629 | 7.882 | 5.750 | 0.915 |
| lnfirm | 2272 | 2.996 | 10.631 | 6.574 | 1.092 |
| lnae | 2272 | 2.457 | 11.856 | 7.525 | 1.546 |
| fdi | 2272 | 0.001 | 0.773 | 0.020 | 0.029 |
| fin | 2272 | 0.015 | 6.041 | 0.247 | 0.272 |
| te | 2272 | 0.016 | 0.372 | 0.196 | 0.042 |
| is | 2272 | 0.001 | 3.430 | 0.276 | 0.211 |
| green | 2272 | 3.689 | 11.007 | 8.358 | 1.191 |
表3 2011—2018年城市工业碳生产率均值Table 3 Average urban industrial carbon productivity, 2011-2018 |
| 城市 | 均值 | 排名 | 增长率/% | 城市 | 均值 | 排名 | 增长率/% |
|---|---|---|---|---|---|---|---|
| 陇南市 | 1.091 | 1 | -0.81 | 东莞市 | 0.166 | 110 | 62.76 |
| 固原市 | 1.069 | 2 | -8.12 | 深圳市 | 0.672 | 19 | 54.64 |
| 张家界市 | 0.998 | 3 | 6.17 | 枣庄市 | 0.111 | 167 | 41.17 |
| 三亚市 | 0.975 | 4 | 0.42 | 娄底市 | 0.159 | 116 | 33.68 |
| 安康市 | 0.972 | 5 | 2.51 | 三门峡市 | 0.417 | 35 | 32.35 |
| 丽江市 | 0.935 | 6 | -10.13 | 珠海市 | 0.209 | 91 | 31.35 |
| 鄂尔多斯市 | 0.920 | 7 | 6.89 | 孝感市 | 0.108 | 176 | 30.49 |
| 商洛市 | 0.916 | 8 | 5.68 | 宣城市 | 0.294 | 50 | -27.97 |
| 黑河市 | 0.907 | 9 | 0.56 | 宜春市 | 0.233 | 75 | -26.48 |
注:由于篇幅限制,此处只列出工业碳生产率均值高于0.900、增长率大于30.00%和负增长率大于20.00%的3类城市。 |
表4 2011—2018年城市工业碳生产率全局自相关检验结果Table 4 Global autocorrelation test results of urban industrial carbon productivity, 2011-2018 |
| 年份 | 2011 | 2012 | 2013 | 2014 | 2015 | 2016 | 2017 | 2018 |
|---|---|---|---|---|---|---|---|---|
| Moran’s I | 0.048*** | 0.064*** | 0.049*** | 0.047*** | 0.054*** | 0.049*** | 0.034*** | 0.031*** |
| Z值 | 10.083 | 13.219 | 10.469 | 9.897 | 11.375 | 10.422 | 7.349 | 6.766 |
| P值 | 0.000 | 0.000 | 0.000 | 0.000 | 0.000 | 0.000 | 0.000 | 0.000 |
注:***表示1%的水平上显著,下同。 |
表5 空间计量模型适配性检验结果Table 5 Suitability test results of spatial econometric model |
| 检验方法 | 统计值 | P值 |
|---|---|---|
| LM-lag | 27.431*** | 0.000 |
| Robust-LM-lag | 127.320*** | 0.000 |
| LM-error | 314.251*** | 0.000 |
| Robust-LM-error | 414.139*** | 0.000 |
| Wald_spatial_lag | 24.670*** | 0.001 |
| Wald_spatial_error | 23.240*** | 0.002 |
| LR_spatial_lag | 23.290*** | 0.002 |
| LR_spatial_error | 24.830*** | 0.001 |
| Hausman检验 | 133.410*** | 0.000 |
| LR_SDM_ind | 25.830*** | 0.004 |
| LR_SDM_time | 2629.040*** | 0.000 |
表6 数字经济对城市工业碳生产率的赋能效应估计结果Table 6 Estimation results of the enabling effect of digital economy on urban industrial carbon productivity |
| cp | ||||
|---|---|---|---|---|
| (1)普通面板模型 | (2)空间固定效应 | (3)时间固定效应 | (4)时空双固定效应 | |
| dige | 0.507*** | 0.448*** | 1.128*** | 0.433*** |
| (3.33) | (3.11) | (9.74) | (3.01) | |
| lnps | -0.060 | -0.052 | -0.064*** | -0.056 |
| (-0.85) | (-0.73) | (-7.05) | (-0.79) | |
| lnirm | -0.057*** | -0.044*** | -0.141*** | -0.048*** |
| (-4.58) | (-3.31) | (-23.63) | (-3.60) | |
| fin | -0.043** | -0.044*** | 0.107*** | 0.046*** |
| (-3.08) | (3.29) | (5.77) | (-3.38) | |
| fdi | 0.051 | 0.002 | -0.162 | -0.009 |
| (0.44) | (0.01) | (-1.06) | (-0.08) | |
| lnae | 0.023*** | 0.025*** | -0.006 | 0.026*** |
| (2.94) | (3.40) | (-1.03) | (3.42) | |
| te | -0.105 | -0.025 | -0.158 | 0.020 |
| (-0.81) | (-0.20) | (-1.23) | (0.16) | |
| W×dige | -0.188 | 0.491* | 5.231*** | |
| (-1.08) | (0.55) | (3.28) | ||
| W×lnps | 0.243 | 0.287*** | 0.365 | |
| (0.51) | (3.24) | (0.65) | ||
| W×lnfirm | -0.128 | 0.213*** | -0.074 | |
| (0.07) | (3.13) | (-0.77) | ||
| W×fin | -0.081 | 0.382* | -0.024 | |
| (-0.92) | (1.75) | (-0.16) | ||
| W×fdi | 2.251** | -5.622*** | 1.681 | |
| (2.07) | (-3.21) | (1.42) | ||
| W×lnae | -0.046 | 0.011 | -0.033 | |
| (-1.44) | (0.18) | (-0.44) | ||
| W×te | 0.465 | -0.412 | -3.957*** | |
| (1.13) | (-0.38) | (-3.25) | ||
| Spatial rho | 0.644*** | 0.556*** | 0.342** | |
| (7.12) | (4.58) | (2.12) | ||
| Loglikelihood | 1969.607 | 668.003 | 1982.523 | |
| N | 2272 | 2272 | 2272 | 2272 |
注:*、**、***分别表示10%、5%、1%的水平上显著,括号中数值为t值;下同。 |
表7 数字经济对工业碳生产率的赋能效应影响估计Table 7 Impact of the enabling effects of digital economy on industrial carbon productivity |
| 直接效应 | 间接效应 | 总效应 | |
|---|---|---|---|
| dige | 0.453*** | 8.437*** | 8.891*** |
| (3.15) | (2.63) | (2.77) | |
| lnps | -0.062 | 0.560 | 0.498 |
| (-1.05) | (0.60) | (0.54) | |
| lnfirm | -0.048*** | -0.147 | -1.195 |
| (-3.33) | (-0.80) | (-1.08) | |
| fin | -0.045*** | -0.062 | -0.106 |
| (-3.07) | (-0.20) | (-0.34) | |
| fdi | -0.026 | -2.762 | 2.735 |
| (-0.21) | (1.16) | (1.15) | |
| lnae | 0.026*** | -0.047 | -0.021 |
| (3.49) | (-0.38) | (-0.17) | |
| te | 0.009 | -6.189** | -6.180** |
| (0.07) | (-2.34) | (-2.35) |
表8 稳健性检验Table 8 Robustness test |
| 变量名称 | 效应类型 | cp | lnce | cp | ||||
|---|---|---|---|---|---|---|---|---|
| (1)邻接矩阵 | (2)经济距离矩阵 | (3)复合矩阵 | (4)替换Y | (5)1%缩尾处理 | ||||
| dige | 直接效应 | 0.920*** | 0.944*** | 0.719*** | 4.593*** | 0.637*** | ||
| (7.82) | (8.58) | (6.08) | (14.73) | (4.29) | ||||
| 间接效应 | 0.930*** | 1.751*** | 2.064*** | 18.294* | 11.733*** | |||
| (4.98) | (6.34) | (7.92) | (1.65) | (3.10) | ||||
| 总效应 | 1.850*** | 2.695*** | 2.782*** | 22.987** | 12.370*** | |||
| (10.96) | (10.29) | (12.16) | (2.06) | (3.27) | ||||
| 控制变量 | 是 | 是 | 是 | 是 | 是 | |||
表9 内生性检验结果Table 9 Results of endogeneity tests |
| (1)GS2SLS | (2)SPGMM | |
|---|---|---|
| dige | 0.117*** | 0.300*** |
| (3.12) | (4.97) | |
| Spatial rho | 1.098*** | 0.021*** |
| 控制变量 | 是 | 是 |
| Loglikelihood | 1055.381 | 514.868 |
| N | 2272 | 2272 |
表10 传导路径检验结果Table 10 Test results of indirect paths |
| cp | is | cp | cp | green | cp | ||||||
|---|---|---|---|---|---|---|---|---|---|---|---|
| (1) | (2) | (3) | (4) | (5) | (6) | ||||||
| dige | 0.433*** | 0.308*** | 0.411*** | 0.433*** | 0.098 | 0.437*** | |||||
| (3.01) | (2.20) | (2.86) | (3.01) | (0.44) | (3.03) | ||||||
| is | 0.082*** | ||||||||||
| (3.63) | |||||||||||
| green | -0.025 | ||||||||||
| (-1.20) | |||||||||||
| Spatial rho | 0.342** | 0.342** | 0.342** | 0.339** | |||||||
| (2.12) | (2.12) | (2.12) | (2.10) | ||||||||
| 控制变量 | 是 | 是 | 是 | 是 | 是 | 是 | |||||
| dige空间滞后项 | 是 | 是 | 是 | 是 | |||||||
| 控制变量空间滞后项 | 是 | 是 | 是 | 是 | |||||||
| Loglikelihood | 1982.523 | 1989.092 | 1982.523 | 1983.963 | |||||||
| N | 2272 | 2272 | 2272 | 2272 | 2272 | 2272 | |||||
表11 传导路径稳健性检验结果Table 11 Robustness test results of indirect paths |
| cp | is | cp | cp | green | cp | ||||||
|---|---|---|---|---|---|---|---|---|---|---|---|
| (1) | (2) | (3) | (4) | (5) | (6) | ||||||
| dige | 0.505*** | 0.308*** | 0.477*** | 0.505*** | 0.098 | 0.505*** | |||||
| (3.53) | (2.20) | (3.34) | (3.53) | (0.44) | (3.53) | ||||||
| is | 0.083*** | ||||||||||
| (3.62) | |||||||||||
| green | -0.048 | ||||||||||
| (-1.78) | |||||||||||
| Spatial rho | 0.105*** | 0.101*** | 0.105*** | 0.106*** | |||||||
| (3.71) | (3.59) | (3.71) | (3.77) | ||||||||
| 控制变量 | 是 | 是 | 是 | 是 | |||||||
| dige空间滞后项 | 是 | 是 | |||||||||
| 控制变量空间滞后项 | 是 | 是 | |||||||||
| Loglikelihood | 1978.873 | 1987.022 | 1978.873 | 1980.508 | |||||||
| N | 2272 | 2272 | 2272 | 2272 | 2272 | 2272 | |||||
表12 异质性分析结果Table 12 Heterogeneity analysis |
| 变量名称 | 效应类型 | cp | |||
|---|---|---|---|---|---|
| (1)东部地区 | (2)中西部地区 | (3)高人才集聚区 | (4)低人才集聚区 | ||
| dige | 直接效应 | 0.868*** | 0.395 | 0.955*** | 0.350* |
| (8.23) | (1.55) | (8.01) | (1.88) | ||
| 间接效应 | 1.132** | 0.363 | -1.239*** | 0.392 | |
| (2.52) | (0.98) | (-6.51) | (1.13) | ||
| 总效应 | 2.000*** | 0.758*** | -0.284* | 0.742** | |
| (4.93) | (2.89) | (-1.89) | (2.61) | ||
| 控制变量 | 是 | 是 | 是 | 是 | |
| [1] |
余海华. 中国数字经济空间关联及其驱动因素研究[J]. 统计与信息论坛, 2021, 36(9): 23-34.
[
|
| [2] |
|
| [3] |
|
| [4] |
陈彦斌, 林晨, 陈小亮. 人工智能、老龄化与经济增长[J]. 经济研究, 2019, 54(7): 47-63.
[
|
| [5] |
黄群慧, 余泳泽, 张松林. 互联网发展与制造业生产率提升: 内在机制与中国经验[J]. 中国工业经济, 2019, (8): 5-23.
[
|
| [6] |
|
| [7] |
荆文君, 孙宝文. 数字经济促进经济高质量发展: 一个理论分析框架[J]. 经济学家, 2019, (2): 66-73.
[
|
| [8] |
张勋, 杨桐, 汪晨, 等. 数字金融发展与居民消费增长: 理论与中国实践[J]. 管理世界, 2020, 36(11): 48-63.
[
|
| [9] |
赵涛, 张智, 梁上坤. 数字经济、创业活跃度与高质量发展: 来自中国城市的经验证据[J]. 管理世界, 2020, 36(10): 65-76.
[
|
| [10] |
许恒, 张一林, 曹雨佳. 数字经济、技术溢出与动态竞合政策[J]. 管理世界, 2020, 36(11): 63-84.
[
|
| [11] |
韩先锋, 宋文飞, 李勃昕. 互联网能成为中国区域创新效率提升的新动能吗?[J]. 中国工业经济, 2019, (7): 119-136.
[
|
| [12] |
韩璐, 陈松, 梁玲玲. 数字经济、创新环境与城市创新能力[J]. 科研管理, 2021, 42(4): 35-45.
[
|
| [13] |
周青, 王燕灵, 杨伟. 数字化水平对创新绩效影响的实证研究: 基于浙江省73个县(区、市)的面板数据[J]. 科研管理, 2020, 41(7): 120-129.
[
|
| [14] |
|
| [15] |
周文辉, 王鹏程, 杨苗. 数字化赋能促进大规模定制技术创新[J]. 科学学研究, 2018, 36(8): 1516-1523.
[
|
| [16] |
杨德明, 刘泳文. “互联网+”为什么加出了业绩?[J]. 中国工业经济, 2018, (5): 80-98.
[
|
| [17] |
|
| [18] |
|
| [19] |
许钊, 高煜, 霍治方. 数字金融的污染减排效应[J]. 财经科学, 2021, (4): 28-39.
[
|
| [20] |
|
| [21] |
|
| [22] |
|
| [23] |
张少华, 陈治. 数字经济与区域经济增长的机制识别与异质性研究[J]. 统计与信息论坛, 2021, 36(11): 14-27.
[
|
| [24] |
|
| [25] |
|
| [26] |
刘传明, 马青山. 网络基础设施建设对全要素生产率增长的影响研究: 基于“宽带中国”试点政策的准自然实验[J]. 中国人口科学, 2020, (3): 75-88.
[
|
| [27] |
李子豪, 白婷婷. 政府环保支出、绿色技术创新与雾霾污染[J]. 科研管理, 2021, 42(2): 52-63.
[
|
| [28] |
任亚运, 张广来. 城市创新能够驱散雾霾吗? 基于空间溢出视角的检验[J]. 中国人口·资源与环境, 2020, 30(2): 111-120.
[
|
| [29] |
刘强, 马彦瑞, 徐生霞. 数字经济发展是否提高了中国绿色经济效率?[J]. 中国人口·资源与环境, 2022, 32(3): 72-85.
[
|
| [30] |
韩健, 李江宇. 数字经济发展对产业结构升级的影响机制研究[J]. 统计与信息论坛, 2022, 37(7): 13-25.
[
|
| [31] |
逯进, 李婷婷. 产业结构升级、技术创新与绿色全要素生产率: 基于异质性视角的研究[J]. 中国人口科学, 2021, (4): 86-97.
[
|
| [32] |
靳毓, 文雯, 何茵. 数字化转型对企业绿色创新的影响: 基于中国制造业上市公司的经验证据[J]. 财贸研究, 2022, 33(7): 69-83.
[
|
| [33] |
宋德勇, 朱文博, 丁海. 企业数字化能否促进绿色技术创新? 基于重污染行业上市公司的考察[J]. 财经研究, 2022, 48(4): 34-48.
[
|
| [34] |
徐维祥, 周建平, 刘程军. 数字经济发展对城市碳排放影响的空间效应[J]. 地理研究, 2022, 41(1): 111-129.
[
|
| [35] |
|
| [36] |
|
| [37] |
|
| [38] |
|
| [39] |
余博, 潘爱民. 数字经济、人才流动与长三角地区高质量发展[J]. 自然资源学报, 2022, 37(6): 1481-1493.
[
|
| [40] |
|
| [41] |
孟宏玮, 赵华平, 张所地. 信息基础设施建设与区域数字化创业活跃度[J]. 中南财经政法大学学报, 2022, (4): 145-160.
[
|
| [42] |
伍国勇, 孙小钧, 于福波, 等. 中国种植业碳生产率空间关联格局及影响因素分析[J]. 中国人口·资源与环境, 2020, 30(5): 46-57.
[
|
| [43] |
王东, 李金叶. 财政分权对环境污染的空间效应[J]. 中国人口·资源与环境, 2021, 31(2): 44-51.
[
|
| [44] |
李子豪, 袁丙兵. 地方政府的雾霾治理政策作用机制: 政策工具、空间关联和门槛效应[J]. 资源科学, 2021, 43(1): 40-56.
[
|
| [45] |
彭山桂, 孙昊, 郭正宁, 等. 土地资源空间错配对城市产业转型升级的影响及作用机制[J]. 资源科学, 2022, 44(5): 871-885.
[
|
| [46] |
李在军, 胡美娟, 张爱平, 等. 工业生态效率对PM2.5污染的影响及溢出效应[J]. 自然资源学报, 2021, 36(3): 737-751.
[
|
| [47] |
韩海彬, 牛可萌. 技术异质性下中国三大城市群工业用地利用效率评价[J]. 资源科学, 2021, 43(6): 1193-1207.
[
|
| [48] |
邓光耀, 张忠杰. 基于网络SBM-DEA模型和GML指数的中国各省工业用水效率研究[J]. 自然资源学报, 2019, 34(7): 1457-1470.
[
|
| [49] |
任晓松, 刘宇佳, 赵国浩. 经济集聚对碳排放强度的影响及传导机制[J]. 中国人口·资源与环境, 2020, 30(4): 95-106.
[
|
| [50] |
袁航, 朱承亮. 国家高新区推动了中国产业结构转型升级吗?[J]. 中国工业经济, 2018, (8): 60-77.
[
|
| [51] |
占华, 后梦婷, 檀菲菲. 智能化发展对中国企业绿色创新的影响: 基于新能源产业上市公司的证据[J]. 资源科学, 2022, 44(5): 984-993.
[
|
| [52] |
于伟, 张鹏, 姬志恒. 中国城市群生态效率的区域差异、分布动态和收敛性研究[J]. 数量经济技术经济研究, 2021, 38(1): 23-42.
[
|
| [53] |
李德山, 张郑秋, 付磊, 等. 中国城市PM2.5减排效率的区域差异及其影响机制[J]. 中国人口·资源与环境, 2021, 31(4): 74-85.
[
|
| [54] |
胡志强, 苗健铭, 苗长虹. 中国地市工业集聚与污染排放的空间特征及计量检验[J]. 地理科学, 2018, 38(2): 168-176.
[
|
| [55] |
林江彪, 王亚娟, 张小红, 等. 黄河流域城市资源环境效率时空特征及影响因素[J]. 自然资源学报, 2021, 36(1): 208-222.
[
|
| [56] |
|
| [57] |
韩峰, 谢锐. 生产性服务业集聚降低碳排放了吗? 对我国地级及以上城市面板数据的空间计量分析[J]. 数量经济技术经济研究, 2017, 34(3): 40-58.
[
|
| [58] |
李小平, 余东升, 余娟娟. 异质性环境规制对碳生产率的空间溢出效应: 基于空间杜宾模型[J]. 中国软科学, 2020, (4): 82-96.
[
|
| [59] |
刘传江, 胡威. 外商直接投资提升了中国的碳生产率吗? 基于空间面板Durbin模型的经验分析[J]. 世界经济研究, 2016, (1): 99-109.
[
|
| [60] |
邵帅, 李欣, 曹建华. 中国的城市化推进与雾霾治理[J]. 经济研究, 2019, 54(2): 148-165.
[
|
/
| 〈 |
|
〉 |