
Green development effect of agricultural socialized services: An analysis based on farming households’ perspective
Received date: 2022-06-13
Revised date: 2022-08-10
Online published: 2022-11-25
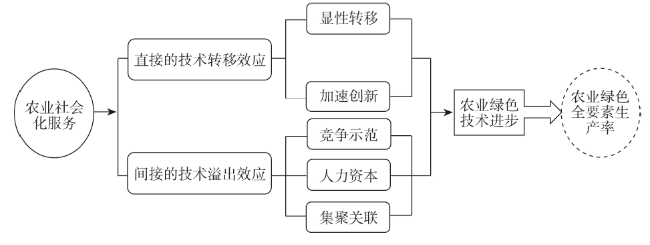
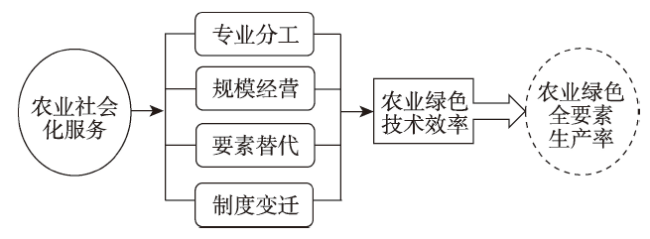
Agricultural socialized services are considered an effective path and strategic choice in practice and policy design for small farming households’ connection to modern agriculture and a realistic starting point to enhance agricultural green total factor productivity (AGTFP), and help promote green development of agriculture and rural areas. This study started from the micro-subjects that account for an absolute majority of the current agricultural production and operation, constructed short balanced panel data with the latest three sample periods of 2014, 2016 and 2018 from the large sample of the China Family Panel Studies (CFPS), measured the development level of socialized services and green agriculture at the farming household level through input-output-based measures and Malmquist-Luenberger index, and used a threshold effect model to empirically test the results. It was found that: (1) Agricultural socialized services affect the input structure and quality of agricultural production factors of farming households, and may improve agricultural green total factor productivity by increasing positive output and reducing negative output; (2) Under the guidance of the family efficacy maximization target, this impact has a “moderate boundary”, which may break the “glass curtain wall” of the radiation and diffusion of agricultural technology through direct transfer and indirect technology spillover, and affect the progress of green agricultural technology changes. The effect of factor substitution and institutional change eliminates “hidden barriers”, affects the technical efficiency of green agriculture, and jointly promotes the development of green agriculture for farming households. (3) The overall effect of agricultural socialized services on AGTFP shows a U-shaped relationship, with a greater effect of promoting decline than promoting increase, and shows obvious heterogeneity in terms of gender of household head, village distance, and regional environment. Accordingly, it is suggested that we should deeply understand the basic national and agricultural conditions, continue to accelerate the development of agricultural socialized services, promote farming households’ income generation and cost saving, transform farming households’ agricultural production methods, and accelerate the process of agricultural modernization with Chinese characteristics.
CHENG Yongsheng , ZHANG Deyuan , WANG Xia . Green development effect of agricultural socialized services: An analysis based on farming households’ perspective[J]. Resources Science, 2022 , 44(9) : 1848 -1864 . DOI: 10.18402/resci.2022.09.09
表1 改进后的农户绿色发展测算体系Table 1 Improved green development measurement system for farming households |
| 目标层 | 一级指标维度 | 二级指标维度 | 具体变量及说明 | 指标单位 | 符号 |
|---|---|---|---|---|---|
| 农业绿色全要素生产率(AGTFP) | 投入指标 | 资本 | 农户农业生产的流动性资本投入与固定性资本投入之和 | 元 | x1 |
| 劳动力 | 过去12个月,您家哪些家庭成员参与了自家农业方面的生产活动?注:“从事自家农业名单”不包括受雇于其他人而从事农业生产工作 | 人 | x2 | ||
| 土地资源 | 承包地与租用地面积之和 | 亩 | x3 | ||
| 期望产出指标 | 农产品总产出 | 过去12个月,家庭所生产农产品、养殖物及副产品销售收入以及自家消费总值之和 | 元 | y1 | |
| 非期望产出指标 | 农业面源污染 | 农业化学需氧量(COD)等标排放量 | t | yu2 | |
| 农业总氮(TN)等标排放量 | yu3 | ||||
| 农业总磷(TP)等标排放量 | yu4 | ||||
| 主观污染感知度 | 虚拟户主对环境污染问题严重度的感知,0代表不严重,10代表非常严重 | 分 | yu1 |
表2 变量的描述性统计Table 2 Descriptive statistics of variables |
| 变量 | 符号 | 变量释义 | 样本量 | 均值 | 标准差 | 最大值 | 最小值 | ||
|---|---|---|---|---|---|---|---|---|---|
| 被解释变量 | gtfp_u1 | 农业绿色全要素生产率 | 6490 | 1.0030 | 0.1307 | 3.7512 | 0.2393 | ||
| gtfp_u3 | 6490 | 1.0074 | 0.1881 | 5.4701 | 0.2663 | ||||
| 核心解释变量 | service | 农业社会化服务 | 9735 | 13.0010 | 15.4192 | 100.0000 | 0.0000 | ||
| 控制变量 | sex | 性别 | 9735 | 0.5345 | 0.4988 | 1.0000 | 0.0000 | ||
| age | 年龄/岁 | 9735 | 51.9261 | 11.2644 | 84.0000 | 13.0000 | |||
| marriage | 婚姻状况 | 9735 | 0.9147 | 0.2793 | 1.0000 | 0.0000 | |||
| education | 户主平均受教育年限/年 | 9735 | 5.5252 | 3.9206 | 19.0000 | 2.0000 | |||
| communist | 政治面貌 | 9735 | 0.0858 | 0.2800 | 1.0000 | 0.0000 | |||
| physical | 健康状况 | 9735 | 5.6178 | 1.0685 | 7.0000 | 2.0000 | |||
| population | 家庭人口数/人 | 9735 | 5.3182 | 1.2920 | 11.0000 | 1.0000 | |||
| old | 60岁以上老人数/人 | 9735 | 1.6740 | 1.0789 | 5.0000 | 0.0000 | |||
| aveedu | 家庭平均受教育年限/年 | 9735 | 5.6946 | 2.4534 | 18.0000 | 1.0000 | |||
| aveage | 家庭平均年龄/年 | 9735 | 47.6446 | 11.0089 | 98.0000 | 2.0000 | |||
| asset | 家庭金融资产/万元 | 9735 | 2.6940 | 6.4760 | 151.5000 | 0.0000 | |||
| distance | 村委会距县城路程/km | 9735 | 28.0267 | 22.7930 | 125.0000 | 0.0000 | |||
| time | 村委会到县城花费时间/h | 9735 | 1.1466 | 1.8115 | 30.0000 | 0.0000 | |||
| economy | 村居经济状况 | 9735 | 3.6410 | 1.4291 | 7.0000 | 0.0000 | |||
| income | 村居人均纯收入/万元 | 9735 | 2.6601 | 2.0727 | 13.0000 | 1.2510 | |||
| pollution | 是否有高污染企业 | 9735 | 0.1840 | 0.3875 | 1.0000 | 0.0000 | |||
表3 门槛效应检验结果Table 3 Results of the threshold effect test |
| 门槛值 | F值 | P值 | 10%临界值 | 5%临界值 | 1%临界值 | |
|---|---|---|---|---|---|---|
| 单门槛检验 | 43.8596 | 38.36*** | 0.0000 | 15.1745 | 18.6978 | 32.6247 |
| 双门槛检验 | 44.4444 | 15.61 | 0.3300 | 19.6492 | 25.4356 | 47.1438 |
| 三门槛检验 | 45.1220 | 18.35 | 0.5100 | 20.6966 | 26.8514 | 40.1897 |
注:***、**、*分别表示在1%、5%、10%的置信水平上统计显著;下同。 |
表4 单门槛模型估计结果Table 4 Estimation results of the single-threshold model |
| 解释变量 | 被解释变量(gtfp_u1) | |||
|---|---|---|---|---|
| (1) | (2) | (3) | (4) | |
| 区间1(service≤43.8596) | -0.0141***(-2.66) | -0.0139***(-2.86) | -0.0140***(-2.74) | -0.0136***(-2.68) |
| 区间2(service>43.8596) | 0.0027***(3.09) | 0.0029**(1.98) | 0.0031***(2.65) | 0.0026***(3.28) |
| sex | - | - | - | - |
| age | - | - | -0.0004***(-4.90) | -0.0036***(-4.47) |
| marriage | - | - | 0.0161**(2.03) | 0.0155***(4.66) |
| education | - | - | 0.0022**(2.47) | 0.0031**(2.34) |
| communist | - | - | 0.0037(0.84) | 0.0029(0.65) |
| physical | - | - | 0.0081**(2.71) | 0.0093***(4.73) |
| population | - | - | 0.0059*(1.72) | 0.0061**(2.24) |
| old | - | - | -0.0072**(-2.41) | -0.0068*(-1.77) |
| aveedu | - | - | 0.0061(0.46) | 0.0058(0.69) |
| aveage | - | - | -0.0044(-1.43) | -0.0031(-1.54) |
| asset | - | - | 0.0014***(2.99) | 0.0011***(3.07) |
| distance | - | - | - | - |
| time | - | - | - | - |
| economy | - | - | - | - |
| income | - | - | 0.0110***(4.13) | 0.0106***(3.15) |
| pollution | - | - | - | - |
| 个体固定效应 | 是 | 是 | 是 | 是 |
| 时间固定效应 | 否 | 是 | 是 | 是 |
| 观测值 | 6490 | 6490 | 6490 | 6490 |
注:括号内的数字为t值;下同。 |
表5 动态门槛模型估计结果Table 5 Estimation results of dynamic threshold model |
| 解释变量 | 被解释变量(gtfp_u1) | |||
|---|---|---|---|---|
| (1) | (2) | (3) | (4) | |
| L.gtfp_u1 | - | 0.1071***(3.42) | 0.2805***(2.81) | 0.2665***(5.83) |
| 区间1(service≤门槛值) | -0.0384***(-5.97) | -0.0264***(-6.16) | -0.0400***(-5.75) | -0.0509***(-4.99) |
| 区间2(service>门槛值) | 0.0121***(9.97) | 0.0203***(9.11) | 0.0308***(7.54) | 0.0327***(4.40) |
| 控制变量 | 已控 | 已控 | 已控 | 已控 |
| 门槛值 | 39.2815 | 44.3820 | 42.9106 | 45.9981 |
| 个体固定效应 | 是 | 是 | 是 | 是 |
| 时间固定效应 | 是 | 是 | 是 | 是 |
| 观测值 | 6490 | 6490 | 6490 | 6490 |
注:L.gtfp_u1表示被解释变量gtfp_u1滞后一期变量;下同。囿于篇幅所限,控制变量估计结果未能展示。 |
表6 异质性分析Table 6 Heterogeneity analysis |
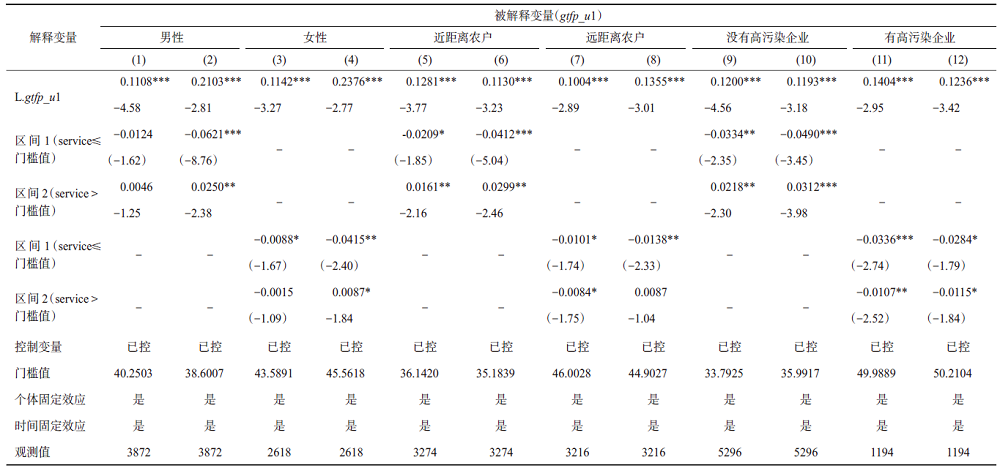 |
注:囿于篇幅,控制变量估计结果未能在表中展示。 |
表7 稳健性分析Table 7 Robustness analysis |
| 解释变量 | 被解释变量(gtfp_u3) | ||
|---|---|---|---|
| (1) | (2) | (3) | |
| L.gtfp_u3 | 0.1201***(4.29) | 0.1756***(3.47) | 0.1498***[7.83] |
| 区间1(service≤门槛值) | -0.0271**(-2.20) | -0.0290***(-4.24) | - |
| 区间2(service>门槛值) | 0.0100**(2.18) | 0.0115**(3.75) | - |
| service | - | - | -0.0014***[-4.13] |
| service2 | - | - | 0.0022***[3.46] |
| 控制变量 | 控制 | 控制 | 控制 |
| 门槛值 | 45.0299 | 44.5721 | - |
| 个体固定效应 | 是 | 是 | 是 |
| 时间固定效应 | 是 | 是 | 是 |
| 观测值 | 6490 | 6082 | 6490 |
| [1] |
阮文彪. 小农户和现代农业发展有机衔接: 经验证据、突出矛盾与路径选择[J]. 中国农村观察, 2019, (1): 15-32.
[
|
| [2] |
魏后凯, 苑鹏, 芦千文. 中国农业农村发展研究的历史演变与理论创新[J]. 改革, 2020, (10): 5-18.
[
|
| [3] |
闵师, 丁雅文, 王晓兵, 等. 小农生产中的农业社会化服务需求: 来自百乡万户调查数据[J]. 农林经济管理学报, 2019, 18(6): 795-802.
[
|
| [4] |
李荣耀. 农户对农业社会化服务的需求优先序研究: 基于15省微观调查数据的分析[J]. 西北农林科技大学学报(社会科学版), 2015, 15(1): 86-94.
[
|
| [5] |
|
| [6] |
黄斌, 高强. 农地确权对农机社会化服务的影响: 来自黄淮海农区的经验证据[J]. 资源科学, 2021, 43(6): 1115-1127.
[
|
| [7] |
刘洋, 余国新. 农业社会化服务与农业现代化耦合协调发展研究: 以新疆为例[J]. 经济问题, 2020, (8): 99-106.
[
|
| [8] |
盖美, 杨苘菲, 何亚宁. 东北粮食主产区农业绿色发展水平时空演化及其影响因素[J]. 资源科学, 2022, 44(5): 927-942.
[
|
| [9] |
杨高第, 张露, 岳梦, 等. 农业社会化服务可否促进农业减量化生产: 基于江汉平原水稻种植农户微观调查数据的实证分析[J]. 世界农业, 2020, (5): 85-95.
[
|
| [10] |
杨子, 饶芳萍, 诸培新. 农业社会化服务对土地规模经营的影响: 基于农户土地转入视角的实证分析[J]. 中国农村经济, 2019, (3): 82-95.
[
|
| [11] |
田红宇, 冯晓阳. 土地细碎化与水稻生产技术效率[J]. 华南农业大学学报(社会科学版), 2019, 18(4): 68-79.
[
|
| [12] |
张忠军, 易中懿. 农业生产性服务外包对水稻生产率的影响研究: 基于358个农户的实证分析[J]. 农业经济问题, 2015, 36(10): 69-76.
[
|
| [13] |
|
| [14] |
高梦滔, 张颖. 小农户更有效率: 八省农村的经验证据[J]. 统计研究, 2006, (8): 21-26.
[
|
| [15] |
李慧, 阴朋莉. 基于DEA-Tobit模型的生产性服务业对农业生产效率的影响: 以河南省为例[J]. 技术与创新管理, 2016, 37(6): 678-683.
[
|
| [16] |
孙顶强, 卢宇桐, 田旭. 生产性服务对中国水稻生产技术效率的影响: 基于吉、浙、湘、川4省微观调查数据的实证分析[J]. 中国农村经济, 2016, (8): 70-81.
[
|
| [17] |
杨彩艳, 齐振宏, 黄炜虹, 等. 农业社会化服务有利于农业生产效率的提高吗: 基于三阶段DEA模型的实证分析[J]. 中国农业大学学报, 2018, 23(11): 232-244.
[
|
| [18] |
林毅夫. 制度、技术与中国农业发展[M]. 上海: 上海人民出版社, 1994.
[
|
| [19] |
杨德才, 王明. 为什么小农经济会长期存在: 一个交易效率视角的探讨[J]. 农业经济问题, 2016, 37(5): 77-87.
[
|
| [20] |
罗必良, 李玉勤. 农业经营制度: 制度底线、性质辨识与创新空间: 基于“农村家庭经营制度研讨会”的思考[J]. 农业经济问题, 2014, 35(1): 8-18.
[
|
| [21] |
西奥多·W·舒尔茨. 改造传统农业[M]. 梁小民, 译. 北京: 商务印书馆, 2021.
[
|
| [22] |
蒋仁爱, 贾维晗. 信息通信技术对中国工业行业的技术外溢效应研究[J]. 财贸研究, 2019, 30(2): 1-16.
[
|
| [23] |
曹峥林. 农业生产环节服务外包对规模经济的实现机理研究[D]. 重庆: 西南大学, 2019.
[
|
| [24] |
司瑞石, 陆迁, 张强强, 等. 土地流转对农户生产社会化服务需求的影响: 基于PSM模型的实证分析[J]. 资源科学, 2018, 40(9): 1762-1772.
[
|
| [25] |
汪克亮, 庞素勤. “一带一路”倡议实施对中国沿线城市绿色转型的影响[J]. 资源科学, 2021, 43(12): 2475-2489.
[
|
| [26] |
王璐, 杨汝岱, 吴比. 中国农户农业生产全要素生产率研究[J]. 管理世界, 2020, 36(12): 77-93.
[
|
| [27] |
|
| [28] |
|
| [29] |
|
| [30] |
卢华, 陈仪静, 胡浩, 等. 农业社会化服务能促进农户采用亲环境农业技术吗?[J]. 农业技术经济, 2021, (3): 36-49.
[
|
| [31] |
吴国松, 姚升. 要素市场扭曲下农业绿色全要素生产率测度及效应研究[J]. 生态经济, 2021, 37(1): 96-102.
[
|
| [32] |
刘敏. 农机投入对农业绿色全要素生产率的影响及门槛效应研究[D]. 长春: 吉林农业大学, 2020.
[
|
/
| 〈 |
|
〉 |