
The impact of green service industry policies on China’s low-carbon economic growth
Received date: 2021-10-13
Revised date: 2022-02-16
Online published: 2022-06-25
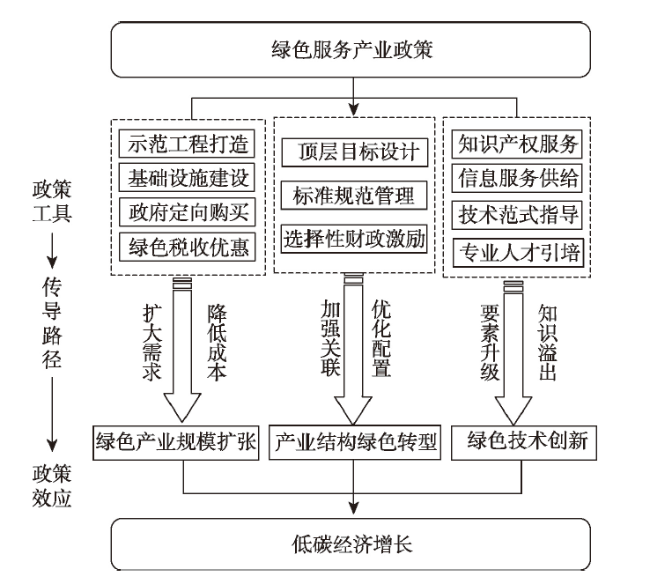
The green service industry is a supportive industry that provides intellectual support and professional services in the green industry. According to the relevant catalogues of green service industries in the Green Industry Guidance Catalogue (2019 edition), this study extracted 2921 green service industry policies from the PKULaw database and analyzed the impact of green service industry policies on low-carbon economic growth. The results show that: (1) The number of China’s green service industry policies has shown a rapid growth since 2000, and the scale of policies in the eastern region where green manufacturing is more developed is significantly larger than other regions; (2) Green service industry policies have a significant impact on low-carbon economic growth. The promotional effect is stronger in areas of China with good economic or ecological foundations; (3) China’s green service industry policies mainly promote low-carbon economic growth by expanding the scale of green industries, promoting green transition of the industrial structure, and strengthening green technological innovation. The green service industry policy system should be further improved to provide strong support for the high-quality development of green manufacturing. At the same time, attention should be paid to the heterogeneous characteristics of the green service industry policies to promote the coordinated development of different regions.
HE Dan , TANG Yahua , HU Xuhua . The impact of green service industry policies on China’s low-carbon economic growth[J]. Resources Science, 2022 , 44(4) : 730 -743 . DOI: 10.18402/resci.2022.04.07
表1 低碳经济增长评价指标体系Table 1 Evaluation indicators ystem of low-carbon economic growth |
| 一级指标 | 二级指标 | 测度指标 | 指标方向 |
|---|---|---|---|
| 能源利用 | 能源效率 | 单位GDP能源消耗量/(t标煤/元) | 负 |
| 能源结构 | 煤炭消费占能源消费比重/% | 负 | |
| 碳生产力 | 单位GDP二氧化碳排放量/(kg/万元) | 正 | |
| 环境保护 | 森林面积 | 森林面积/万hm2 | 正 |
| 人工造林面积 | 人工造林面积/hm2 | 正 | |
| 绿化覆盖面积 | 绿化覆盖面积/hm2 | 正 | |
| 水土流失治理面积 | 水土流失治理面积/千hm2 | 正 | |
| 环境基础设施建设 | 城镇环境基础设施建设投资额/亿元 | 正 | |
| 经济发展 | 经济结构 | 第三产业增加值占GDP比重/% | 正 |
| 经济效率 | 全要素生产率(无量纲) | 正 | |
| 固定资产投资 | 全社会固定资产投资/亿元 | 正 | |
| 就业人数 | 年平均从业人员数/人 | 正 | |
| 社会发展 | 人均可支配收入 | 人均可支配收入/元 | 正 |
| 失业率 | 城镇登记失业率/% | 负 | |
| 医疗条件 | 医院床位数/万张 | 正 | |
| 市容环卫 | 市容环卫专用车辆设备数量/台 | 正 | |
| 居民消费水平 | 居民消费水平/元 | 正 |
表2 绿色服务产业政策部分关键词的检索结果统计Table 2 Statistics of search results for selected keywords of green service industry policy |
| 关键词 | 频数 | 关键词 | 频数 |
|---|---|---|---|
| 环境影响评价 | 581 | 环境损害 | 57 |
| 清洁生产(审核) | 549 | 电力需求侧管理 | 55 |
| 可再生能源 | 231 | 绿色建材 | 54 |
| 碳排放(核查) | 173 | 排污许可及交易 | 50 |
| 能源管理 | 171 | 生态环境监测 | 47 |
| 企业环境(监测) | 160 | 有机食品 | 23 |
| 地质灾害危险性评估 | 152 | 污染源监测 | 11 |
| 绿色食品 | 129 | 环境标志产品 | 8 |
| 节能评估 | 121 | 能权交易 | 5 |
| 资源综合利用产品 | 88 | 水权交易 | 4 |
| 节能产品 | 87 | 能源监测 | 3 |
| 能源审计 | 80 | 低碳产品 | 2 |
| 排污权 | 78 | 节水产品 | 2 |
表3 政策效力量化标准Table 3 Quantitative criteria for policy effectiveness |
| 得分 | 评分标准 |
|---|---|
| 4 | 省政府或省人大颁布的条例、指令、规定 |
| 3 | 省政府或省人大颁布的暂行条例、暂行规定、决定、方案、意见、办法、标准,省政府职能部门颁布的条例、规定、决定 |
| 2 | 省政府职能部门颁布的意见、办法、方案、指南、暂行规定、细则、条件、标准 |
| 1 | 省政府、省人大或省政府职能部门颁布的通知、公告、名录、程序 |
表4 变量的描述性统计Table 4 Descriptive statistics of variables |
| 变量 | 单位 | 均值 | 标准差 | 最小值 | 最大值 |
|---|---|---|---|---|---|
| 低碳经济增长(LCE) | — | 0.56 | 0.33 | 0.09 | 1.40 |
| 绿色服务产业政策(g_policy) | — | 61.75 | 65.78 | 0.00 | 419.00 |
| 绿色产业规模扩张(g_indus) | — | 0.87 | 0.16 | 0.00 | 1.00 |
| 产业结构绿色转型(indus_gdtz) | — | 1.37 | 1.21 | 0.10 | 13.23 |
| 绿色技术创新(g_innov) | — | 5.97 | 1.75 | 0.00 | 9.82 |
| 经济规模(gdp) | — | 0.00 | 1.00 | -1.01 | 4.83 |
| 教育水平(edu) | % | 0.0491 | 0.0148 | 0.0248 | 0.1073 |
| 科技投入(rd) | 亿元 | 285.62 | 394.43 | 1.21 | 2343.63 |
| 政府干预程度(gov) | 亿元 | 2786.87 | 2343.44 | 105.40 | 15037.48 |
| 人力资本水平(stu) | 万人 | 491 | 231 | 61 | 1031 |
| 开放程度(fdi) | 亿元 | 1051.47 | 1733.40 | 7.47 | 17622.27 |
表5 绿色服务产业政策的低碳经济增长效应及区域异质性Table 5 Low-carbon economic growth effects of green service industry policies and regional heterogeneity |
| (1) | (2) | (3) | (4) | (5) | (6) | (7) | |||
|---|---|---|---|---|---|---|---|---|---|
| 东 | 中 | 西 | |||||||
| g_policy | 0.0019*** | 0.0017*** | 0.0020*** | 0.0010*** | 0.0046*** | ||||
| (8.76) | (8.13) | (6.32) | (3.43) | (6.88) | |||||
| g_policyt-1 | 0.0017*** | 0.0014*** | |||||||
| (7.21) | (6.49) | ||||||||
| g_policy_z | 0.0019*** | ||||||||
| (2.79) | |||||||||
| gdp | -0.1197** | -0.1464*** | -0.1549*** | -0.1063** | -0.0664 | -0.5125*** | 0.7119*** | ||
| (-2.33) | (-2.78) | (-2.78) | (-2.17) | (-1.05) | (-4.01) | (2.72) | |||
| edu | 2.0850** | 2.5048** | 1.9657* | 2.5826*** | -0.3240 | -3.8517 | 6.1230*** | ||
| (2.14) | (2.49) | (1.86) | (2.78) | (-0.21) | (-1.59) | (3.53) | |||
| stu | -0.0737*** | -0.0744*** | -0.0668*** | -0.0773*** | -0.0923*** | -0.0362 | -0.1143*** | ||
| (-4.26) | (-4.18) | (-3.56) | (-4.70) | (-3.86) | (-1.15) | (-3.04) | |||
| gov | 0.0175*** | 0.0189*** | 0.0233*** | 0.0140*** | 0.0127*** | 0.0286*** | -0.0058 | ||
| (12.76) | (13.67) | (18.23) | (9.87) | (5.45) | (8.28) | (-1.00) | |||
| rd | -0.0022** | -0.0025*** | -0.0030*** | -0.0020** | -0.0012 | -0.0027 | -0.0165*** | ||
| (-2.51) | (-2.80) | (-3.17) | (-2.42) | (-1.03) | (-0.96) | (-3.83) | |||
| fdi | -0.0005*** | -0.0003** | -0.0004*** | -0.0003*** | -0.0004*** | 0.0024** | 0.0058*** | ||
| (-4.05) | (-2.43) | (-3.16) | (-3.16) | (-3.08) | (2.02) | (3.56) | |||
| cons | 0.3317*** | 0.2953*** | 0.2549** | 0.346*** | 0.6573*** | 0.0083 | 0.9460*** | ||
| (3.39) | (2.94) | (2.40) | (3.72) | (4.77) | (0.03) | (3.41) | |||
| N | 420 | 420 | 420 | 420 | 180 | 105 | 135 | ||
| 调整后的R2 | 0.868 | 0.860 | 0.845 | 0.881 | 0.834 | 0.940 | 0.914 | ||
注:***、**、*分别代表在1%、5%、10%显著性水平上显著,括号内为t值,下同。 |
表6 绿色服务产业政策低碳经济增长效应稳健性检验结果Table 6 Robustness test results of the impact of green service industry policies on low-carbon economic growth |
| (1) | (2) | (3) | (4) | (5) | (6) | ||||||
|---|---|---|---|---|---|---|---|---|---|---|---|
| g_policy滞后一期 为工具变量 | g_policy滞后两期 为工具变量 | 截尾处理 | 0.1分位点 | 0.5分位点 | 0.9分位点 | ||||||
| g_policy | 0.0104** | 0.008*** | 0.0017*** | 0.0015*** | 0.0012*** | 0.0010*** | |||||
| (2.50) | (2.78) | (7.82) | (10.81) | (8.25) | (2.99) | ||||||
| gdp | 0.1063 | 0.1353 | -0.1789*** | -0.0670** | -0.0591** | 0.0231 | |||||
| (0.55) | (0.78) | (-3.62) | (-2.45) | (-2.12) | (0.35) | ||||||
| edu | 2.9958* | 3.4492* | 2.1120** | -0.3369 | 0.2540 | 2.5028* | |||||
| (1.79) | (1.82) | (2.25) | (-0.56) | (0.41) | (1.70) | ||||||
| stu | -0.0924** | -0.0805** | -0.0446*** | -0.0373*** | -0.0354*** | -0.0556*** | |||||
| (-2.53) | (-2.47) | (-2.76) | (-9.94) | (-9.23) | (-6.06) | ||||||
| gov | -0.0122 | -0.0080 | 0.0205*** | 0.0141*** | 0.0170*** | 0.0179*** | |||||
| (-0.84) | (-0.71) | (15.22) | (15.48) | (18.38) | (8.08) | ||||||
| rd | 0.0006 | -0.0006 | -0.0021** | -0.0005 | -0.0014*** | -0.0028** | |||||
| (0.26) | (-0.31) | (-2.28) | (-1.02) | (-2.65) | (-2.22) | ||||||
| fdi | -0.0007** | -0.0006*** | -0.0003** | -0.0005*** | -0.0005*** | -0.0003* | |||||
| (-2.45) | (-2.68) | (-2.06) | (-7.03) | (-6.56) | (-1.67) | ||||||
| cons | 0.4101 | 0.4422* | 0.1052 | 0.1922*** | 0.2629*** | 0.4335*** | |||||
| (1.58) | (1.82) | (1.12) | (4.57) | (6.12) | (4.22) | ||||||
| N | 420 | 392 | 420 | 420 | 420 | 420 | |||||
| 调整后的R2 | 0.371 | 0.567 | 0.887 | ||||||||
表7 绿色产业规模扩张路径检验Table 7 Test of green industry scale expansion path |
| 被解释变量 | (1) | (2) | (3) | (4) | (5) | (6) | (7) | ||||||
|---|---|---|---|---|---|---|---|---|---|---|---|---|---|
| g_indus | g_indus | g_indus | LCE | LCE | LCE | LCE | |||||||
| g_policy | 0.0001** | 0.0018*** | |||||||||||
| (2.05) | (8.50) | ||||||||||||
| g_policyt-1 | 0.0004*** | 0.0016*** | |||||||||||
| (7.17) | (6.37) | ||||||||||||
| g_policy_z | 0.0004** | 0.0017** | |||||||||||
| (2.11) | (2.47) | ||||||||||||
| g_indus | 0.7139*** | 0.5433*** | 0.2491 | 0.6588*** | |||||||||
| (3.41) | (2.81) | (1.17) | (3.15) | ||||||||||
| gdp | -0.2553*** | -0.2530*** | -0.2558*** | 0.0158 | 0.0190 | -0.0834 | 0.0136 | ||||||
| (-19.01) | (-20.03) | (-19.09) | (0.20) | (0.27) | (-1.11) | (0.18) | |||||||
| edu | -1.0888*** | -0.9538*** | -1.0867*** | 2.6742** | 2.6765*** | 2.7424*** | 2.6816** | ||||||
| (-4.28) | (-3.96) | (-4.27) | (2.49) | (2.71) | (2.68) | (2.51) | |||||||
| stu | 0.0457*** | 0.0448*** | 0.0465*** | -0.1024*** | -0.0985*** | -0.0856*** | -0.0975*** | ||||||
| (10.12) | (10.50) | (10.28) | (-4.88) | (-5.10) | (-4.24) | (-4.65) | |||||||
| gov | 0.0032*** | 0.0024*** | 0.0034*** | 0.0214*** | 0.0158*** | 0.0183*** | 0.0210*** | ||||||
| (8.85) | (7.12) | (11.20) | (14.69) | (10.58) | (12.46) | (14.46) | |||||||
| rd | 0.0005** | 0.0005** | 0.0004* | -0.0031*** | -0.0025*** | -0.0026*** | -0.0033*** | ||||||
| (2.12) | (2.40) | (1.80) | (-3.31) | (-2.82) | (-2.93) | (-3.48) | |||||||
| fdi | 0.0002*** | 0.0002*** | 0.0002*** | -0.000*** | -0.000*** | -0.0003*** | -0.0005*** | ||||||
| (6.78) | (8.30) | (7.03) | (-4.35) | (-4.78) | (-2.70) | (-4.07) | |||||||
| cons | 0.5709*** | 0.5731*** | 0.5644*** | -0.1349 | 0.0215 | 0.1525 | -0.1168 | ||||||
| (22.32) | (23.77) | (22.10) | (-0.85) | (0.15) | (0.97) | (-0.74) | |||||||
| N | 420 | 420 | 420 | 420 | 420 | 420 | 420 | ||||||
| 调整后的R2 | 0.903 | 0.914 | 0.903 | 0.846 | 0.870 | 0.861 | 0.848 | ||||||
表8 产业结构绿色转型路径检验Table 8 Test of industrial structure green transition path |
| 被解释变量 | (1) | (2) | (3) | (4) | (5) | (6) | (7) | ||||||
|---|---|---|---|---|---|---|---|---|---|---|---|---|---|
| indus_gdtz | indus_gdtz | indus_gdtz | LCE | LCE | LCE | LCE | |||||||
| g_policy | 0.0026*** | 0.0017*** | |||||||||||
| (2.69) | (8.25) | ||||||||||||
| g_policyt-1 | 0.0025** | 0.0015*** | |||||||||||
| (2.47) | (6.72) | ||||||||||||
| g_policy_z | 0.0029 | 0.0017*** | |||||||||||
| (0.98) | (2.60) | ||||||||||||
| indus_gdtz | 0.0803*** | 0.0684*** | 0.0712*** | 0.0789*** | |||||||||
| (7.03) | (6.43) | (6.52) | (6.94) | ||||||||||
| gdp | -2.2053*** | -2.2398*** | -2.2532*** | 0.0141 | 0.0312 | 0.0130 | 0.0228 | ||||||
| (-9.41) | (-9.59) | (-9.56) | (0.24) | (0.57) | (0.23) | (0.39) | |||||||
| edu | -10.6203** | -9.9567** | -10.7793** | 2.7637*** | 2.8117*** | 3.21344** | 2.8158*** | ||||||
| (-2.39) | (-2.23) | (-2.41) | (2.73) | (3.01) | (3.34) | (2.80) | |||||||
| stu | -0.2331*** | -0.2348*** | -0.2233*** | -0.0513*** | -0.0577*** | -0.0577*** | -0.0492*** | ||||||
| (-2.96) | (-2.97) | (-2.81) | (-2.85) | (-3.47) | (-3.38) | (-2.75) | |||||||
| gov | 0.0421*** | 0.0434*** | 0.0501*** | 0.0198*** | 0.0146*** | 0.0158*** | 0.0193*** | ||||||
| (6.75) | (7.09) | (9.27) | (14.90) | (10.59) | (11.32) | (14.50) | |||||||
| rd | 0.0287*** | 0.0283*** | 0.0275*** | -0.0050*** | -0.0042*** | -0.0045*** | -0.0052*** | ||||||
| (7.21) | (7.11) | (6.87) | (-5.29) | (-4.69) | (-5.00) | (-5.46) | |||||||
| fdi | 0.0001 | 0.0004 | 0.0002 | -0.0004*** | -0.0005*** | -0.0003*** | -0.0004*** | ||||||
| (0.24) | (0.73) | (0.43) | (-3.70) | (-4.34) | (-2.80) | (-3.50) | |||||||
| cons | 0.8697* | 0.8220* | 0.7610* | 0.2070** | 0.2722*** | 0.2368** | 0.1949* | ||||||
| (1.95) | (1.84) | (1.69) | (2.05) | (2.91) | (2.47) | (1.94) | |||||||
| N | 420 | 420 | 420 | 420 | 420 | 420 | 420 | ||||||
| 调整后的R2 | 0.363 | 0.361 | 0.352 | 0.860 | 0.880 | 0.874 | 0.862 | ||||||
表9 绿色技术创新路径检验Table 9 Test of green technology innovation path |
| 被解释变量 | (1) | (2) | (3) | (4) | (5) | (6) | (7) | ||||||
|---|---|---|---|---|---|---|---|---|---|---|---|---|---|
| g_innov | g_innov | g_innov | LCE | LCE | LCE | LCE | |||||||
| g_policy | 0.0025* | 0.0017*** | |||||||||||
| (1.95) | (8.75) | ||||||||||||
| g_policyt-1 | 0.0046*** | 0.0013*** | |||||||||||
| (3.52) | (6.22) | ||||||||||||
| g_policy_z | 0.0042 | 0.0016** | |||||||||||
| (1.10) | (2.56) | ||||||||||||
| g_innov | 0.0808*** | 0.0742*** | 0.0719*** | 0.0796*** | |||||||||
| (9.65) | (9.63) | (8.85) | (9.56) | ||||||||||
| gdp | 5.7795*** | 5.7684*** | 5.6650*** | -0.1906* | -0.0970 | -0.1196 | -0.1962* | ||||||
| (9.92) | (10.02) | (9.70) | (-1.78) | (-0.98) | (-1.16) | (-1.84) | |||||||
| edu | -0.2666 | -0.2695 | -0.3016 | -0.1417*** | -0.0999** | -0.1270*** | -0.1309*** | ||||||
| (-0.87) | (-0.89) | (-0.98) | (-2.82) | (-2.16) | (-2.64) | (-2.61) | |||||||
| stu | 7.1494 | 8.6098 | 7.0575 | 1.3315 | 1.5547* | 1.8856** | 1.4037 | ||||||
| (1.23) | (1.50) | (1.21) | (1.39) | (1.77) | (2.05) | (1.47) | |||||||
| gov | -0.3582*** | -0.3663*** | -0.3468*** | -0.0411** | -0.0471*** | -0.0481*** | -0.0392** | ||||||
| (-3.48) | (-3.60) | (-3.36) | (-2.38) | (-2.98) | (-2.91) | (-2.29) | |||||||
| rd | 0.0612*** | 0.0556*** | 0.0683*** | 0.0183*** | 0.0130*** | 0.0149*** | 0.0178*** | ||||||
| (7.50) | (7.04) | (9.72) | (14.29) | (9.82) | (11.12) | (13.91) | |||||||
| fdi | -0.0049 | -0.0049 | -0.0061 | -0.0024*** | -0.0018** | -0.0022*** | -0.0025*** | ||||||
| (-0.93) | (-0.94) | (-1.17) | (-2.74) | (-2.33) | (-2.64) | (-2.95) | |||||||
| cons | -0.0014** | -0.0010 | -0.0013* | -0.0003*** | -0.0004*** | -0.0002** | -0.0003** | ||||||
| (-2.06) | (-1.43) | (-1.87) | (-2.77) | (-3.48) | (-2.01) | (-2.59) | |||||||
| N | 420 | 420 | 420 | 420 | 420 | 420 | 420 | ||||||
| 调整后的R2 | 0.690 | 0.697 | 0.688 | 0.872 | 0.893 | 0.884 | 0.874 | ||||||
| [1] |
董直庆, 王辉. 城市财富与绿色技术选择[J]. 经济研究, 2021, 56(4): 143-159.
[
|
| [2] |
张艾莉, 陈茜. 用能权交易制度对绿色技术创新的影响效应与传导机制[J/OL]. 科技进步与对策, (2022-03-14) [2022-04-13]. https://kns.cnki.net/kcms/detail/42.1224.G3.20220310.1721.006.html.
|
| [3] |
李晓萍, 张亿军, 江飞涛. 绿色产业政策: 理论演进与中国实践[J]. 财经研究, 2019, 45(8): 4-27.
[
|
| [4] |
贺丹, 唐娅华. 中国绿色服务政策演进、协同及文本内容分析[J]. 中国环境管理, 2021, 13(3): 92-101.
[
|
| [5] |
|
| [6] |
余杨, 李传忠. 绿证交易、发售电配额制与可再生能源财税减负效应[J]. 中国人口·资源与环境, 2020, 30(2): 80-88.
[
|
| [7] |
任胜钢, 郑晶晶, 刘东华, 等. 排污权交易机制是否提高了企业全要素生产率: 来自中国上市公司的证据[J]. 中国工业经济, 2019, (5): 5-23.
[
|
| [8] |
韩超, 胡浩然. 清洁生产标准规制如何动态影响全要素生产率: 剔除其他政策干扰的准自然实验分析[J]. 中国工业经济, 2015, (5): 70-82.
[
|
| [9] |
任晓松, 马茜, 刘宇佳, 等. 碳交易政策对高污染工业企业经济绩效的影响: 基于多重中介效应模型的实证分析[J]. 资源科学, 2020, 42(9): 1750-1763.
[
|
| [10] |
|
| [11] |
|
| [12] |
|
| [13] |
|
| [14] |
刘海英, 王钰. 用能权与碳排放权可交易政策组合下的经济红利效应[J]. 中国人口·资源与环境, 2019, 29(5): 1-10.
[
|
| [15] |
|
| [16] |
|
| [17] |
彭涛, 黄福广, 孙凌霞. 税收优惠能否激励风险投资: 基于准自然实验的证据[J]. 管理世界, 2021, 37(1): 33-46.
[
|
| [18] |
陈璇, 钱薇雯. 环境规制对制造业产业转移和结构升级的双重影响[J]. 统计与决策, 2020, 36(18): 109-113.
[
|
| [19] |
|
| [20] |
陈璐怡, 周蓉, 钟文沁, 等. 绿色产业政策与重污染行业高质量发展[J]. 中国人口·资源与环境, 2021, 31(1): 111-122.
[
|
| [21] |
黎欣. 产业集聚、知识产权保护与区域创新发展[J]. 云南财经大学学报, 2021, 37(2): 1-12.
[
|
| [22] |
|
| [23] |
潘苏楠, 李北伟, 聂洪光. 中国经济低碳转型可持续发展综合评价及障碍因素分析[J]. 经济问题探索, 2019, (6): 165-173.
[
|
| [24] |
邬彩霞. 中国低碳经济发展的协同效应研究[J]. 管理世界, 2021, 37(8): 105-117.
[
|
| [25] |
范德成, 王韶华, 张伟. 低碳经济目标下一次能源消费结构影响因素分析[J]. 资源科学, 2012, 34(4): 696-703.
[
|
| [26] |
付华, 李国平, 朱婷. 中国制造业行业碳排放: 行业差异与驱动因素分解[J]. 改革, 2021, (5): 38-52.
[
|
| [27] |
王向英, 潘杰义. 基于漂移度的陕西省制造业低碳经济发展水平评价研究[J]. 科技管理研究, 2019, 39(24): 240-246.
[
|
| [28] |
杨耀武, 张平. 中国经济高质量发展的逻辑、测度与治理[J]. 经济研究, 2021, 56(1): 26-42.
[
|
| [29] |
张修凡. 碳市场流动性与区域低碳经济转型: 基于低碳技术创新的双重中介效应分析[J]. 南京财经大学学报, 2021, (6): 88-98.
[
|
| [30] |
彭纪生, 仲为国, 孙文祥. 政策测量、政策协同演变与经济绩效: 基于创新政策的实证研究[J]. 管理世界, 2008, (9): 25-36.
[
|
| [31] |
张国兴, 李佳雪, 管欣. 部际节能减排政策博弈与协同关系的演进分析[J]. 管理评论, 2019, 31(12): 250-263.
[
|
| [32] |
原毅军, 陈喆. 环境规制、绿色技术创新与中国制造业转型升级[J]. 科学学研究, 2019, 37(10): 1902-1911.
[
|
| [33] |
董直庆, 王辉. 环境规制的“本地-邻地”绿色技术进步效应[J]. 中国工业经济, 2019, (1): 100-118.
[
|
| [34] |
王霞, 张丽君, 秦耀辰, 等. 中国高碳制造业碳排放时空演变及其驱动因素[J]. 资源科学, 2020, 42(2): 323-333.
[
|
| [35] |
张华明, 元鹏飞, 朱治双. 黄河流域碳排放脱钩效应及减排路径[J]. 资源科学, 2022, 44(1): 59-69.
[
|
/
| 〈 |
|
〉 |