
Impact of the “National Comprehensive Reform Zone for Resource-Based Economy” policy on carbon emissions: A case study of Shanxi Province
Received date: 2020-06-02
Request revised date: 2020-11-03
Online published: 2021-08-25
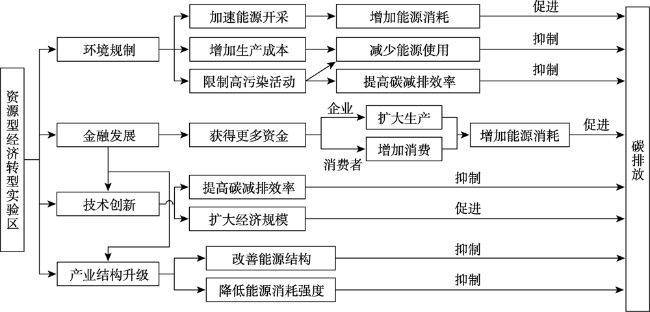
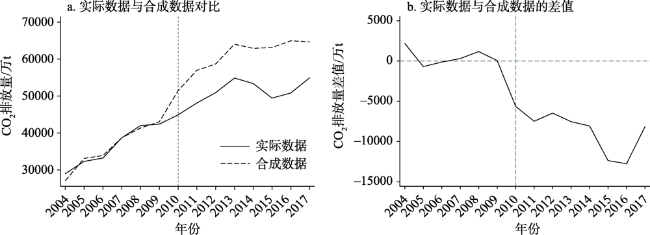
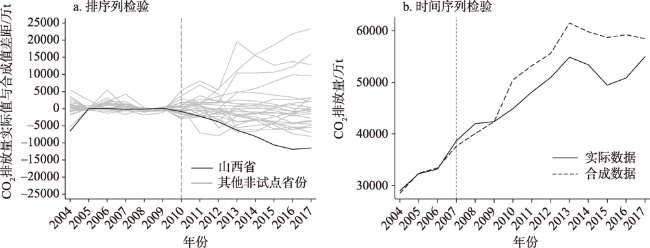
Low-carbon development has become the main theme of economic and social development in China in the new era. In the process of economic transformation of resource-based economy of Shanxi Province, reducing carbon emissions and enhancing sustainability are the foundation for the transition to high-quality development. Based on the panel data of Shanxi Province from 2004 to 2017, this study employed the synthetic control method to study the effect of the “Comprehensive Reform Zone” policy on carbon emissions. A mediating effect model was also established to investigate the key influencing factors and mechanism of influence. The results show that: (1) The reform policy of resource-based economy can effectively restrain the increase of carbon emissions in Shanxi Province. During the study period, compared with the carbon emission increase of 135.5% in the synthetically modeled result of Shanxi Province, affected by the policy, the actual carbon emissions in the province only increased by 89.6%, reducing carbon emissions by 6.55×10⁷ tons in total. (2) In the short term after the policy is implemented, environmental regulation and industrial structure upgrading both have effectively reduced carbon emissions at the 5% significance level. Environmental regulation played a mediating role while industrial structure upgrading functioned as a direct driving factor. (3) In the short term, financial development and technological innovation have increased the carbon emissions at the significance level of 10% and 5%, respectively. The results show that the policy of comprehensive reform zone has contributed to the low-carbon development of Shanxi Province by strengthening regulation and industrial transformation. However, it is still necessary to further consider the implications of financial development and scientific and technological innovations.
YU Zhihan , FANG Dan , YANG Jin . Impact of the “National Comprehensive Reform Zone for Resource-Based Economy” policy on carbon emissions: A case study of Shanxi Province[J]. Resources Science, 2021 , 43(6) : 1178 -1192 . DOI: 10.18402/resci.2021.06.10
表1 能源平均低位发热量与CO2排放系数Table 1 Average low calorific value of energy and coefficients of carbon dioxide emissions |
| 能源名称 | 煤炭 | 焦炭 | 原油 | 汽油 | 煤油 | 柴油 | 燃料油 | 天然气 |
|---|---|---|---|---|---|---|---|---|
| NCV/(kJ/kg) | 20908 | 28435 | 41816 | 43070 | 43070 | 42652 | 41816 | 38931 |
| CEF/(kg/TJ) | 95977 | 105996 | 73333 | 70033 | 71500 | 74067 | 77367 | 56100 |
表2 预测变量实际值与合成值的对比Table 2 Comparison between actual and synthetic values of predictive variables |
| 预测变量 | 单位 | 山西实际数据 | 山西合成数据 |
|---|---|---|---|
| Pgdp | 元 | 17273.71 | 19939.93 |
| Ind | % | 0.50 | 0.46 |
| Urban | % | 0.441 | 0.44 |
| Inc | 元 | 22088.71 | 21946.96 |
| Pop | 万人 | 3410.00 | 4804.10 |
| Carbon(2009年) | 万t | 42392.33 | 42341.09 |
| Carbon(2007年) | 万t | 38685.78 | 38378.91 |
| Carbon(2005年) | 万t | 32309.71 | 32997.90 |
表3 环境规制的多元回归结果Table 3 Multiple regression results of environmental regulation |
| 模型1 | 模型2 | 模型3 | |
|---|---|---|---|
| -9.34e-02*** | 66.00*** | -9.01e-02*** | |
| (0.03) | (17.10) | (0.02) | |
| 1.71e-05*** | 1.89e-05*** | ||
| (5.16e-06) | (4.24e-06) | ||
| 1.29*** | 0.96*** | ||
| (0.30) | (0.27) | ||
| 0.05*** | 0.06*** | ||
| (0.014) | (0.012) | ||
| -8.45e-06* | -1.26e-05*** | ||
| (4.70e-06) | (4.02e-06) | ||
| -2.82e-04*** | -3.03e-04*** | ||
| (3.12e-05) | (2.62e-05) | ||
| 73.28** | |||
| (28.46) | |||
| Sulfur | -1.52e-04*** | ||
| (3.68e-05) | |||
| 44.77* | |||
| (22.49) | |||
| -6.15e-04*** | |||
| (1.81e-04) | |||
| 8.35*** | -272.00 | 8.19*** | |
| (0.68) | (205.30) | (0.56) | |
| 28 | 28 | 28 | |
| Adj R2 | 0.99 | 0.68 | 0.99 |
注:***、**、* 在本文中均分别表示在1%、5%、10%水平上显著相关,下同。 |
表4 金融发展的多元回归结果Table 4 Multiple regression results of financial development |
| 模型1 | 模型2 | 模型3 | 模型4 | |
|---|---|---|---|---|
| -0.09*** | 0.79*** | -0.09*** | 0.13 | |
| (0.03) | (0.18) | (0.03) | (0.09) | |
| 1.71e-05*** | 1.04e-06 | 1.53e-05*** | -1.66e-05** | |
| (5.16e-06) | (1.10e-05) | (4.96e-06) | (6.83e-06) | |
| 1.29*** | 1.75*** | |||
| (0.30) | (0.37) | |||
| 0.05*** | 0.06*** | |||
| (0.01) | (0.01) | |||
| -8.45e-06* | -1.25e-05** | |||
| (4.70e-06) | (4.93e-06) | |||
| -2.82e-04*** | -1.88e-04*** | |||
| (3.12e-05) | (5.80e-05) | |||
| 0.83 | -0.05 | |||
| (0.57) | (0.15) | |||
| 0.10* | ||||
| (0.06) | ||||
| 8.35*** | 1.87*** | 7.26*** | 0.91*** | |
| (0.68) | (0.26) | (0.87) | (0.09) | |
| 28 | 28 | 28 | 24 | |
| Adj R2 | 0.99 | 0.58 | 0.99 | 0.83 |
表5 绿色金融的Sboel检验结果Table 5 Sboel text results of green finance |
| Coef | Std Err | z | P>|z| |
|---|---|---|---|
| 0.01 | 0.05 | 0.20 | 0.84 |
表6 技术创新的多元回归结果Table 6 Multiple regression results of technological innovation |
| 模型1 | 模型2 | 模型3 | 模型4 | |
|---|---|---|---|---|
| -0.090*** | 0.14* | -0.14*** | 0.07 | |
| (0.03) | (0.08) | (0.02) | (0.14) | |
| 1.71e-05*** | 2.22e-05** | 8.72e-06** | ||
| (5.16e-06) | (9.57e-06) | (4.00e-06) | ||
| 1.29*** | 1.37*** | -2.64e-06 | ||
| (0.30) | (0.21) | (1.63e-05) | ||
| 0.05*** | 0.05*** | |||
| (0.0141) | (9.9e-03) | |||
| -8.45e-06* | -1.22e-05*** | |||
| (4.70e-06) | (3.37e-06) | |||
| -2.82e-04*** | -2.75e-04*** | |||
| (3.12e-05) | (2.18e-05) | |||
| 3.49-03 | 1.62*** | |||
| (3.35e-03) | (0.43) | |||
| 0.96*** | 9.76e-03 | |||
| (0.25) | (0.00572) | |||
| 0.23*** | ||||
| (0.05) | ||||
| 8.35*** | -2.37 | 6.95*** | -11.26** | |
| (0.68) | (2.36) | (0.56) | (4.02) | |
| 28 | 28 | 28 | 28 | |
| Adj R2 | 0.99 | 0.98 | 0.99 | 0.97 |
表7 绿色技术创新的多元回归结果Table 7 Multiple regression results of green technological innovation |
| Coef | Std Err | z | P>|z| |
|---|---|---|---|
| 0.00 | 0.18 | 0.56 | 0.95 |
表8 产业结构升级的多元回归结果Table 8 Multiple regression results of industrial structure upgrading |
| 模型1 | 模型2 | 模型3 | |
|---|---|---|---|
| -0.09*** | 0.11*** | -0.17*** | |
| (0.03) | (0.02) | (0.03) | |
| 1.71e-05*** | 2.79e-07 | 1.26e-05** | |
| (5.16e-06) | (1.52e-06) | (4.64e-06) | |
| 1.29*** | 0.14 | ||
| (0.30) | (0.46) | ||
| 0.05*** | 0.09*** | ||
| (0.01) | (0.02) | ||
| -8.45e-06* | -1.43e-05*** | ||
| (4.70e-06) | (4.46e-06) | ||
| -2.82e-04*** | -4.56e-04*** | ||
| (3.12e-05) | (6.38e-05) | ||
| 0.06 | |||
| (0.08) | |||
| -2.10*** | |||
| (0.70) | |||
| 8.35*** | 2.23*** | 12.62*** | |
| (0.68) | (0.035) | (1.53) | |
| 28 | 28 | 28 | |
| Adj R2 | 0.99 | 0.51 | 0.99 |
| [1] |
彭红松, 郭丽佳, 章锦河, 等. 区域经济增长与资源环境压力的关系研究进展[J]. 资源科学, 2020, 42(4):593-606.
[
|
| [2] |
山西省机构编制委员会办公室, 太原市机构编制委员会办公室课题组. 国家综合配套改革试验区的发展模式和路径探析: 以山西转型综合改革示范区为例[J]. 经济问题, 2018, (11):104-109.
[Office of Shanxi Public Sector Reform Commission, Taiyuan Municipal Commission for Public Sector Reform Office Research Group. An analysis of the development mode and path of the National Comprehensive Supporting Reform Pilot Zone: A case study of Shanxi Transformation Comprehensive Reform Demonstration Zone[J]. On Economic Problems, 2018, (11):104-109.]
|
| [3] |
程栋, 王家庭. 论国家综合配套改革试验区制度创新: 基于演化阶段及实现机制的视角[J]. 贵州社会科学, 2015, (3):140-146.
[
|
| [4] |
顾颖, 李志强, 陈泽珅. 基于熵值法的山西省转型综改区建设绩效评价[J]. 经济问题, 2015, (7):120-123.
[
|
| [5] |
王家庭, 毛文峰, 杨禄. 国家综合配套改革试验区的经济溢出效应研究[J]. 区域经济评论, 2016, (3):39-47.
[
|
| [6] |
吴青龙, 朱美峰, 郭丕斌. 基于脱钩理论的资源型经济转型绩效评价研究[J]. 经济问题, 2019, (6):121-128.
[
|
| [7] |
郭淑芬, 马宇红. 资源型区域可持续发展能力测度研究[J]. 中国人口·资源与环境, 2017, 27(7):72-79.
[
|
| [8] |
郭淑芬, 郭金花. “综改区”设立、产业多元化与资源型地区高质量发展[J]. 产业经济研究, 2019, (1):87-98.
[
|
| [9] |
郭金花, 郭淑芬. 国家综合配套改革试验区设立促进了地方产业结构优化吗? 基于合成控制法的实证分析[J]. 财经科学, 2019, (8):69-81.
[
|
| [10] |
|
| [11] |
|
| [12] |
胡之光, 陈甬军. 中国“资源诅咒”现象中的体制转型因素研究[J]. 东北大学学报(社会科学版), 2019, 21(1):35-42.
[
|
| [13] |
严太华, 胡尧. 基于资源脱钩视角的资源型城市分类[J]. 资源科学, 2019, 41(12):2172-2181.
[
|
| [14] |
赵伟伟, 白永秀. 资源开发过程中腐败的发生及制度影响[J]. 资源科学, 2020, 42(2):251-261.
[
|
| [15] |
阎晓. 山西省煤炭资源型经济低碳转型研究[D]. 重庆: 西南大学, 2012.
[
|
| [16] |
徐君, 高厚宾, 王育红. 资源型城市低碳转型的“驱力-障碍”因素分析[J]. 科技管理研究, 2014, 34(24):239-242.
[
|
| [17] |
刘晓燕, 孙慧. 资源型产业碳排放驱动因素演化与低碳发展路径选择[J]. 统计与决策, 2019, 35(2):53-57.
[
|
| [18] |
谭玲玲, 肖双. 基于全要素生产率视角资源型城市低碳转型效果评价模型[J]. 中国矿业, 2018, 27(2):58-64.
[
|
| [19] |
张逸昕, 张杰. 资源型城市低碳转型阶段性及其全要素生产率评价: 基于非期望产出SBM模型[J]. 科技管理研究, 2020, 40(14):76-83.
[
|
| [20] |
|
| [21] |
|
| [22] |
张华, 魏晓平. 绿色悖论抑或倒逼减排: 环境规制对碳排放影响的双重效应[J]. 中国人口·资源与环境, 2014, 24(9):21-29.
[
|
| [23] |
王康, 李志学, 周嘉. 环境规制对碳排放时空格局演变的作用路径研究: 基于东北三省地级市实证分析[J]. 自然资源学报, 2020, 35(2):343-357.
[
|
| [24] |
|
| [25] |
朱东波, 任力, 刘玉. 中国金融包容性发展、经济增长与碳排放[J]. 中国人口·资源与环境, 2018, 28(2):66-76.
[
|
| [26] |
何运信, 许婷, 钟立新. 金融发展对二氧化碳排放的影响效应及作用路径[J]. 经济社会体制比较, 2020, (2):1-10.
[
|
| [27] |
|
| [28] |
申萌, 李凯杰, 曲如晓. 技术进步、经济增长与二氧化碳排放: 理论和经验研究[J]. 世界经济, 2012, (7):83-100.
[
|
| [29] |
张兵兵, 徐康宁, 陈庭强. 技术进步对二氧化碳排放强度的影响研究[J]. 资源科学, 2014, 36(3):567-576.
[
|
| [30] |
周迪, 王雪芹. 中国碳排放效率与产业结构升级的耦合度及耦合路径[J]. 自然资源学报, 2019, 34(11):2305-2316.
[
|
| [31] |
周迪, 罗东权. 绿色税收视角下产业结构变迁对中国碳排放的影响[J]. 资源科学, 2021, 43(4):693-709.
[
|
| [32] |
|
| [33] |
|
| [34] |
|
| [35] |
|
| [36] |
|
| [37] |
|
| [38] |
李健, 马晓芳, 苑清敏. 区域碳排放效率评价及影响因素分析[J]. 环境科学学报, 2019, 39(12):4293-4300.
[
|
| [39] |
王瑛, 何艳芬. 中国省域二氧化碳排放的时空格局及影响因素[J]. 世界地理研究, 2020, 29(3):512-522.
[
|
| [40] |
|
| [41] |
张云辉, 赵佳慧. 绿色信贷、技术进步与产业结构优化: 基于PVAR模型的实证分析[J]. 金融与经济, 2019, (4):43-48.
[
|
| [42] |
林春艳, 宫晓蕙, 孔凡超. 环境规制与绿色技术进步: 促进还是抑制: 基于空间效应视角[J]. 宏观经济研究, 2019, (11):131-142.
[
|
| [43] |
唐宇娣, 朱道林, 程建, 等. 差别定价的产业用地供应策略对产业结构升级的影响: 基于中国277个城市的实证分析[J]. 资源科学, 2020, 42(3):548-557.
[
|
| [44] |
刘乃全, 吴友. 长三角扩容能促进区域经济共同增长吗?[J]. 中国工业经济, 2017, (6):79-97.
[
|
| [45] |
|
| [46] |
温忠麟, 张雷, 侯杰泰, 等. 中介效应检验程序及其应用[J]. 心理学报, 2004, (5):614-620.
[
|
| [47] |
陈昱燃, 熊德平. 基于政府和金融机构视角下的资源转型地区绿色金融发展研究: 以山西省为例[J]. 金融理论与实践, 2019, (11):54-61.
[
|
| [48] |
唐未兵, 傅元海, 王展祥. 技术创新、技术引进与经济增长方式转变[J]. 经济研究, 2014, (7):31-43.
[
|
| [49] |
何彬, 范硕. 自主创新、技术引进与碳排放: 不同技术进步路径对碳减排的作用[J]. 商业研究, 2017, (7):58-66.
[
|
| [50] |
卢娜, 王为东, 王淼, 等. 突破性低碳技术创新与碳排放: 直接影响与空间溢出[J]. 中国人口·资源与环境, 2019, 29(5):30-39.
[
|
/
| 〈 |
|
〉 |