
The effect of feed-in tariff on China’s photovoltaic capacity development: An empirical analysis based on panel data regression
Received date: 2020-07-17
Request revised date: 2020-08-12
Online published: 2021-08-25
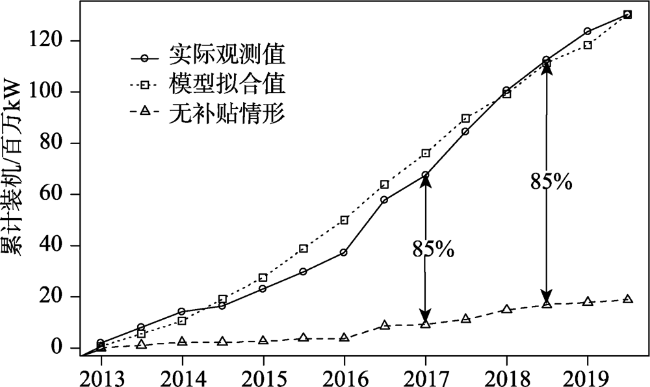
Accurately estimating the impact of government subsidy on the development of strategic new industries is a key to evidence-based decision making of subsidy policies because, on the one hand, over-subsidization will bring about fiscal pressure and overcapacity to the society, and on the other hand, under-subsidization will slow down the development of these new industries. The rapid growth of China’s photovoltaic (PV) industry is accompanied by the problems of solar curtailment and fiscal pressure which need to be solved urgently. Behind this is the lack of scientific evaluation of PV subsidy policy. This research took China’s PV industry as an example, and used panel data regression and counterfactual analysis to rigorously estimate the impact of government subsidy on PV market development. Our findings have the following indications. (1) With all other factors controlled, an increase of 0.1 yuan/kWh in PV subsidy will bring about 5.4-6.6 GW/year of installed capacity to the Chinese PV market, which is much greater than that estimated in the literature. (2) From a different perspective, if China were not having any PV subsidy in the first place, the PV market size would likely shrink by 85% compared to the actual case. (3) Taking the nine provinces with serious PV curtailment in the first half year of 2019 as the case, if PV subsidies were adjusted to a level where there is no curtailment, the subsidy deficit will be reduced by about RMB 1.3 billion yuan per year for these provinces. The conclusions of this research can be applied to optimizing the subsidy policy design and mitigating policy problems including PV curtailment and subsidy deficit.
DONG Changgui , ZHOU Runmin , LI Jiaying . The effect of feed-in tariff on China’s photovoltaic capacity development: An empirical analysis based on panel data regression[J]. Resources Science, 2021 , 43(6) : 1065 -1076 . DOI: 10.18402/resci.2021.06.01
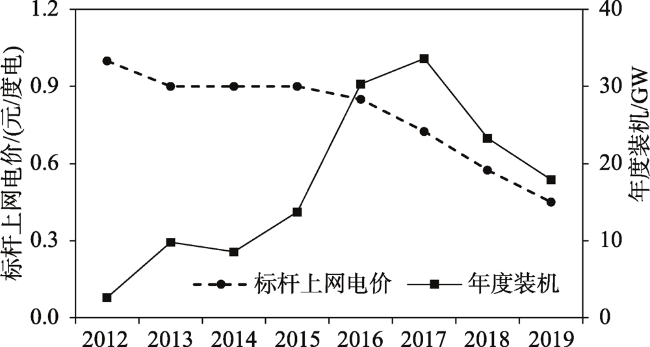
表1 中国集中式光伏电站FIT数额(单位:元/kWh)Table 1 Feed-in tariff (FIT) levels for utility-scale photovoltaic (PV) projects in China (Unit: yuan/kWh) |
| 资源区划分 | 资源区 | 2012.1— 2013.12 | 2014.1— 2016.6 | 2016.7— 2017.6 | 2017.7— 2018.6 | 2018.7—2019.6 |
|---|---|---|---|---|---|---|
| I | 宁夏,青海海西,甘肃嘉峪关、武威、张掖、酒泉、敦煌、金昌,新疆哈密、塔城、阿勒泰、克拉玛依,内蒙古除赤峰、通辽、兴安盟、呼伦贝尔以外地区 | 1.00 | 0.90 | 0.80 | 0.65 | 0.50 |
| II | 北京,天津,黑龙江,吉林,辽宁,四川,云南,内蒙古赤峰、通辽、兴安盟、呼伦贝尔,河北承德、张家口、唐山、秦皇岛,山西大同、朔州、忻州,陕西榆林、延安,青海、甘肃、新疆除I类外其他地区 | 1.00 | 0.95 | 0.88 | 0.75 | 0.60 |
| III | 除I类、II类资源区以外的其他地区(该政策未包含西藏、香港、澳门、台湾) | 1.00 | 1.00 | 0.98 | 0.85 | 0.70 |
注:表格内数值为各资源区每一时间段内维持不变的光伏电站标杆上网电价。数据来源:国家能源局。 |
表2 跨资源区省份在两资源区中的土地面积比重Table 2 Land area ratio of two types of cities in the seven northern provinces |
| 资源区 | 甘肃 | 新疆 | 青海 | 内蒙古 | 河北 | 山西 | 陕西 |
|---|---|---|---|---|---|---|---|
| Ⅰ | 0.639 | 0.195 | 0.459 | 0.605 | |||
| Ⅱ | 0.361 | 0.805 | 0.541 | 0.395 | 0.530 | 0.297 | 0.390 |
| Ⅲ | 0.470 | 0.703 | 0.610 |
数据来源:各省人民政府官网。 |
表3 变量操作化Table 3 Operationalization of key variables |
| 变量 | 描述 | 数据来源 | 预期符号 |
|---|---|---|---|
| Capacity | 每个省每半年度的新增光伏装机/万kW | 国家能源局 | / |
| FIT | 标杆上网电价/(元/kWh) | 发改委 | + |
| LCOE | 平准化成本,根据2018年美元兑人民币汇率,将单位换算为元/kWh | IEA | - |
| CF | 容量因子,用以衡量全年发电量的大小 | 文献[26] | / |
| Res | 潜在日照资源/万kW | 文献[26] | + |
| Coal_lag | 滞后一期的人均煤炭消费量/(万t标准煤/万人) | 国家统计局 | + |
| Elec_lag | 滞后一期的人均电力消费量/(亿kWh/万人) | 国家统计局 | + |
| GDP_lag | 滞后一期的人均GDP/(万元/人) | 国家统计局 | - |
| Scale | 年初和年中调整的光伏发展指标/万kW | 国家能源局 | - |
| Carbon | 碳交易市场(试点所在省份为1,否则为0) | 碳排放交易网http://tanpaifang.com/ | +/- |
| FisHe | 地方政府当年财政收入与财政支出之比 | 国家统计局 | +/- |
表4 描述性统计Table 4 Descriptive statistics |
| 变量 | 观测值 | 均值 | 标准差 | 最小值 | 最大值 |
|---|---|---|---|---|---|
| Capacity | 420 | 31.060 | 46.219 | 0.000 | 353.000 |
| FIT | 420 | 0.901 | 0.130 | 0.500 | 1.000 |
| LCOE | 420 | 0.705 | 0.273 | 0.211 | 1.264 |
| CF | 420 | 0.189 | 0.022 | 0.151 | 0.260 |
| LCOE_v2 | 420 | 0.705 | 0.284 | 0.151 | 1.557 |
| Res | 420 | 732.112 | 1766.914 | 0.850 | 7498.000 |
| Coal_lag | 420 | 3.786 | 3.351 | 0.236 | 16.772 |
| Elec_lag | 420 | 0.474 | 0.273 | 0.186 | 1.548 |
| GDP_lag | 420 | 2.624 | 1.235 | 0.801 | 7.183 |
| Scale | 420 | 410.690 | 474.114 | 1.000 | 999.000 |
| Carbon | 420 | 0.155 | 0.362 | 0.000 | 1.000 |
| FisHe | 420 | 0.507 | 0.186 | 0.156 | 0.931 |
表5 基准回归结果Table 5 Baseline regression results |
| RE (1) | RE (2) | RE (3) | |
|---|---|---|---|
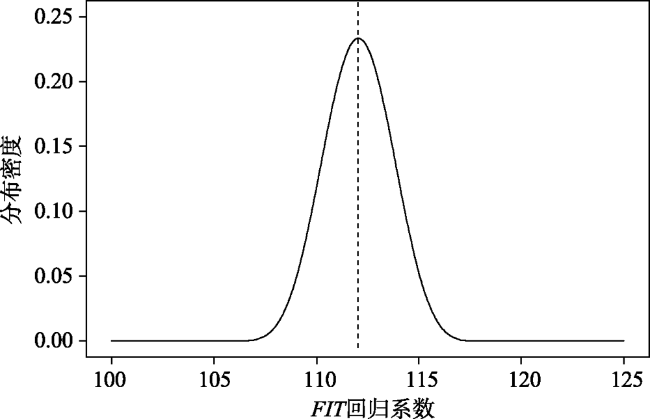
| FIT | 112.120*** | 148.756*** | |
| (27.991) | (47.089) | ||
| LCOE | -70.336*** | ||
| (15.479) | |||
| LCOE_v2 | -42.254 | ||
| (40.628) | |||
| FIT_v2 | 91.534*** | ||
| (30.082) | |||
| Res | 0.004 | 0.006 | 0.005 |
| (0.004) | (0.005) | (0.005) | |
| Coal_lag | 0.720 | 0.659 | 0.886 |
| (1.958) | (2.133) | (2.070) | |
| Elec_lag | 33.075* | 44.616* | 34.005 |
| (19.713) | (24.052) | (22.045) | |
| GDP_lag | -0.146 | -10.727** | -11.136** |
| (3.987) | (4.781) | (4.743) | |
| Scale | -0.0002 | -0.019** | -0.020** |
| (0.006) | (0.009) | (0.009) | |
| Carbon | -14.169** | -1.327 | -1.818 |
| (6.386) | (6.704) | (6.712) | |
| FisHe | -34.754 | 34.594 | 51.012* |
| (26.254) | (29.576) | (28.921) | |
| 省级固定效应 | 是 | 是 | 是 |
| 时间固定效应 | 否 | 是 | 是 |
| F统计量 | 68.132 | 158.057 | 159.457 |
| 样本量 | 420 | 420 | 420 |
| R2 | 0.157 | 0.258 | 0.255 |
| 豪斯曼检验 | 13.445(不显著) | 4.757(不显著) | 5.896(不显著) |
注:不带括号的数值为回归系数的数值,带括号的数值为回归系数的聚类稳健标准误。*表示p<0.1,**表示p<0.05,***表示p<0.01。下同。 |
表6 去掉跨资源区省份的回归结果Table 6 Regression results excluding the seven northern provinces |
| FE (1) | RE (2) | RE (3) | |
|---|---|---|---|
| FIT | 91.790*** | 83.447* | |
| (26.116) | (43.565) | ||
| LCOE | -47.975** | ||
| (19.260) | |||
| LCOE_v2 | -36.317 | ||
| (39.364) | |||
| FIT_v2 | 59.915* | ||
| (31.935) | |||
| Res | -0.034* | -0.040** | |
| (0.020) | (0.019) | ||
| 省级固定效应 | 是 | 是 | 是 |
| 时间固定效应 | 否 | 是 | 是 |
| F统计量 | 67.463 | 153.46 | 154.656 |
| 样本量 | 322 | 322 | 322 |
| R2 | 0.151 | 0.357 | 0.357 |
| 豪斯曼检验 | 19.029(显著) | 5.485(不显著) | 6.472(不显著) |
表7 分资源区回归结果Table 7 Regression results by resource zone |
| Ⅰ&Ⅱ类 | Ⅲ类 | ||
|---|---|---|---|
| RE (1) | FE (2) | ||
| FIT | 118.299** | 98.314** | |
| (48.878) | (40.256) | ||
| LCOE | -67.760** | -63.974*** | |
| (30.389) | (24.243) | ||
| Res | 0.006 | ||
| (0.004) | |||
| Coal_lag | -1.439 | 13.186 | |
| (2.138) | (11.746) | ||
| Elec_lag | 47.118** | -45.620 | |
| (19.758) | (157.326) | ||
| GDP_lag | -8.951 | 4.899 | |
| (5.838) | (6.548) | ||
| Scale | 0.005 | -0.00005 | |
| (0.011) | (0.008) | ||
| Carbon | -0.470 | -10.609 | |
| (14.176) | (9.415) | ||
| FisHe | -12.692 | -272.913*** | |
| (36.531) | (88.785) | ||
| F统计量 | 47.241 | 61.068 | |
| 样本量 | 182 | 238 | |
| R2 | 0.204 | 0.210 | |
| 豪斯曼检验 | 7.95(不显著) | 16.38*(显著) |
表8 2019年上半年主要省份FIT调整的影响估计Table 8 Estimated impact of feed-in tariff (FIT) adjustments in major provinces: First half year of 2019 |
| 省份 | 半年弃光量/亿kWh | 消除弃光的FIT降低值/(元/kWh) | 新增装机减少量/万kW | 补贴缺口的变化/亿元 |
|---|---|---|---|---|
| 新疆 | 7.7 | 0.94 | 105.58 | -1.52 |
| 甘肃 | 4.3 | 0.54 | 60.74 | -0.51 |
| 青海 | 5.2 | 0.59 | 65.89 | -2.07 |
| 陕西 | 1.9 | 0.25 | 28.15 | -1.17 |
| 宁夏 | 1.9 | 0.24 | 26.96 | -0.07 |
| 河北 | 1.6 | 0.19 | 21.72 | -0.75 |
| 内蒙古 | 0.6 | 0.06 | 7.24 | -0.34 |
| 吉林 | 0.4 | 0.05 | 5.31 | -0.03 |
| 山西 | 0.1 | 0.01 | 1.36 | -0.13 |
| 小计 | 23.7 | 322.94 | -6.58 |
| [1] |
陈婕, 邓学平. 可再生能源投资与绿色经济发展的实证分析[J]. 华东经济管理, 2020, 34(11):100-106.
[
|
| [2] |
牟初夫, 王礼茂, 屈秋实, 等. 主要新能源发电替代减排的研究综述[J]. 资源科学, 2017, 39(12):2323-2334.
[
|
| [3] |
徐乐, 赵领娣. 重点产业政策的新能源技术创新效应研究[J]. 资源科学, 2019, 41(1):113-131.
[
|
| [4] |
胡宗义, 邱先翼, 李毅. 政府补助对可再生能源投资的门槛效应研究[J]. 财经理论与实践, 2020, 41(5):61-69.
[
|
| [5] |
涂强, 莫建雷, 范英. 中国可再生能源政策演化、效果评估与未来展望[J]. 中国人口·资源与环境, 2020, 30(3):29-36.
[
|
| [6] |
王风云. 我国可再生能源电价补贴及优化研究[J]. 学习与探索, 2020, (3):95-102.
[
|
| [7] |
张丽虹, 何凌云, 钟章奇. 可再生能源投资及其影响因素: 一个理论分析框架[J]. 西安财经学院学报, 2019, 32(6):66-73.
[
|
| [8] |
|
| [9] |
|
| [10] |
|
| [11] |
|
| [12] |
赵彦云, 李倩. 风电上网电价政策地区差异及其产业效应[J]. 资源科学, 2021, 43(1):12-22.
[
|
| [13] |
|
| [14] |
|
| [15] |
|
| [16] |
|
| [17] |
贾亚雷, 石建国, 庞永超, 等. 基于省级截面数据的分布式光伏发电补贴政策实证分析[J]. 可再生能源, 2016, 34(10):1435-1440.
[
|
| [18] |
|
| [19] |
北京大学国家发展研究院能源安全与国家发展研究中心, 中国人民大学经济学院能源经济系联合课题组. 关于中国风电和光伏发电补贴缺口和大比例弃电问题的研究[J]. 国际经济评论, 2018, (4):67-85.
[Joint research Group, Department of Energy Economics, School of Economics, Renmin University of China, National Research Center for Energy Security and Development, Peking University. Subsidy crisis and large-scale curtailment of wind and solar power in China[J]. International Economic Review, 2018, (4):67-85.]
|
| [20] |
|
| [21] |
黄珺仪. 补贴政策对风电产业发展影响的实证分析[J]. 生态经济, 2018, 34(5):115-120.
[
|
| [22] |
|
| [23] |
|
| [24] |
|
| [25] |
陈枫楠, 王礼茂. 中国太阳能光伏产业空间格局及影响因素分析[J]. 资源科学, 2012, 34(2):287-294.
[
|
| [26] |
|
| [27] |
周泽人, 舒印彪, 董存, 等. 基于混合威布尔分布的风能资源分布统计分析研究[J]. 数理统计与管理, 2020, 39(4):584-594.
[
|
| [28] |
|
| [29] |
|
| [30] |
|
| [31] |
|
| [32] |
|
| [33] |
任晓松, 马茜, 刘宇佳, 等. 碳交易政策对高污染工业企业经济绩效的影响: 基于多重中介效应模型的实证分析[J]. 资源科学, 2020, 42(9):1750-1763.
[
|
| [34] |
王丽颖. 中国碳交易试点政策的减排效果分析[J]. 社会科学战线, 2021, (4):251-255.
[
|
| [35] |
张宁, 刘青君. 碳交易减少了中国火电厂的减排成本吗? 基于2005-2010年面板数据的实证分析[J]. 北京理工大学学报(社会科学版), 2019, 21(1):7-16.
[
|
| [36] |
薛飞, 周民良. 中国碳交易市场规模的减排效应研究[J]. 华东经济管理, 2021, 35(6):11-21.
[
|
| [37] |
朱凡, 李天琦. 中国碳交易市场减排绩效的实证研究[J]. 税务与经济, 2021, (3):54-62.
[
|
| [38] |
李成威, 杜崇珊. 公共风险、公共债务与财政健康度[J]. 现代经济探讨, 2021, (3):43-49.
[
|
/
| 〈 |
|
〉 |