
Effect of educational resource difference on housing price in Jiang’an District, Wuhan City
Received date: 2020-04-21
Request revised date: 2020-07-16
Online published: 2021-06-25
Copyright
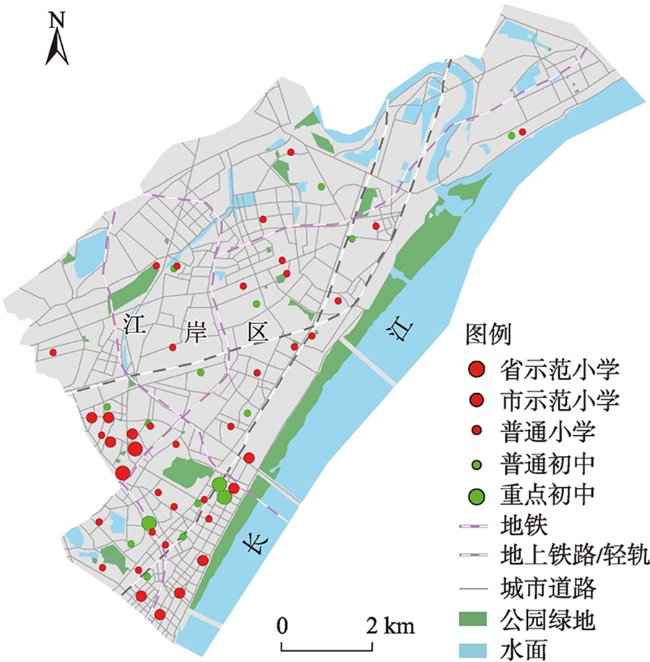
It is of great significance to explore the capitalization effect of educational resource difference on housing price to balance the development of high-quality educational resources and maintain the stability of real estate market. Taking Jiang’an District of Wuhan City as an example and based on the housing transaction data of the research area from June 2016 to May 2018, this study constructed a Hedonic price model from the areas, history, location, neighborhood, school-accessibility, and other aspects of housing to explore the capitalization effect of high-quality educational resources on housing price. Two dummy variables of policy announcement period (T1) and policy implementation period (T2) and the interaction between quality of primary and secondary schools and time were introduced to study the influence of school district system policy on school district housing price before and after its implementation. The research found that: (1) School quality has a positive effect on school district housing price, and the effect of the quality of middle school is more obvious than that of primary school. Specifically, one-level increase in primary school quality leads to an average 11.7% increase in housing prices; An increase in the quality of secondary schools by one level would increase housing prices by an average of 27.6%. (2) In phase T1, the influence coefficient S1T1 and S2T1 on the housing prices of primary school district and middle school district were 0.049 and 0.074 respectively. In the T2 period, the influence coefficient S1T2 and S2T2 on the housing prices of primary school district and middle school district were 0.060 and 0.089 respectively. The implementation of the school district system policy in the research period has a positive effect on the capitalization of the school district housing, and the impact on balancing the development of high-quality educational resources has not yet been shown due to the impact of the implementation of relevant housing and enrollment policies and residents’ habitual thinking.
YANG Shengfu , ZHANG Peng , ZOU Qiuli . Effect of educational resource difference on housing price in Jiang’an District, Wuhan City[J]. Resources Science, 2021 , 43(4) : 790 -798 . DOI: 10.18402/resci.2021.04.13
表1 特征变量及其描述性统计Table 1 Impact factors and their descriptive statistics |
| 特征类别 | 变量 | 定义变量及量化 | 预期符号 | 极小值 | 极大值 | 均值 | 标准差 |
|---|---|---|---|---|---|---|---|
| 因变量 | 房价(P) | 指二手房交易价格/(元/ m2) | 7000.00 | 62643.37 | 18770.64 | 6267.88 | |
| 建筑特征 | 建筑面积(Ar) | 指住房的建筑面积/m2 | + | 11.50 | 264.49 | 92.57 | 36.61 |
| 房龄(Ag) | 指住房的房龄/年 | - | 0.00 | 32.00 | 10.43 | 6.09 | |
| 邻里特征 | 物业费(F) | 指小区的物业费/(元/月·m2) | + | 0.20 | 4.80 | 1.48 | 0.77 |
| 容积率(R1) | 指小区总建筑面积与用地面积的比值 | - | 0.12 | 13.60 | 3.31 | 1.90 | |
| 绿化率(R2) | 指小区的绿化率水平/% | + | 8.10 | 55.00 | 34.50 | 7.30 | |
| 公园绿地(G) | 小区1 km内有公园绿地记1,无记0 | + | 0.00 | 1.00 | 0.83 | 0.38 | |
| 商店超市(M) | 小区1 km内有商店超市记1,无记0 | + | 1.00 | 1.00 | 1.00 | 0.00 | |
| 区位特征 | 到江汉路商圈的距离(D1) | 指从小区中心到江岸区CBD的直线距离/km | - | 0.20 | 11.10 | 5.51 | 2.75 |
| 到最近地铁站的距离(D2) | 指从小区中心到最近地铁站的直线距离/km | - | 0.07 | 1.31 | 0.58 | 0.25 | |
| 到对口小学的距离(D3) | 指从小区中心到对口小学的直线距离/km | - | 0.04 | 2.24 | 0.62 | 0.46 | |
| 到对口初中的距离(D4) | 指从小区中心到对口中学的直线距离/km | - | 0.06 | 6.76 | 1.24 | 1.45 | |
| 学区特征 | 小学质量(S1) | 省级示范小学记3,市级示范小学记2,普通小学记1 | + | 1.00 | 3.00 | 1.22 | 0.51 |
| 初中质量(S2) | 重点初中记2,普通初中记1 | + | 1.00 | 2.00 | 1.08 | 0.27 |
表2 模型1回归结果Table 2 Regression results of model 1 |
| 变量 | 标准系数 | 标准误差 | t | 共线性统计 | |
|---|---|---|---|---|---|
| 容差 | VIF | ||||
| lnAg | -0.066** | 0.029 | -2.293 | 0.373 | 2.679 |
| lnF | 0.358*** | 0.028 | 12.765 | 0.388 | 2.578 |
| lnR2 | 0.114*** | 0.020 | 5.735 | 0.767 | 1.304 |
| G | 0.108*** | 0.019 | 5.629 | 0.834 | 1.199 |
| lnD1 | -0.145*** | 0.024 | -6.128 | 0.542 | 1.844 |
| lnD2 | -0.091*** | 0.018 | -4.96 | 0.909 | 1.100 |
| lnD4 | -0.104*** | 0.022 | -4.815 | 0.659 | 1.518 |
| S1 | 0.111*** | 0.022 | 5.032 | 0.625 | 1.599 |
| S2 | 0.244*** | 0.021 | 11.533 | 0.682 | 1.466 |
| R2 | 0.378 | ||||
| 调整R2 | 0.375 | ||||
注:***、**和*分别表示在1%、5%和10%显著性水平上显著。 |
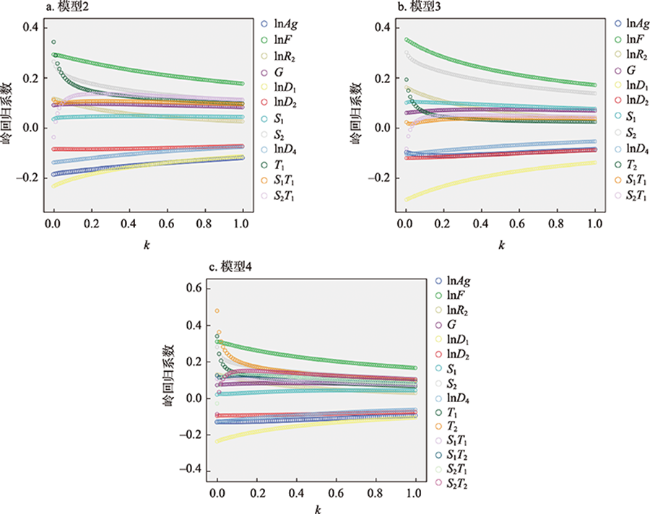
表3 岭回归结果Table 3 Estimated coefficients of ridge regression |
| 模型 | 模型2 | 模型3 | 模型4 |
|---|---|---|---|
| (常量) | 9.586*** | 9.755*** | 9.591*** |
| lnAg | -0.082*** | -0.039** | -0.053*** |
| lnF | 0.154*** | 0.118*** | 0.139*** |
| lnR2 | 0.092*** | 0.088*** | 0.098*** |
| G | 0.085*** | 0.057** | 0.071*** |
| lnD1 | -0.091** | -0.088*** | -0.081*** |
| lnD2 | -0.055** | -0.061*** | -0.056*** |
| S1 | 0.031*** | 0.051** | 0.024*** |
| S2 | 0.211*** | 0.206*** | 0.189*** |
| lnD4 | -0.042*** | -0.024*** | -0.035*** |
| T1 | 0.096** | - | 0.072*** |
| T2 | - | 0.019*** | 0.107*** |
| S1T1 | 0.050*** | - | 0.049** |
| S1T2 | - | 0.016*** | 0.060*** |
| S2T1 | -0.080*** | - | 0.074*** |
| S2T2 | - | 0.026*** | 0.089*** |
表4 不同时期内小学质量和初中质量的估计系数Table 4 Estimated coefficients of primary and secondary school quality in different periods |
| T0 | T1 | T2 | |
|---|---|---|---|
| S1 | 0.024 | 0.073(0.024+0.049) | 0.084(0.024+0.060) |
| S2 | 0.189 | 0.263(0.189+0.074) | 0.278(0.189+0.089) |
| [1] |
刘延东. 深入学习贯彻党的十九大精神全面开创教育改革发展新局面[J]. 求是, 2018, ( 6):14-20.
[
|
| [2] |
孙伟增, 林嘉瑜. 教育资源供给能够降低学区房溢价吗? 来自北京市新建小学的证据[J]. 经济学(季刊), 2020,19(2):499-520.
[
|
| [3] |
哈巍, 余韧哲. 学校改革价值几何? 基于北京市义务教育综合改革的“学区房”溢价估计[J]. 北京大学教育评论, 2017,15(3):137-153.
[
|
| [4] |
尹上岗, 胡信, 马志飞, 等. 基于教育公平视角的城市学区房价格时空效应: 以南京主城区公办小学为例[J]. 经济地理, 2019,39(9):82-93.
[
|
| [5] |
涂唐奇, 闫东升, 陈江龙, 等. 南京城市义务教育设施空间演化[J]. 地理科学, 2019,39(3):433-441.
[
|
| [6] |
戴特奇, 廖聪, 胡科, 等. 公平导向的学校分配空间优化: 以北京石景山区为例[J]. 地理学报, 2017,72(8):1476-1485.
[
|
| [7] |
|
| [8] |
戴特奇, 赵韶雅, 廖聪. 概率分布相似最大化的“就近-随机”入学机会公平优化: 以北京市西城区为例[J]. 经济地理, 2019,39(11):18-24.
[
|
| [9] |
|
| [10] |
戴其文, 姚意旗, 张晓奇, 等. 环境对城市房价影响研究述评与展望[J]. 资源科学, 2019,41(4):627-642.
[
|
| [11] |
梁立雨, 郭志强, 李军祥, 等. 中学学区对周边小区二手房房价的溢价分析: 以深圳市为例[J]. 北京大学学报(自然科学版), 2019,55(3):537-542.
[
|
| [12] |
|
| [13] |
温海珍, 贾生华. 住宅的特征与特征的价格: 基于特征价格模型的分析[J]. 浙江大学学报(工学版), 2004,38(10):1338-1342.
[
|
| [14] |
|
| [15] |
|
| [16] |
杨剩富, 胡守庚, 徐枫, 等. 特殊自然地物对城市住宅地价和房价的影响: 以武汉市为例[J]. 资源科学, 2016,38(4):738-749.
[
|
| [17] |
|
| [18] |
刘润秋, 孙潇雅. 教育质量“资本化”对住房价格的影响: 基于成都市武侯区小学学区房的实证分析[J]. 财经科学, 2015, ( 8):91-99.
[
|
| [19] |
石忆邵, 王伊婷. 上海市学区房价格的影响机制[J]. 中国土地科学, 2014,28(12):47-55.
[
|
| [20] |
胡婉旸, 郑思齐, 王锐. 学区房的溢价究竟有多大: 利用“租买不同权”和配对回归的实证估计[J]. 经济学(季刊), 2014,13(3):1195-1214.
[
|
| [21] |
张骥. 学区房溢价的再估计: 以北京市为例[J]. 经济问题探索, 2017, ( 8):57-63.
[
|
| [22] |
|
| [23] |
王永超, 王光宇, 董丽晶. 教育资本化背景下学区房溢价水平和价格空间集聚特征研究: 以沈阳市中心城区为例[J]. 人口与发展, 2020,26(1):108-117.
[
|
| [24] |
|
| [26] |
|
| [27] |
王望珍, 杨笑然. 租售同权对武汉学区房价格的影响[J]. 武汉理工大学学报(信息与管理工程版), 2019,41(4):422-426.
[
|
| [28] |
宋伟轩, 涂唐奇, 尹上岗, 等. 南京义务教育资源的社会-空间可达性差异及效应研究[J]. 地理研究, 2019,38(8):2008-2026.
[
|
| [29] |
李瑶瑶, 朱道林, 赵江萌, 等. 政府短期干预行为对住宅地价周期波动的影响[J]. 资源科学, 2019,41(6):1059-1069.
[
|
| [30] |
许浩, 周子康, 孔德莉, 等. 武汉市基础教育资源与居民点空间耦合分析[J]. 经济地理, 2019,39(8):87-94.
[
|
/
| 〈 |
|
〉 |