
Aged city built environment friendliness:Taking Taipei and New Taipei Cities as examples
Received date: 2019-09-11
Request revised date: 2020-01-23
Online published: 2021-02-25
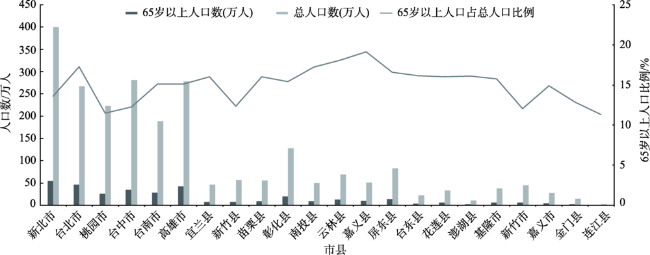
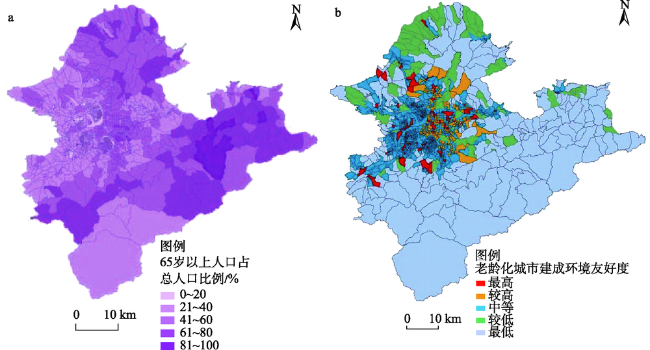
In today’s society, the elderly population and aged cities have become a worldwide concern. By sorting out the theoretical research and practical focus of elderly friendly city in recent years, and the definition and evaluation index and methods of the built environment friendliness of elderly friendly cities, this article described the concept and definition of the built environment friendliness of aged city, summarized the evaluation index of the built environment friendliness of aged city, and proposed a multi-factor quantitative evaluation method of built environment friendliness of aged cities based on actual data, and guided by the characteristics of the elderly population distribution. Taking two aged cities of Taiwan Province — Taipei and New Taipei Cities as examples, this study evaluated their built environment friendliness. The evaluation results show that the “highest” and “high” built environment friendly administrative streets account for about 18% of the total, and they are mainly concentrated in Taipei’s urban area and parts of New Taipei’s urban area; the “moderate” administrative streets account for about 64%, and are mainly concentrated in New Taipei’s urban area, parts of Taipei’s urban area, and suburban areas of Taipei and New Taipei Cities; the “lowest” and “low” administrative streets account for about 18%, and are mainly concentrated in north and south city periphery of New Taipei City. The aging degree of each grade of built environment friendliness in Taipei and New Taipei Cities was compared with the average values of other evaluation indicators, so as to put forward effective policy recommendations. Generally, the quantitative evaluation method is helpful for improving the overall planning strategy of the built environment of aged cities, and can provide some reference for similar aging cities.
YANG Ling , CHANG Hsiao-Tung . Aged city built environment friendliness:Taking Taipei and New Taipei Cities as examples[J]. Resources Science, 2020 , 42(12) : 2406 -2418 . DOI: 10.18402/resci.2020.12.12
表1 老龄化城市建成环境友好度评价指标体系Table 1 Evaluation index system of aged city built environment friendliness |
| 领域 | 指标 | 说明 | 参考文献 |
|---|---|---|---|
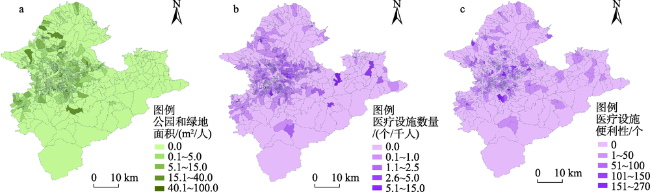
| 公共环境 | 公园和绿地面积/(m2/人) 公园和绿地适老性改造率/% | 拥有的各类公园和绿地数量 公园、绿地、滨水区、广场、步行街等公共活动空间的适老性改造比例 | [27] [28] |
| 医疗设施 | 医疗设施数量/(个/千人) 医疗设施便利性/个 | 拥有的各类医疗设施数量 医疗设施(除诊所外)周边500 m步行区域内拥有公共交通站点数量 | [27] [29] |
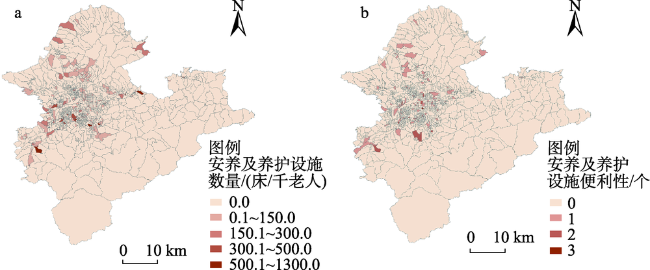
| 养老服务设施 | 安养及养护设施数量/(床/千老人) 安养及养护设施便利性/个 | 拥有的安养及照护(公/私)设施数量 从养护设施(开车5 min内)可达的医疗设施数量(除诊所外) | [15] [26] |
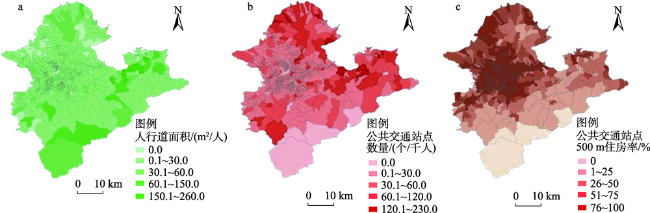
| 交通设施 | 人行道面积/(m2/人) 公共交通站点500 m居住率/% 公共交通站点数量/(个/千人) 公共交通车辆方便使用率/% | 拥有的人行道面积 步行可达公交车站/捷运站(500 m内)的居住用地面积占总用地面积的比例 拥有的公交站点/捷运站点数量 具有老年人或者残疾人专用座位的公交车/捷运(地铁)比例 | [13] [15] [30] [13] |
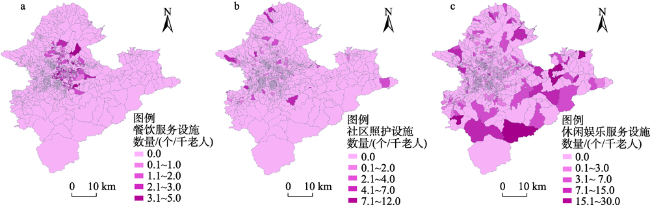
| 老年社区服务 | 餐饮服务设施数量/(个/千老人) 社区照护设施数量/(个/千老人) 休闲娱乐服务设施数量/(个/千老人) 社区及住房适老性改造率/% | 拥有的供餐、送餐、营养餐服务点数量 拥有的社区服务点(日照中心等)数量 拥有的休闲娱乐服务点(银发俱乐部等)数量 社区及住房适老性改造比例 | [26] [26] [15] [15] |
注:基于标准化统一原则,对“公园和绿地面积”等面积及数量类指标,采用人均指标进行统计(其中,按指标数据特性及使用人群是否只限老年人等特征,分为“每人”“每千人”及“每千老人”3种单位)。 |
表2 台北市与新北市老龄化城市建成环境友好度评价指标的描述性统计Table 2 Descriptive statistics of evaluation indicators of aged city built environment friendliness in Taipei and New Taipei Cities |
| 领域 | 指标 | 个数 | 最小值 | 最大值 | 平均数 | 中位数 | 方差 |
|---|---|---|---|---|---|---|---|
| 公共环境 | 公园和绿地面积/(m2/人) | 1505 | 0 | 97 | 18 | 0.3 | 4.8 |
| 公园和绿地适老性改造率/% | 1505 | — | — | — | — | — | |
| 医疗设施 | 医疗设施数量/(个/千人) | 1505 | 0 | 13 | 0.8 | 0.4 | 1.2 |
| 医疗设施便利性/个 | 1505 | 0 | 268 | 165 | 169 | 23.3 | |
| 养老服务设施 | 安养及养护设施数量/(床/千老人) | 1505 | 0 | 1210 | 14 | 0.4 | 68.6 |
| 安养及养护设施便利性/个 | 1505 | 0 | 3 | 2 | 2 | 0.3 | |
| 交通设施 | 人行道面积/(m2/人) | 1505 | 0 | 257 | 58 | 15 | 17.2 |
| 公共交通站点500 m居住率/% | 1505 | 0 | 100 | 91 | 100 | 21.4 | |
| 公共交通站点数量/(个/千人) | 1505 | 0 | 230 | 15 | 7 | 22.9 | |
| 公共交通车辆方便使用率/% | 1505 | — | — | — | — | — | |
| 老年社区服务 | 餐饮服务设施数量/(个/千老人) | 1505 | 0 | 5 | 0.3 | 0.2 | 0.6 |
| 社区照护设施数量/(个/千老人) | 1505 | 0 | 11 | 0.2 | 0.2 | 0.7 | |
| 休闲娱乐服务设施数量/(个/千老人) | 1505 | 0 | 28 | 0.8 | 0.4 | 2.1 | |
| 社区及住房适老性改造率/% | 1505 | — | — | — | — | — |
表3 台北市与新北市老龄化城市建成环境友好度各项评价指标的K-Means聚类分析-最终聚类中心Table 3 K-Means cluster analysis of evaluation indicators of aged city built environment friendliness in Taipei and New Taipei Cities — center of final clusters |
| 指标 | 集群 | ||||
|---|---|---|---|---|---|
| 1 | 2 | 3 | 4 | 5 | |
| 老龄化程度 | 0 | 0 | 0 | 1 | 0 |
| 公共交通站点数量/(个/千人) | 0 | 0 | 0 | 0 | 0 |
| 公共交通站点500 m居住率/% | 0.96 | 0.98 | 0.98 | 0.86 | 0.38 |
| 医疗设施数量/(个/千人) | 0 | 0 | 0 | 0 | 0 |
| 医疗设施便利性/个 | 0.229 | 0.047 | 0.026 | 0.026 | 0.012 |
| 人行道面积/(m2/人) | 0 | 0 | 0 | 0 | 0 |
| 公园和绿地面积/(m2/人) | 0 | 0 | 0 | 0 | 0 |
| 安养及养护设施数量/(床/千老人) | 0 | 0 | 0 | 0 | 0 |
| 安养及养护设施便利性/个 | 0.375 | 0.019 | 0.000 | 0.011 | 0.006 |
| 餐饮服务设施数量/(个/千老人) | 0 | 0 | 0 | 0 | 0 |
| 社区照护设施数量/(个/千老人) | 0 | 0 | 0 | 0 | 0 |
| 休闲娱乐服务设施数量/(个/千老人) | 0 | 0 | 0 | 0 | 0 |
注:指标值均为标准化修正值。 |
表4 台北市与新北市老龄化城市建成环境友好度不同等级的各项评价指标平均值统计Table 4 Average values of evaluation indicators for different levels of aged city built environment friendliness in Taipei and New Taipei Cities |
| 指标 | 集群 | |||||
|---|---|---|---|---|---|---|
| 第1类 | 第2类 | 第3类 | 第4类 | 第5类 | 总和 | |
| 老龄化程度 | 0.41 | 0.48 | 0.39 | 0.54 | 0.47 | 0.42 |
| 公共交通站点数量/(个/千人) | 0.06 | 0.05 | 0.03 | 0.30 | 0.14 | 0.06 |
| 公共交通站点500 m居住率/% | 0.96 | 0.98 | 0.98 | 0.86 | 0.38 | 0.90 |
| 医疗设施数量/(个/千人) | 0.13 | 0.08 | 0.06 | 0.04 | 0.02 | 0.06 |
| 医疗设施便利性/个 | 0.23 | 0.05 | 0.03 | 0.03 | 0.01 | 0.06 |
| 人行道面积/(m2/人) | 0.01 | 0.00 | 0.01 | 0.06 | 0.08 | 0.02 |
| 公园和绿地面积/(m2/人) | 0.03 | 0.02 | 0.02 | 0.02 | 0.01 | 0.02 |
| 安养及养护设施数量/(床/千老人) | 0.04 | 0.01 | 0.01 | 0.01 | 0.01 | 0.01 |
| 安养及养护设施便利性/个 | 0.38 | 0.19 | 0.00 | 0.11 | 0.01 | 0.03 |
| 餐饮服务设施数量/(个/千老人) | 0.05 | 0.35 | 0.01 | 0.00 | 0.01 | 0.05 |
| 社区照护设施数量/(个/千老人) | 0.01 | 0.01 | 0.01 | 0.04 | 0.01 | 0.01 |
| 休闲娱乐服务设施数量/(个/千老人) | 0.01 | 0.01 | 0.02 | 0.05 | 0.08 | 0.03 |
| [1] |
韩家彬, 刘淑云, 张书凤, 等. 农业劳动力老龄化对土地规模经营的影响[J]. 资源科学, 2019,41(12):2284-2295.
[
|
| [2] |
许菲, 张彩萍, 白军飞. 收入增长与老龄化对城镇居民食物消费水足迹的影响[J]. 资源科学, 2018,40(1):104-116.
[
|
| [3] |
金巍, 章恒全, 张洪波, 等. 城镇化进程中人口结构变动对用水量的影响[J]. 资源科学, 2018,40(4):784-796.
[
|
| [4] |
许昕, 赵媛, 夏四友, 等. 中国分县城乡人口老龄化时空差异与机理[J]. 经济地理, 2020,40(4):164-174.
[
|
| [5] |
邱俊杰, 任倩, 余劲. 农业劳动力老龄化、农业资本投入与土地利用效率: 基于鲁豫皖三省固定农户跟踪调查[J]. 资源科学, 2019,41(11):1982-1996.
[
|
| [6] |
吴媛媛, 宋玉祥. 中国人口老龄化空间格局演变及其驱动因素[J]. 地理科学, 2020,40(5):768-775.
[
|
| [7] |
WHO. Global Age Friendly Cities: A Guide[R]. Geneva: World Health Organization, 2007.
|
| [8] |
|
| [9] |
WHO. Declaration of Alma-Ata[R]. Geneva: World Health Organization, 1978.
|
| [10] |
WHO. Active Ageing: A Policy Framework[R]. Geneva: World Health Organization, 2002.
|
| [11] |
刘鉴, 杨青山, 张郁, 等. 东北三省县级尺度人口老龄化空间格局演变及类型划分[J]. 地理科学, 2020,40(6):918-927.
[
|
| [12] |
周榕, 庄汝龙, 黄晨熹. 中国人口老龄化格局演变与形成机制[J]. 地理学报, 2019,74(10):2163-2177.
[
|
| [13] |
WHO. Measuring the Age-Friendliness of Cities: A Guide to Using Core Indicators[R]. Kobe: World Health Organization, 2015.
|
| [14] |
|
| [15] |
|
| [16] |
胡淑贞, 林宛仪, 黄咏柔, 等. 台湾“高龄友善环境-乡镇市区层级区位数据库”之建置介绍[J]. 健康科技, 2018, (S1):71-79.
[
|
| [17] |
|
| [18] |
|
| [19] |
|
| [20] |
|
| [21] |
|
| [22] |
|
| [23] |
|
| [24] |
|
| [25] |
|
| [26] |
谢楠. 台湾年龄友好城市建设经验及主要特色: 以台湾嘉义市为例[J]. 老龄科学研究, 2017,5(10):24-32.
[
|
| [27] |
胡庭浩, 沈山, 刘雅萍. 老年友好型城市建设评价体系探析[J]. 江苏城市规划, 2014, (12):10-13.
[
|
| [28] |
|
| [29] |
张建军, 高峰, 金锋淑, 等. 基于操作性原则的沈阳养老设施规划模式探索[J]. 城市规划, 2016,40(1):34-42.
[
|
| [30] |
|
| [31] |
赵东霞, 韩增林, 任启龙, 等. 市域人口老龄化空间特征与养老资源匹配关系研究: 以东北三省为例[J]. 资源科学, 2018,40(9):1773-1786.
[
|
/
| 〈 |
|
〉 |