
Effect of government financial support on the development of China’s rare earth industry and influencing factors
Received date: 2020-02-19
Request revised date: 2020-06-12
Online published: 2020-10-25
Research on the effect of government financial support on the development of the rare earth industry in China is of great value for improving the theories of policy study of the rare earth industry, optimizing the policy system of government financial support, and realizing the sustainable development of the industry. Taking listed rare earth companies in China as examples, this study constructed an efficiency evaluation model of government financial support based on slacks-based measure data envelopment analysis (SBM-DEA) and an influencing factor model based on panel feasible generalized least squares (FGLS) estimation method, calculated and analyzed the efficiency and influencing factors of government financial support for China’s rare earth industry from 2010 to 2019, and distinguished between the front-end and the back-end of the rare earth industrial chain to compare and analyze the difference of government financial support effects. The results show that: The annual average value of government financial support efficiency of China’s rare earth industry is 1.313. Government financial support has an “incentive effect” on 65% of the listed rare earth companies, which has achieved the overall goal of government financial support policy. But it still has an “exclusion effect” on 35% of the listed rare earth companies. The annual average values of government financial support efficiency of the front-end and the back-end of the rare earth industrial chain are 1.145 and 1.377, respectively, which means that the “incentive effect” of government financial support on the back-end of the inductrial chain is significantly greater than that on the front-end. Government financial support is conducive to promoting the extension of the rare earth industrial chain to the back end. With the passage of time, the government financial support efficiency of the rare earth industry as a whole shows a downward trend, and the “incentive effect” gradually turns into the “exclusion effect”. The introduction of special policies can improve the efficiency of government financial support in the short term, but the long-term effect is limited. There is an inverted U-shaped relationship between government financial support intensity and government financial support efficiency of the rare earth industry, and at the enterprise scale, a significant positive effect on the government financial support efficiency of the rare earth industry can be observed. This study may deepen the understanding of the effect of government financial support on the development of China’s rare earth industry and provide a reference for the formulation of differentiated government financial support policies for China’s rare earth industry.
DONG Juan , ZHENG Minggui , ZHONG Changbiao . Effect of government financial support on the development of China’s rare earth industry and influencing factors[J]. Resources Science, 2020 , 42(8) : 1551 -1565 . DOI: 10.18402/resci.2020.08.10
(j≠d)
表1 变量类型、符号及度量汇总表Table 1 Variables and their measurements |
| 变量类型 | 变量符号 | 变量度量 | 单位 |
|---|---|---|---|
| 投入变量 | x1 | 固定资产净值 | 亿元 |
| x2 | 主营业务成本 | 亿元 | |
| x3 | 员工总人数 | 人 | |
| x4 | 研发支出总额 | 亿元 | |
| 产出变量 | y | 营业收入 | 亿元 |
| 环境变量 | W | 计入当期损益的政府补助 | 亿元 |
| 影响因素 | Sub | 政府补助/营业收入 | % |
| Size | 资产总额的自然对数 | — | |
| 控制变量 | Roe | 净资产收益率 | % |
| Fsr | 第一控股股东持股比例 | % | |
| Lev | 负债总额/资产总额 | % | |
| Own | 当企业控股股东为国家或地方政府时取值为1;否则取值为0 | — | |
| Age | 计算年-成立年,并取自然对数 | — | |
| Year | 年度虚拟变量。共有10个年度,设置9个虚拟变量。 | — |
表2 投入变量、产出变量与环境变量描述性统计Table 2 Descriptive statistics of input, output and environment variables |
| 编号 | 单位 | 平均值 | 标准差 | 极小值 | 极大值 |
|---|---|---|---|---|---|
| x1 | 亿元 | 13.921 | 17.320 | 0.427 | 91.276 |
| x2 | 亿元 | 32.000 | 40.302 | 1.875 | 183.987 |
| x3 | 人 | 4691 | 7406 | 263 | 71244 |
| x4 | 亿元 | 0.998 | 1.619 | 0.001 | 11.397 |
| y | 亿元 | 40.489 | 47.480 | 2.522 | 239.158 |
| W | 亿元 | 0.339 | 0.478 | 0.000 | 2.949 |
数据来源:巨潮资讯网2010—2019年各稀土上市公司的年报资料。 |
表3 2010—2019年中国稀土上市公司财政支持效率Table 3 Government financial support efficiency of listed rare earth companies in China, 2010-2019 |
| 企业 | 2010 | 2011 | 2012 | 2013 | 2014 | 2015 | 2016 | 2017 | 2018 | 2019 | 多年均值 | |
|---|---|---|---|---|---|---|---|---|---|---|---|---|
| 前端 | 北方稀土 | 1.073 | 1.000 | 0.879 | 0.713 | 0.878 | 0.816 | 0.743 | 0.721 | 0.830 | 0.839 | 0.849 |
| 广晟有色 | 1.712 | 1.606 | 1.740 | 1.560 | 0.840 | 1.012 | 0.879 | 1.094 | 0.884 | 1.000 | 1.233 | |
| 厦门钨业 | 0.830 | 0.913 | 0.807 | 0.738 | 0.658 | 0.693 | 0.671 | 0.771 | 1.000 | 0.511 | 0.759 | |
| 中色股份 | 1.980 | 1.494 | 1.048 | 1.204 | 1.204 | 1.212 | 1.000 | 1.244 | 1.235 | 1.120 | 1.274 | |
| 五矿稀土 | 1.034 | 1.144 | 1.199 | 1.000 | 2.266 | 1.164 | 1.383 | 1.320 | 1.314 | |||
| 盛和资源 | 2.874 | 2.137 | 1.689 | 1.511 | 1.035 | 0.806 | 0.830 | 0.841 | 1.465 | |||
| 后端 | 中科三环 | 1.164 | 0.976 | 0.924 | 0.936 | 0.881 | 0.916 | 0.920 | 0.885 | 0.841 | 0.796 | 0.924 |
| 中钢天源 | 2.202 | 1.749 | 2.036 | 1.413 | 1.552 | 1.311 | 2.092 | 1.080 | 0.939 | 0.817 | 1.519 | |
| 银河磁体 | 3.410 | 2.236 | 2.161 | 2.589 | 2.132 | 2.600 | 2.566 | 2.244 | 2.396 | 2.030 | 2.436 | |
| 宁波韵升 | 1.273 | 1.060 | 1.069 | 1.151 | 1.267 | 1.238 | 1.035 | 1.061 | 1.080 | 1.058 | 1.129 | |
| 英洛华 | 1.973 | 1.554 | 1.259 | 1.253 | 1.696 | 1.425 | 1.175 | 1.189 | 1.033 | 0.982 | 1.354 | |
| 有研新材 | 1.954 | 1.444 | 1.731 | 1.000 | 0.652 | 1.022 | 1.000 | 0.949 | 1.087 | 1.000 | 1.184 | |
| 正海磁材 | 1.505 | 0.984 | 1.285 | 1.663 | 1.458 | 1.126 | 1.010 | 1.279 | 1.076 | 1.041 | 1.243 | |
| 科恒股份 | 2.907 | 1.389 | 1.920 | 3.014 | 2.705 | 2.333 | 1.313 | 0.968 | 0.826 | 0.870 | 1.824 | |
| 北矿科技 | 5.291 | 2.783 | 2.910 | 6.757 | 1.000 | 1.989 | 1.635 | 1.171 | 1.137 | 0.875 | 2.555 | |
| 领益智造 | 2.418 | 1.987 | 1.599 | 1.442 | 1.206 | 0.938 | 1.077 | 0.930 | 1.056 | 1.000 | 1.365 | |
| 横店东磁 | 1.213 | 0.874 | 0.891 | 0.859 | 0.882 | 0.904 | 0.892 | 0.848 | 0.825 | 0.709 | 0.890 | |
| 安泰科技 | 0.786 | 0.706 | 0.667 | 0.807 | 0.795 | 0.839 | 0.807 | 0.752 | 0.715 | 0.735 | 0.761 | |
| 科力远 | 1.202 | 0.910 | 1.189 | 1.257 | 1.147 | 0.581 | 0.983 | 0.260 | 0.867 | 0.879 | 0.927 | |
| 鸿达兴业 | 1.150 | 1.030 | 1.496 | 0.747 | 0.702 | 0.702 | 0.734 | 0.937 | ||||
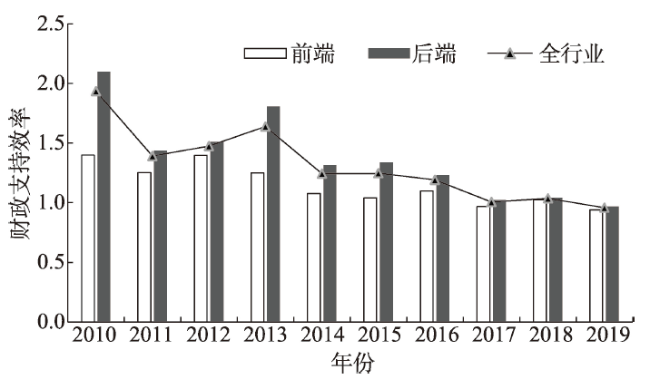
| 均值 | 全行业 | 1.935 | 1.392 | 1.475 | 1.639 | 1.244 | 1.248 | 1.192 | 1.006 | 1.037 | 0.958 | 1.313 |
| 前端 | 1.399 | 1.254 | 1.397 | 1.250 | 1.078 | 1.041 | 1.099 | 0.967 | 1.027 | 0.939 | 1.145 | |
| 后端 | 2.100 | 1.435 | 1.511 | 1.806 | 1.315 | 1.337 | 1.232 | 1.023 | 1.041 | 0.966 | 1.377 | |
表4 影响因素和控制变量描述性统计Table 4 Descriptive statistics of influencing factors and control variables |
| 变量类型 | 符号 | 单位 | 平均值 | 标准差 | 极小值 | 极大值 |
|---|---|---|---|---|---|---|
| 因变量 | GE | — | 1.301 | 0.741 | 0.260 | 6.757 |
| 自变量 | Sub | % | 1.175 | 1.821 | 0.007 | 15.338 |
| Size | — | 22.014 | 1.092 | 19.212 | 24.031 | |
| 控制变量 | Roe | % | 7.050 | 13.986 | -54.110 | 84.670 |
| Fsr | % | 34.885 | 11.943 | 14.040 | 91.820 | |
| Lev | % | 37.015 | 20.021 | 1.561 | 85.492 | |
| Own | — | 0.539 | 0.498 | 0.000 | 1.000 | |
| Age | — | 2.862 | 0.297 | 2.079 | 3.784 |
数据来源:巨潮资讯网2010—2019年各稀土上市公司的年报资料。 |
表5 中国稀土产业财政支持效率影响因素回归结果Table 5 Regression results of factors influencing the efficiency of government finical support for China’s rare earth industry |
| 变量 | (1) | (2) | (3) | (4) | (5) |
|---|---|---|---|---|---|
| Sub-1 | 4.411*** (2.72) | 9.484*** (2.92) | 4.472* (1.83) | ||
| (Sub-1)2 | -48.251* (-1.66) | -15.869* (-1.72) | |||
| Size | 0.324*** (7.22) | 0.296*** (7.19) | |||
| Roe | -0.531** (-2.29) | -0.261 (-1.37) | -0.256 (-1.38) | 0.158 (0.87) | 0.211 (1.21) |
| Fsr | 0.539** (2.31) | 0.495* (1.71) | 0.491* (1.71) | 0.246* (1.88) | 0.184* (1.74) |
| Lev | -0.686*** (-4.73) | -0.699*** (-3.54) | -0.651*** (-3.35) | -0.005*** (-3.93) | -0.076*** (-4.44) |
| Own | 0.015 (0.16) | 0.190 (1.25) | 0.209 (1.40) | 0.018 (0.24) | 0.019 (0.27) |
| Age | -0.204*** (-3.17) | -0.153* (-1.73) | -0.161* (-1.85) | -0.323** (-2.35) | -0.344** (-2.51) |
| 常数项 | 2.462*** (7.93) | 0.824 (1.59) | 0.701 (1.38) | 0.789* (2.02) | -0.604 (0.95) |
| Year | 控制 | 控制 | 控制 | 控制 | 控制 |
| Wald检验 | 107.15** | 51.66*** | 53.08*** | 123.39*** | 111.05*** |
| 观测值 | 193 | 173 | 173 | 193 | 173 |
注:***、**、*分别表示z检验值在1%、5%和10%水平上统计显著,下表同。 |
表6 稳健性检验结果Table 6 Robustness test results |
| 变量 | 全样本 | 国有企业 | 民营企业 | |||
|---|---|---|---|---|---|---|
| (6) GMM | (7) DK | (8) FGLS | (9) FGLS | |||
| GE-1 | 0.351*** (7.39) | |||||
| Sub-1 | 4.672** (2.56) | 3.904** (2.90) | 5.587** (2.39) | 8.622* (1.87) | ||
| (Sub-1)2 | -16.189* (-1.92) | -15.461* (-1.78) | -21.491* (-1.76) | -65.313* (-1.75) | ||
| Size | 0.238*** (6.20) | 0.227*** (5.69) | 0.290*** (7.02) | 0.440*** (6.66) | ||
| Roe | -1.136* (-1.92) | -0.781* (-2.05) | 0.546* (1.75) | 0.052 (0.17) | ||
| Fsr | 1.335* (1.72) | 1.256* (1.91) | 0.026* (1.82) | 0.506* (1.78) | ||
| Lev | -0.367*** (-2.94) | -0.169*** (-2.79) | -0.571*** (-2.78) | -0.642*** (-2.81) | ||
| Own | 0.082 (1.01) | — | — | — | ||
| Age | -0.544*** (-3.34) | -0.138* (-1.76) | -0.476* (-1.91) | -0.213** (-2.69) | ||
| 常数项 | -4.583* (-1.95) | -1.498 (-0.30) | -6.021* (-2.45) | -3.718* (-1.81) | ||
| Year | 控制 | 控制 | 控制 | 控制 | ||
| Sargan检验 | 0.379 | — | — | — | ||
| AR(1)检验 | 0.042** | — | — | — | ||
| AR(2)检验 | 0.218 | — | — | — | ||
| Wald检验 | 298.37*** | — | 94.66*** | 116.70*** | ||
| F统计量 | — | 6961.47*** | — | — | ||
| 组间R-squared | — | 0.2317 | — | — | ||
| 观测值 | 173 | 173 | 93 | 80 | ||
| [1] |
王昶, 宋慧玲, 左绿水, 等. 中国优势金属供应全球需求的风险评估[J]. 自然资源学报, 2018,33(7):1218-1229.
[
|
| [2] |
王玉珍. 我国稀土产业政策效果实证研究[J]. 宏观经济研究, 2015, (2):39-49.
[
|
| [3] |
马乃云, 陶慧勇. 提升我国稀土产业出口定价权的财税政策分析[J]. 中国软科学, 2014, (12):179-186.
[
|
| [4] |
|
| [5] |
|
| [6] |
|
| [7] |
苏轶娜, 李雪梅. 中国优势矿产资源管理政策及其评价[J]. 中国人口·资源与环境, 2017,27(S1):164-167.
[
|
| [8] |
|
| [9] |
朱学红, 张宏伟, 李心媛. 中国稀土国际市场势力测度及政策有效性研究[J]. 国际贸易问题, 2018, (1):32-44.
[
|
| [10] |
|
| [11] |
|
| [12] |
|
| [13] |
|
| [14] |
|
| [15] |
杜凤莲, 王媛, 鲁洋. 中国稀土出口管制政策的理论分析与现实观察[J]. 稀土, 2014,35(2):112-118.
[
|
| [16] |
|
| [17] |
张晶, 杨子健. 当前我国稀土储备工作的问题及建议[J]. 宏观经济管理, 2016, (10):69-72.
[
|
| [18] |
陈斌彬. WTO“稀土案”与中国自然资源出口管制的完善[J]. 中国人口·资源与环境, 2017,27(1):120-127.
[
|
| [19] |
何欢浪, 冯美珍. 我国稀土产品出口政策效果评估的实证检验[J]. 世界经济研究, 2017, (11):88-99.
[
|
| [20] |
何欢浪. 供给侧改革背景下出口政策和竞争政策协调研究: 以战略性资源产品出口为例[J]. 国际贸易问题, 2019, (4):35-49.
[
|
| [21] |
杜凤莲, 王媛. 战略性资源关税的替代性政策研究: 以稀土出口为例[J]. 经济科学, 2015, (3):67-76.
[
|
| [22] |
宋益, 黄健柏, 钟美瑞, 等. 外部性成本内部化视角下战略性矿产资源关税替代性政策研究: 以稀土矿为例[J]. 资源科学, 2018,40(3):611-622.
[
|
| [23] |
财政部, 工业和信息化部. 稀土产业调整升级专项资金管理办法[EB/OL]. (2012-11-21) [2020-07-10]. http://www.gov.cn/zwgk/2012-11/21/content_2271992.htm.
[Ministry of Finance of the People’s Republic of China, Ministry of Industry and Information Technology of the People’s Republic of China. Management Measures of Special Funds for Rare Earth Industry Adjustment and Upgrading[EB/OL]. (2012-11-21) [2020-07-10]. http://www.gov.cn/zwgk/2012-11/21/content_2271992.htm. ]
|
| [24] |
安同良, 周绍东, 皮建才. R&D补贴对中国企业自主创新的激励效应[J]. 经济研究, 2009,44(10):87-98.
[
|
| [25] |
苏振东, 洪玉娟, 刘璐瑶. 政府生产性补贴是否促进了中国企业出口?基于制造业企业面板数据的微观计量分析[J]. 管理世界, 2012, (5):24-42.
[
|
| [26] |
许家云, 徐莹莹. 政府补贴是否影响了企业全球价值链升级?基于出口国内附加值的视角[J]. 财经研究, 2019,45(9):17-29.
[
|
| [27] |
巫强, 刘蓓. 政府研发补贴方式对战略性新兴产业创新的影响机制研究[J]. 产业经济研究, 2014, (6):41-49.
[
|
| [28] |
陆国庆, 王舟, 张春宇. 中国战略性新兴产业政府创新补贴的绩效研究[J]. 经济研究, 2014,49(7):44-55.
[
|
| [29] |
杨向阳, 童馨乐. 财政支持、企业家社会资本与文化企业融资: 基于信号传递分析视角[J]. 金融研究, 2015, (1):117-133.
[
|
| [30] |
|
| [31] |
|
| [32] |
刘海洋, 孔祥贞, 马靖. 补贴扭曲了中国工业企业的购买行为吗?基于讨价还价理论的分析[J]. 管理世界, 2012, (10):119-129.
[
|
| [33] |
余东华, 吕逸楠. 政府不当干预与战略性新兴产业产能过剩: 以中国光伏产业为例[J]. 中国工业经济, 2015, (10):53-68.
[
|
| [34] |
|
| [35] |
王克敏, 刘静, 李晓溪. 产业政策、政府支持与公司投资效率研究[J]. 管理世界, 2017, (3):113-124.
[
|
| [36] |
|
| [37] |
南晓莉, 张敏. 政府补助是否强化了战略性新兴产业的成本粘性?[J]. 财经研究, 2018,44(8):114-127.
[
|
| [38] |
白旭云, 王砚羽, 苏欣. 研发补贴还是税收激励: 政府干预对企业创新绩效和创新质量的影响[J]. 科研管理, 2019,40(6):9-18.
[
|
| [39] |
宋嘉宁. 国内稀土上市公司政府补助与研发投入关系实证分析[J]. 稀土, 2016,37(4):152-158.
[
|
| [40] |
|
| [41] |
|
| [42] |
陈诗一, 张军. 中国地方政府财政支出效率研究: 1978-2005[J]. 中国社会科学, 2008, (4):65-78.
[
|
| [43] |
唐齐鸣, 王彪. 中国地方政府财政支出效率及影响因素的实证研究[J]. 金融研究, 2012, (2):48-60.
[
|
| [44] |
李燕凌, 欧阳万福. 县乡政府财政支农支出效率的实证分析[J]. 经济研究, 2011,46(10):110-122.
[
|
| [45] |
王晓红. 精准扶贫视角下提升我国农业保险财政补贴效率研究[J]. 理论探讨, 2020, (1):102-107.
[
|
| [46] |
陈明艺, 裴晓东. 我国环境治理财政政策的效率研究: 基于DEA交叉评价分析[J]. 当代财经, 2013, (4):27-36.
[
|
| [47] |
周华庆, 杨家文. 巴士公交财政补贴及服务供给效率: 深圳改革的启示[J]. 中国软科学, 2015, (11):59-67.
[
|
| [48] |
|
| [49] |
张帆, 孙薇. 政府创新补贴效率的微观机理: 激励效应和挤出效应的叠加效应: 理论解释与检验[J]. 财政研究, 2018, (4):48-60.
[
|
| [50] |
李成, 李熙. 战略性新兴产业财政支持效率分析: 以广东省为例[J]. 科技管理研究, 2016,36(9):41-45.
[
|
| [51] |
肖宇, 夏杰长, 倪红福. 中国制造业全球价值链攀升路径[J]. 数量经济技术经济研究, 2019,36(11):40-59.
[
|
| [52] |
季书涵, 朱英明. 产业集聚、环境污染与资源错配研究[J]. 经济学家, 2019, (6):33-43.
[
|
| [53] |
周亚虹, 蒲余路, 陈诗一, 等. 政府扶持与新型产业发展: 以新能源为例[J]. 经济研究, 2015,50(6):147-161.
[
|
| [54] |
肖兴志, 姜晓婧. 战略性新兴产业政府创新基金投向: 传统转型企业还是新生企业[J]. 中国工业经济, 2013, (1):128-140.
[
|
| [55] |
韩港. 稀土产业供给侧改革的策略研究[J]. 管理现代化, 2017,37(3):26-29.
[
|
| [56] |
李馨子. 政府补助、持续性与未来盈余[J]. 管理评论, 2019,31(8):194-209.
[
|
| [57] |
戴浩, 柳剑平. 政府补助对科技中小型企业成长的影响机理: 技术创新投入的中介作用与市场环境的调节作用[J]. 科技进步与对策, 2018,35(23):137-145 .
[
|
| [58] |
郭玥. 政府创新补助的信号传递机制与企业创新[J]. 中国工业经济, 2018, (9):98-116.
[
|
| [59] |
刘虹, 肖美凤, 唐清泉. R&D补贴对企业R&D支出的激励与挤出效应: 基于中国上市公司数据的实证分析[J]. 经济管理, 2012, (4):19-28.
[
|
| [60] |
|
| [61] |
毛其淋, 许家云. 政府补贴对企业新产品创新的影响: 基于补贴强度“适度区间”的视角[J]. 中国工业经济, 2015, (6):94-107.
[
|
| [62] |
白俊红. 中国的政府R&D资助有效吗?来自大中型工业企业的经验证据[J]. 经济学(季刊), 2011,10(4):1375-1400.
[
|
| [63] |
|
| [64] |
高伟, 胡潇月. 新能源汽车政策效应: 规模抑或创新中介?[J]. 科研管理, 2020,41(4):32-44.
[
|
| [65] |
金宇超, 施文, 唐松, 等. 产业政策中的资金配置: 市场力量与政府扶持[J]. 财经研究, 2018,44(4):4-19.
[
|
| [66] |
吴一丁, 赖程. WTO稀土案败诉背景下的我国稀土行业效率提升路径研究[J]. 稀土, 2016,37(2):152-158.
[
|
| [67] |
财政部, 工业和信息化部. 国家物联网发展及稀土产业补助资金管理办法[EB/OL]. (2014-05-30) [2020-07-10]. http://www.gov.cn/gongbao/content/2014/content_2745938.htm.
[Ministry of Finance of the People’s Republic of China, Ministry of Industry and Information Technology of the People’s Republic of China. Management Measures of Subsidy Funds for the Development of National Internet of Things and Rare Earth Industry[EB/OL]. (2014-05-30) [2020-07-10]. http://www.gov.cn/gongbao/content/2014/content_2745938.htm. ]
|
| [68] |
|
| [69] |
|
| [70] |
李兰冰. 中国全要素能源效率评价与解构: 基于“管理-环境”双重视角[J]. 中国工业经济, 2012, (6):57-69.
[
|
| [71] |
|
| [72] |
|
| [73] |
工业和信息化部. 稀土行业发展规划(2016-2020年)[EB/OL]. (2016-09-29) [2020-07-10]. http://www.gov.cn/xinwen/2016-10/18/content_5120998.htm.
[Ministry of Industry and Information Technology of the People’s Republic of China. Development Plan of Rare Earth Industry (2016-2020)[EB/OL]. (2016-09-29) [2020-07-10]. http://www.gov.cn/xinwen/2016-10/18/content_5120998.htm. ]
|
| [74] |
刘思远, 牛冲槐, 姚西龙. 企业创新过程中的政府财政政策效率研究: 基于创新两阶段的视角[J]. 科技管理研究, 2017,37(14):33-40.
[
|
| [75] |
|
/
| 〈 |
|
〉 |